EXPERIMENTAL DETERMINATION OF THE ROUGHNESS FUNCTIONS OF MARINE
COATINGS
Y. K. Demirel
1, O. Turan
1, A. Incecik
1, S. Day
1, H. I. Fang
2, S. Downie
2, S. M. Olsen
3 1Department of Naval Architecture, Ocean and Marine Engineering, University of Strathclyde, 100 Montrose Street, Glasgow G4 0LZ, UK, yigit.demirel@strath.ac.uk
2
Lloyd's Register, Lloyd's Register Global Technology Centre, Southampton Boldrewood Innovation Campus, Burgess Road, Southampton, S016 7QF, UK, ivy.fang@lr.org
3
Hempel A/S, Lundtoftevej 150 KGS. LYNGBY Denmark DK-2800, stmo@hempel.com
ABSTRACT
The aim of this paper is to determine the roughness functions of different marine coatings, including two novel FOUL-X-SPEL paints and two existing commercial coatings, and two control surfaces, using the overall method of Granville (1987). An extensive series of towing tests of flat plates coated with different antifouling coatings was carried out at the Kelvin Hydrodynamics Laboratory (KHL) of the University of Strathclyde. The tests were designed to examine the as applied drag performances of FOUL-X-SPEL paints and compare them with two existing reference paints and two control surfaces. The surface roughness amplitude parameters of all of the test surfaces were measured using a hull roughness analyser. In total over 150 runs were carried out, including a series of repeat tests designed to quantify the uncertainty in the results. The drag coefficients and roughness function values of each surface were evaluated along with the uncertainty limits.
Keywords: Marine Coatings, Experiment, Roughness Functions
1. INTRODUCTION
The roughness of a hull’s surface significantly affects the flow and frictional resistance of a ship. The main contribution to hull roughness can be attributed to marine biofouling. For this reason, several types of antifouling coating systems are in widespread use to mitigate marine biofouling, thus reducing ship resistance and power requirements. Having said that, an antifouling coating system itself has an initial surface roughness which affects a ship’s frictional resistance; this initial roughness may ease the settlement of slime and subsequent marine organisms compared to an otherwise so-called smooth surface. A means of assessing the effect of the initial roughness of such a coating on resistance would therefore be of great benefit.
This study presents the results from resistance tests of flat plates coated with different marine coatings, including new paints developed within the FOUL-X-SPEL Project, two existing, commercial coatings, and two control surfaces. To the best of this author’s knowledge, no experimental study exists which compares the drag performances of antifouling surfaces with that of an uncoated ship hull condition. One of the aims of the present study is also to compare the resistance characteristics of the coatings with the ship hull, rather than only with a smooth surface. 6 different surface conditions are considered in the experiments given below:
- Sanded and polished smooth surface (Reference Plate)
- Existing TBT-free Self-Polishing Copolymer (SPC) (FoulXSpel 2)
- New FOUL-X-SPEL Polyurethane system with an immobilised biocide (F0037) - New FOUL-X-SPEL Silicone system with an immobilised biocide (F0034) - Existing Silicone-based foul release (FR) coating (FoulXSpel 1)
- Grit-blasted surface (Hull)
This paper is organised as follows: Details of the experiments conducted in this study, namely test plates, roughness measurements and test methodology are presented in Section 2. In Section 3, the results of the experiments then are given for the frictional resistance coefficients, an evaluation of roughness functions and roughness Reynolds numbers of the test surfaces is presented along with the uncertainty estimates. Finally, the results are discussed in detail in Section 4.
2. EXPERIMENT
The experiments were carried out at the Kelvin Hydrodynamics Laboratory (KHL) of the University of Strathclyde. The KHL test tank has dimensions of 76.0 m x 4.6 m x 2.5 m. The tank is equipped with a digitally-controlled towing carriage, state-of-the-art absorbing wavemaker, and a highly effective sloping beach. The carriage has a velocity range of 0 – 5 m/s, with the velocity range used in these experiments kept between 1.5 and 3.6 m/s. Fresh water was used in the experiments. The temperature of the water was monitored during the experiments in order to be able to evaluate drag coefficients according to the temperature.
The overall drag values of each plate were measured using displacement transducers using the Linear Variable Differential Transformer (LVDT) principle. These brand new transducers were purchased to ensure sensitive measurements of the resistance values, as well as to minimise the cross coupling of drag and side forces, since the differences of the resistance values between different surfaces were expected to be very small. It is of note that two transducers were used in the experiments; one for measuring the overall drag of the plates and one for checking the side forces. The intention was to keep the side forces effectively zero, to ensure the alignment of the plates.
Before the transducers were set on the plates, they were calibrated. These two transducers were calibrated separately across the expected load range. It should be noted that the expected loads were predicted using CFD simulations similar to those performed in (Demirel et al., 2014).
2.1 TEST PLATES
[image:2.595.194.412.480.627.2]The flat plates used for the tests were manufactured from 304 stainless steel sheet stock. Figure 1 depicts the dimensions of the flat plates. The leading edges of the plates were filleted to a radius of 2.5 mm while the trailing edge was kept sharp in order to mitigate the extra drag due to the separation as much as possible.
Figure 1: Dimensions of the flat plates.
Figure 2: Checking the flatness of the plates.
In total, 6 plates were manufactured in order to test different surface conditions. The surface conditions of the plates used in the experiments are explained below:
The Reference Plate was sanded using an orbital sander with abrasive grit. 80 grit, 120 grit and 320 grit sandpapers were used, respectively, and the plate was then polished using a polishing compound. This was expected to serve as a smooth surface. The surface preparation of this plate was performed by staff at the KHL.
The surface preparation and paint application for the remaining plates was performed according to the guidelines of HEMPEL by a professional paint company. Following a solvent wash to remove grease oil, the plates were grit blasted to Sa3 standard using aluminium oxide grit G17. Paints were then applied to each plate.
Plate 1 was coated with an existing TBT-free SPC. From this point onward this plate is referred to as FoulXSpel 2. Plate 2 was coated with a new FOUL-X-SPEL Polyurethane system with an immobilised biocide (F0037). From this point onward this plate is referred to as F0037 (Figure 3).
Figure 3: F0037.
Plate 3 was coated with a new FOUL-X-SPEL Silicone system with an immobilised biocide (F0034). From this point onward this plate is referred to as F0034. Plate 4 was coated with an existing silicone-based FR coating. From this point onward this plate is referred to as FoulXSpel 1. Plate 5 was uncoated but grit blasted to Sa3. In other words, the surface preparation required for a coating application was performed, but it was left uncoated. This plate was used to replicate ship hulls without any paint. From this point onward this plate is referred to as Hull.
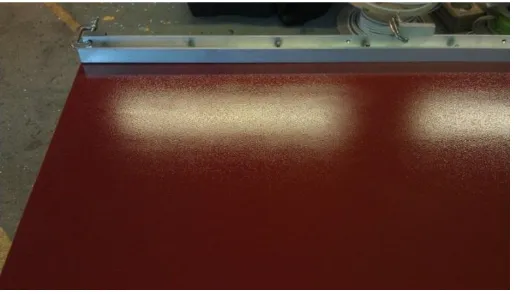
[image:3.595.177.434.418.565.2]Figure 4: FoulXSpel2 ready to tow.
Figure 5: Hull ready to tow.
[image:4.595.177.434.528.722.2]Figure 7: FoulXSpel2 being towed at a high speed.
2.2 ROUGHNESS MEASUREMENTS
The average hull roughness (Rt50) values of all test plates were measured before and after the towing procedure
using a TQC Hull Roughness Gauge, which possesses a control unit and a sensor unit. The sensor unit has three non-slip wheels and a carbide tipped stylus (TQC, 2014). The sensor unit is moved horizontally over the plates. During this movement of the sensor unit, the maximum peak to trough roughness height over a 50 mm interval is measured. This is termed the Average Hull Roughness (AHR) or Rt50. The Rt50 range of the device is
from 0 to 2500 m with an accuracy of ±5m or ±2% of the measured data, whichever is greater. A TQC Hull roughness Gauge is shown in Figure 8.
[image:5.595.167.444.452.609.2]8 measurement lanes were selected on each side of the surfaces. 4 of them were from leading edge to trailing edge and the other 4 were from trailing edge to leading edge. Figure 9 shows the process of taking a roughness measurement of F0037. AHR values of each plate before towing are given in Table 1.
Figure 8: TQC Hull Roughness Gauge.
Table 1: Rt50 values of the plates. Plate Rt50 (m) Reference Plate 13±5
Figure 9: Measurement of the roughness of F0037 using a TQC Hull Roughness Gauge.
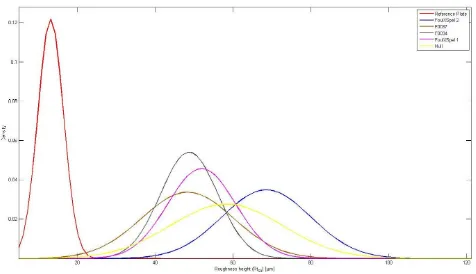
Normal distributions of the probability density functions of all of the test surfaces are shown together in Figure 10. As can be seen from Figure 10, the Reference Plate has a lower mean roughness height and the distribution of its roughness is narrower than that of the others. This is expected, since the Reference Plate was sanded using 320 grit sandpaper and then polished using a polishing compound. Hence, it was expected to be smooth, with a relatively homogenous roughness distribution.
FoulXSpel 2 has a higher mean roughness value than the other surfaces, which is in agreement with the higher resistance values given in Section 3.1. FoulXSpel 1, F0034 and F0037 have similar mean roughness values whereas the mean value of F0034 has the highest probability density. This can be attributed to a more homogenous roughness height distribution, and it supports the results given in Section 3.1. The mean roughness value of Hull falls into the region between FoulXSpel 2 and the other surfaces. It can be concluded from this that FoulXSpel 2 increases the mean surface roughness of a ship hull, while the other coatings reduce the mean roughness height compared to an otherwise uncoated ship hull. It should be noted that the mean roughness height may not be the only parameter with which to assess the resistance characteristics of different surfaces, but it does provide a very useful means of assessing the differences between similar families of coatings, such as silicone based coatings. Figure 10 demonstrates the probability density functions (pdf) of the roughness data of all of the test surfaces.
[image:6.595.66.542.473.747.2]2.3 TEST METHODOLOGY
The test methodology followed in this chapter is similar to that used by Schultz (2004) and Demirel et al. (2015). The Reference Plate was first towed repeatedly and the alignment of the plates adjusted until the side force was effectively zero. Once this was achieved, no further adjustments were made to the alignment over the course of the experiments. The side force of the plate was monitored for each run to ensure this alignment was maintained.
The residuary resistance occurs due to the wavemaking resistance and pressure resistance of the plates, while the frictional resistance arises due to shear stresses on the plate surface. It is of note that in this case, the pressure drag is expected to be negligible since the thickness of the plates is only 5mm. The surface roughness of antifouling coatings affects only skin friction resistance, which is equivalent to flat plate frictional resistance.
Once the total drag, RT, values are obtained for each plate and related speeds, they were non-dimensionalised
by dividing each term by the dynamic pressure and wetted surface area of the plates.
Showing similarity to the resistance decomposition, the total resistance coefficient, CT, is made up of the
residuary resistance coefficient, CR, and the frictional resistance coefficient, CF. Given that the residuary
resistance coefficient is a function of the Froude number, Fr, and the frictional resistance coefficient is a function of the Reynolds number, Re, the total resistance coefficient can, therefore, be written in the following form:
(
)
(
)
T R F
C
C Fr
C
Re
(1)The Karman-Schoenherr friction line (Schoenherr, 1932) given by (2) for a smooth plate can be used to predict the frictional resistance coefficients of a smooth flat plate.
0.242
log(Re
F)
FC
C
(2)The CF values of the reference smooth plate are therefore assumed to be equal to the CF values obtained using
(2). It is of note that Candries (2001) and Schultz (2004) also showed that equation (2) can be used for the prediction of the frictional resistance of flat plates.
The differences between the CT values obtained using the experimental data and the CF values obtained using
(2) were assumed to be the CR values of the Reference Plate as shown by (3). The computed CR values were
taken to be the CR values of all the test surfaces (eq. (4)), since the residuary resistances of the plates were not
expected to be significantly affected by the surface roughness (Schultz, 2007). Hence, the CF values of the test
surfaces were computed by subtracting the CR values of the Reference Plate from the CT values of the test
surfaces as shown by (5). The mathematical process for this is outlined below.
s s s
R T F
C
C
C
(3)s r
R R
C
C
(4)r r r
F T R
C
C
C
(5)'
R
2
1
1
3
1
2
2
2
2
eL F F F
R
F R R
C
C
C
k
k
U
L
C
(6)'
2
2
1
19.7
2
2
2
F F F
F S F R S R R
C
C
C
U
U
C
C
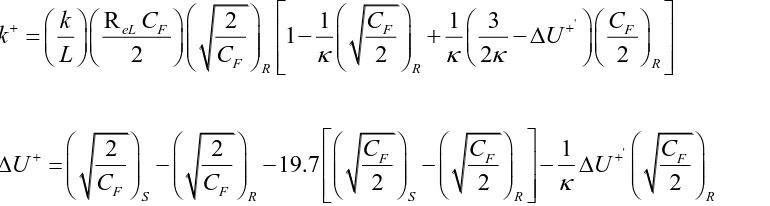
(7)where L is the plate length, ReL is the plate Reynolds number, CF is the frictional drag coefficient, U
+’
is the roughness function slope, which is the slope of U+ as a function of ln(k+), and the subscript S indicates a smooth condition whereas the subscript R indicates a rough condition.
3. RESULTS
3.1 FRICTIONAL RESISTANCE COEFFICIENTS
Having presented the necessary uncertainty estimates, this section addresses the results of the resistance tests. The frictional resistance coefficient (CF) values are calculated as explained in Section 2.3 and are
presented and discussed in detail since the focus is on the frictional resistance.The changes in the CF values of
the test plates with respect to the Reference Plate are given in Table 2. Figure 11 illustrates the frictional resistance coefficients of all of the test surfaces together with their CR values.
It is clearly seen that F0034 showed the best frictional resistance performance among all of the antifouling coatings, with an average decrease of 0.79% with respect to the Reference Plate. F0034 is the only one which led to a decrease compared to the Reference Plate. FoulXSpel 1 had the second best performance with an average increase of 0.186% with respect to the Reference Plate. It is followed by F0037 with an average increase of 0.96 % with respect to Reference Plate. It is also worthwhile to note that FoulXSpel 2 showed the worst frictional resistance performance among the entire set of test surfaces with an average increase of 5.16% with respect to the Reference Plate. This was also the only coating which led to an increase in CF with respect
to the Hull surface. It should be noted that the average increases and decreases given in the discussions in this section were calculated by omitting the CF values corresponding to speeds of 2.739 m/s and 2.86 m/s, since
[image:8.595.60.445.69.172.2]unexpected drag increases were recorded at these speeds due to wave reflection.
Table 2: Change in CF values of the test plates with respect to the Reference Plate.
Speed Change in CF (%) with respect to the Reference Plate
m/s FoulXSpel 2 F0037 FoulXSpel 1 F0034 Hull
1.5 1.22 0.88 -1.79 -1.59 0.93 1.857 5.34 0.84 3.15 2.19 1.63 2.131 4.68 1.31 -0.38 -1.62 1.57 2.28 4.02 0.34 -1.04 -1.96 2.20 2.435 4.98 0.72 -0.70 -2.13 2.52 2.739 5.67 4.46 1.48 2.60 6.32 2.86 8.62 5.78 5.87 5.55 2.96 3.013 5.59 1.59 0.57 0.79 2.68 3.14 7.87 1.23 2.52 -0.36 3.53 3.287 6.51 1.61 0.82 -0.20 3.71 3.45 6.04 0.59 -0.40 -0.97 3.89
Figure 11: Frictional resistance coefficients of all test surfaces together with CR values.
3.2 DETERMINATION OF ROUGHNESS FUNCTIONS
Roughness Reynolds numbers, k+, and roughness function values, U+, for all of the surfaces were obtained iteratively using (6) and (7) following the overall procedure of Granville (1987) using the present experimental data.
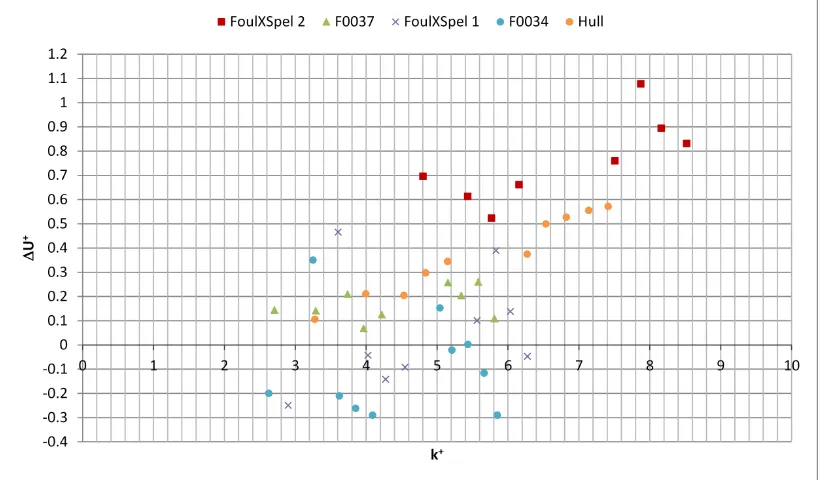
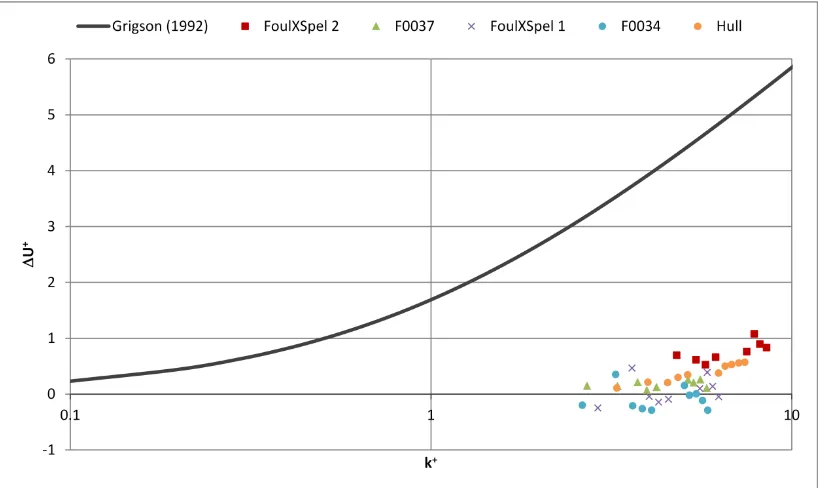
The evaluated roughness functions against roughness Reynolds numbers using Rt50 as the roughness length
scale are shown in Figure 12. Shown for comparison in Figure 13 is the Colebrook type roughness function model of Grigson (1992) together with the roughness functions shown in Figure 12, using logarithmic scale in the x-axis. It is of note that some of the abnormal data due to wave reflection were not included in these figures.
[image:9.595.101.514.478.718.2]Figure 13: The roughness functions for all of the test surfaces together with the roughness function model of Grigson (1992).
As evident from Figure 12 and Figure 13, almost all of the roughness function values are below those of the Hull surface, except for FoulXSpel 2. This result suggests that all of the antifouling coatings, except for FoulXSpel 2, provide an improvement with respect to a bare ship hull, in terms of as applied frictional resistance performances. Another interesting result is that almost all of the roughness function values of F0034 are negative, which suggests the surface of F0034 is acting better than even the smooth surface similar to two nanostructured and fluorinated polymer coatings investigated by Atlar et al. (2012). Some roughness function values of FoulXSpel 1 are also negative. That is to say, the calculated frictional drag coefficients of these points are lower than those calculated using the theoretical Schoenherr (1932) friction line given by (2). For these points, the velocity profile in the turbulent boundary layer would have an upward shift which manifests itself as a decrease in frictional resistance.
It should be noted that the roughness functions against roughness Reynolds numbers given in Figure 13 were calculated using Rt50 as the length scale as a reference and for consistency with the rest of the figures.
3.3 REPEATABILITY AND UNCERTAINTY ESTIMATES
Uncertainty estimates for the drag coefficients and roughness function calculations were made through repeatability tests using the procedure defined by the ITTC (2002). The repeatability tests were performed at two speeds, namely 1.857 m/s and 3.591 m/s, which correspond to Reynolds numbers of ~2.6x10⁶ and ~5x10⁶, respectively.
The bias uncertainty in CF ranged from ±0.708% at the lower Reynolds number to ±0.048% at the higher
Reynolds number, while the precision uncertainty in CF ranged from ±0.532% at the lower Reynolds number to
±0.008% at the higher Reynolds number. The overall uncertainty in CF ranged from ±0.879% at the lower
Reynolds number to ±0.058% at the higher Reynolds number. The overall uncertainty levels of the drag coefficients are sufficient when compared to other experiments given in the literature such as Schultz (2004). The very small precision limits reveal the excellent repeatibility of the experiments.
The details of the procedures to carry out an uncertainty analysis can be found in ITTC (2002) and Coleman and Steele (1999).
4 DISCUSSION AND CONCLUSIONS
An experimental study of the resistance of different marine coatings was performed. Six flat plates with different surfaces were towed at the Kelvin Hydrodynamics Laboratory (KHL) of the University of Strathclyde.
Firstly, flat plates were exposed to the required surface preparations and four of them were coated with different coatings, including new coatings developed within the FOUL-X-SPEL Project. Afterwards, the Rt50 values of all
of the test surfaces were measured using a hull roughness gauge. Then, the plates were towed at a range of speeds and the total resistances of the surfaces were measured. The resistance values were then non-dimensionalised and presented in a comparative manner. The frictional resistance coefficients of all of the test surfaces were then computed using assumptions that suggest the frictional resistance coefficients of smooth surfaces obey the Karman-Schoenherr friction line (Schoenherr, 1932) and that the residuary resistances of flat plates are not affected by surface roughness. Uncertainty estimates were made through repeatability tests, with the uncertainty values found to be sufficient to ensure a reliable comparison.
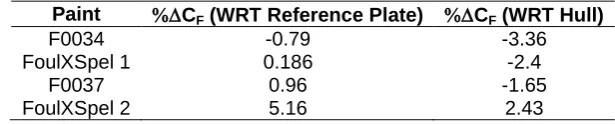
[image:11.595.148.456.341.403.2]Table 3 ranks all of the paints in decreasing order from best to worst in terms of frictional resistance characteristics. They also show the changes in CF values with respect to both the Reference Plate and Hull.
Table 3: Paint rankings and the change in frictional resistance coefficient with respect to the Reference Plate and Hull.
Paint CF (WRT Reference Plate) CF (WRT Hull)
F0034 -0.79 -3.36
FoulXSpel 1 0.186 -2.4
F0037 0.96 -1.65
FoulXSpel 2 5.16 2.43
The as applied resistance characteristics of F0034 were found to be the best among the entire set of test surfaces, especially at high Reynolds numbers. F0034 showed lower frictional resistance coefficient values compared to even the smooth Reference Plate.
Afterwards, roughness function values of all of the test surfaces were calculated using an indirect method, following the overall method of Granville (1987). It was observed that above a certain speed, the roughness function values for F0034, F0037 and FoulXSpel 1 tend to decrease with increasing roughness Reynolds number, as opposed to those for FoulXSpel 2, Hull and other surfaces used by Schultz (2004). The descending behaviour of the roughness functions of F0034, F0037 and FoulXSpel 1 is in agreement with the findings of Candries (2001), Ünal et al. (2012) and Atlar et al. (2012).
The effects of the surface properties of the new-generation FR coatings and novel FOUL-X-SPEL coatings on the frictional resistance were experimentally shown in this paper. This study evidently showed that as applied drag performances of marine coatings are of great importance for energy efficient shipping since they markedly affect the frictional resistance of flat plates. The effect of FOUL-X-SPEL coatings on the frictional resistances of flat plates of several ship lengths can be predicted utilising the roughness functions obtained in this study.
In this study, Rt50 values of each coating were measured with a hull roughness gauge and therefore only Rt50
was used as the roughness length scale. A piece of future work might be to measure additional roughness parameters using an optical measurement so that the effect of surface texture can be taken into account. In addition, other length scales and roughness function models should be further investigated in order to obtain an acceptable and meaningful correlation.
ACKNOWLEDGEMENTS
The authors gratefully acknowledge that the research presented in this paper was partially generated as part of the EU funded FP7 project FOUL-X-SPEL (Environmentally Friendly Antifouling Technology to Optimise the Energy Efficiency of Ships, Project number 285552, FP7-SST-2011-RTD-1).
REFERENCES
Atlar, M., Ünal, B., Ünal, U. O., Politis, G., Martinelli, E., Galli, G., Davies, C. & Williams, D. (2012). An experimental investigation of the frictional drag characteristics of nanostructured and fluorinated fouling-release coatings using an axisymmetric body. Biofouling, 29, 39-52.
Candries, M. (2001). Drag, boundary-layer and roughness characteristics of marine surfaces coated with
antifoulings. PhD Thesis, University of Newcastle upon Tyne.
Coleman, H. W. & Steele, W. G. (1999). Experimentation and Uncertainty Analysis for Engineers, Wiley.
Demirel, Y. K., Khorasanchi, M., Turan, O., Incecik, A. & Schultz, M. P. (2014). A CFD model for the frictional resistance prediction of antifouling coatings. Ocean Engineering, 89, 21-31.
Demirel, Y. K., Turan, O. & Day, S. (2015). Experimental determination of added hydrodynamic resistance caused by marine biofouling on ships. 4th International Conference on Advanced Model Measurement Technologies for the Maritime Industry, Istanbul, Turkey.
Granville, P. S. (1987). Three indirect methods for the drag characterization of arbitrarily rough surfaces on flat plates. Journal of Ship Research, 31, 70-77.
Grigson, C. (1992). Drag losses of new ships caused by hull finish. Journal of Ship Research, 36, 182-196.
ITTC (2002). Uncertainty Analysis, Example for Resistance Test. ITTC Recommended Procedures and
Guidelines, Procedure 7.5-02-02-02, Revision 01.
Schoenherr, K. E. (1932). Resistances of flat surfaces moving through a fluid. Transactions of SNAME, 40, 279-313.
Schultz, M. P. (2004). Frictional resistance of antifouling coating systems. Journal of Fluids Engineering, 126, 1039-1047.
Schultz, M. P. (2007). Effects of coating roughness and biofouling on ship resistance and powering. Biofouling,
23, 331-341.
TQC. (2014). Hull Roughness Gauge [Online]. http://www.tqc.eu/en/products/article/hull-roughness-gauge. [Accessed 09.06.2014.