Rochester Institute of Technology
RIT Scholar Works
Theses Thesis/Dissertation Collections
7-1-2009
Absence of freight transportation plans in state and
county emergency operations plans
Christine Brown
Follow this and additional works at:http://scholarworks.rit.edu/theses
This Thesis is brought to you for free and open access by the Thesis/Dissertation Collections at RIT Scholar Works. It has been accepted for inclusion in Theses by an authorized administrator of RIT Scholar Works. For more information, please [email protected].
Recommended Citation
Absence of Freight Transportation Plans in State and
County Emergency Operations Plans
by Christine Brown
Masters of Science
Science, Technology and Public Policy Thesis Submitted in Fulfillment of the
Graduation Requirements for the
College of Liberal Arts/Public Policy Program at ROCHESTER INSTITUTE OF TECHNOLOGY
Rochester, New York
July 2009
Submitted by:
Christine Brown
Signature Date
Accepted by:
Franz Foltz, Thesis Advisor
Graduate Coordinator Signature Date
STS/Public Policy Department/College of Liberal Arts
James Winebrake, Committee Member
Department Chair Signature Date
STS/Public Policy Department/College of Liberal Arts
Jennifer Schneider, Committee Member
2 | P a g e
Table of Contents
Abstract ... 4
1. Introduction ... 5
2. Literature Review ... 9
2.1 Transportation Plans and the Importance of Freight Transportation ... 9
2.2 Disruption to Freight Transportation and the Effects ... 13
2.3 Freight Transportation Planning ... 17
2.4 Current State Emergency Operations Plans ... 18
2.4.1 Current Emergency Operations Plan in Florida ... 19
2.4.2 Current Emergency Operations Plan in Georgia ... 21
2.4.3 Current Emergency Operations Plan in South Carolina... 22
2.4.4 Current Emergency Operations Plan in North Carolina... 24
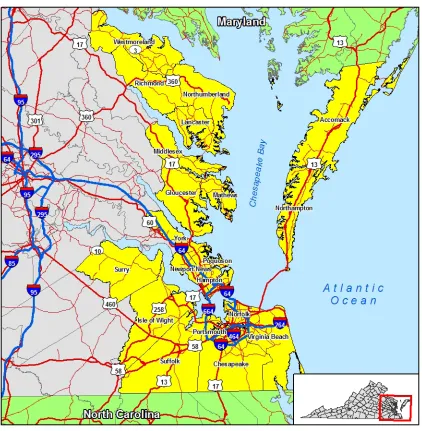
2.4.5 Current Emergency Operations Plan in Virginia ... 26
2.4.6 Current Emergency Operations Plan in Maryland ... 30
2.5 Research Questions ... 32
3. Methodology ... 33
3.1 Data Collection ... 36
4. Results and Discussion ... 40
4.1 Current County and Local Level Emergency Operations Plans ... 40
4.1.1 Current Emergency Operations Plan in Miami, Florida ... 40
4.1.2 Current Emergency Operations Plan in Jacksonville, Florida ... 46
4.1.3 Current Emergency Operations Plan in Savannah, Georgia ... 51
4.1.4 Current Emergency Operations Plan in Charleston, South Carolina ... 54
3 | P a g e
4.1.6 Current Emergency Operations Plan in Norfolk, Virginia ... 62
4.1.7 Current Emergency Operations Plan in Baltimore, Maryland ... 65
4.2 Comparison of State and Local Emergency Operations Plans with respect to Comprehensiveness of Freight Transportation Planning ... 69
4.3 Optimal Plan ... 72
4.4 Limitations and Further Research ... 73
5. Policy Implications ... 76
6. Conclusions ... 80
4 | P a g e
Abstract
5 | P a g e
1. Introduction
Hurricane Katrina is likely to end up being the most economically-disruptive U.S. natural disaster in years. A significant amount of crude oil, natural gas and gasoline production has been halted by the hurricane with uncertainty as to when production will come back on line. The Port of South Louisiana is the largest port in the U.S. by tonnage and the fifth largest port in the world. The Port of New Orleans is the sixth largest port in the U.S. We export about a quarter of our agricultural grain production of which about a half is shipped through the ports at the mouth of the Mississippi River. Imports coming into the Ports of South Louisiana and New Orleans include petroleum products, steel, coal, chemicals, fertilizers and concrete. These ports are closed now. Our rail freight system already was operating at high rates of capacity utilization before Hurricane Katrina struck. Therefore, the transport of grain and other bulk freight by rail to other ports will strain the capacity of our rail system. Moreover, with the rise in the price of diesel fuel, the cost of rail-freight transport will increase. In addition, some non-Mississippi River ports already are operating near capacity. Lack of manpower to operate ports, pipelines and refineries in the New Orleans area also is likely to be an issue. Evacuated workers do not have homes to come back to and essential services to sustain them and their families. In short, Hurricane
Katrina has temporarily constrained our economy's ability to produce goods and services (emphasis added by thesis). How long this constraint will persist is
unknowable at this time (Kasriel, 2005).
In a country as developed as the United States, natural disasters are one of the few events that
still set the nation back in terms of economic costs and the nation’s ability to return to normal.
Currently the primary focus of the federal government is responding to natural disasters when
they occur. In 2007, FEMA spent $4.8 billion on Disaster Recovery Programs and $3.6 billion
on Mitigation programs (CBO, 2008). Estimates for recovery spending in future years decrease;
however if a natural disaster occurs, the President has authorization to declare emergency
funding available to the area impacted. The cost of this recovery-based focus was estimated to
6 | P a g e
experienced by the United States (Wallace & Millar, 2004). The $200 billion is just for
weather-related disasters – it does not take into account other types of natural disasters such as wildfires
or earthquakes or manmade disasters.
With so much funding being dedicated to recovering from natural disasters, allocated funds must
be used in the most efficient way possible. For integral systems, like transportation, adequate
attention can result in effective recovery, while also using funds to increase resiliency. Coastal
transportation infrastructure networks are highly sensitive to natural disasters while also being an
important resource for the success of rescue, recovery and renovation operations; as such,
prompt restoration of such networks becomes of critical importance for disaster relief services
(Karlaftis, Kepaptsoglou, & Lambropoulos, 2007). Transportation professionals face the
challenge of maintaining and optimizing mobility during a crisis. For a comprehensive approach
to resiliency and effective freight routes following a natural disaster, policy changes will need to
be supported by those involved.
Disruption of freight routes has an effect on industry. For example, the flooding in the Midwest
in 1993 caused disruption in freight transport for the entire nation. After floodwaters receded,
the industry took stock of their losses. The Association of American Railroads, an industry
group, estimated $205 million in repairs to flood-damaged track, equipment, and rolling stock in
the Midwest. The industry experienced millions more in lost freight business (Pena, August
1993). Likewise, after Hurricane Katrina, restoring the freight industry resulted in high costs.
7 | P a g e
wake of natural disasters, commodities can be routed to other ports or simply held in storage, but
it would entail a higher cost” (Rose & Schmeltzer, 2005).
Rebuilding freight transportation systems is especially important as delivering supplies to
disaster-ravaged areas is one of the main challenges seen by relief agencies (Cottrill, 1998).
Once rebuilding efforts begin the need for durable goods and building materials helps the freight
industry recover. Trucking companies help FEMA by transporting generators, tools, and
household goods as the needs arise (Roberts, 2006). FedEx has partnered with the American
Red Cross since 1996, and has created a miniature version of its own Memphis, Tennessee,
control room at the relief group's Washington, D.C., headquarters (Spring, 2006). INSEAD, a
French business school, estimates that as much as 20 to 25 percent in the cost of rerouting and
lost revenue could be saved on transport in disaster response (Spring, 2006).
Freight transportation planning following a natural disaster is both a public policy issue and a
science and technology issue. Public policy is defined as the course of action a government
takes to address a problem affecting society. Therefore, any emergency operations plans created
at either the state or local level can be considered a policy because it is a specific course of action
meant to deal with a problem (natural disaster) that most certainly affects society. Freight
transportation is linked with science and technology because of the planning tools that can be
applied to effectively reroute transportation systems are linked with current technology. Without
applications such as GIS, it would be almost impossible to see how events may unfold in real
time. Effective freight transportation planning following a natural disaster would be an
8 | P a g e
This thesis provides an examination of the importance of freight transportation being included in
emergency operations plans for coastal cities following a natural disaster. Furthermore, policy
recommendations will be provided regarding implementing freight transportation plans into
already existing emergency operations plans. The purpose of this thesis is to address two
research questions.
1) Do local emergency operations plans include more freight transportation planning than
state emergency operations plans?
9 | P a g e
2. Literature Review
The literature review for this thesis will take three approaches. First, this thesis will examine
current transportation plans and developments within the transportation planning sector
regarding route alteration in emergencies. Second, research will show the economic effects that
can occur with freight transportation interruptions. The economic effects will also be highlighted
with historical instances involving earthquakes and hurricanes. Third, a comprehensive review
of current state emergency operations plans is included within the literature review. The state
emergency operations plans were examined for their inclusion of transportation, specifically
looking for any mention of freight transportation networks. The purpose of this literature review
is to give sufficient background pertaining to transportation planning, economic impacts of
natural disasters, and an overview of emergency operation planning at the state level.
2.1 Transportation Plans and the Importance of Freight Transportation
The issue of transportation routes being altered due to natural disasters is not an issue untouched
by current research. One focus on transportation has been on the effectiveness of evacuation
routes following a natural disaster. An appropriate focus of the government as the first
responsibility in the case of a natural disaster is getting those in danger to safety. One analysis
conducted by Liu (2007) presents a model reference adaptive control (MRAC) framework for
real-time traffic management under emergency evacuation. Distinct from the well-studied
evacuation planning, real-time traffic management for evacuation aims to dynamically guide
(control) traffic flow under evacuation in such a way that certain system objective (e.g.,
10 | P a g e
based on both dynamic network modeling techniques and adaptive control theory, by considering
the traffic network under evacuation as a dynamic system (Liu, Ban, Ma, & Mirchandani, 2007).
Another examination of evacuation efforts, done by Wolshon and Hamilton (2005), looks
specifically at evacuations following hurricanes. In a two-part series the authors review
transportation-engineering aspects of hurricane evacuations, address policies and practices for
transportation system planning, preparedness, and response, and summarize the state of current
practice from the perspective of evacuation traffic operations, management, and control
(Wolshon, et al., 2005).
Unlike the examinations focused on evacuation, there are also broader studies on emergency
preparedness with a focus on the transportation sector. Sisiopiku (2007) undertook a project that
developed and tested emergency response scenarios for the Birmingham, Alabama region. It
used CORSIM traffic simulation software to model the major area traffic corridors into a
regional transportation network. Then, the regional model was utilized to test and evaluate
emergency management strategies in response to natural or human-caused disasters. Appropriate
preparedness and response measures of effectiveness (MOEs) were selected to support the
assessment process at the region-wide and/or corridor level. Candidate response actions were
compared and evaluated on the basis of these MOEs and recommendations were developed on
best practices and needs (Sisiopiku, 2007).
Lambert (2002) did another study with a tighter focus on the specific case of hurricanes. Lambert
11 | P a g e
dependencies and subsequent delays that arise among federal, state, and local agencies and
organizations involved in the pre and post hurricane processes in order to reduce the time for a
region to recover from a natural disaster. A transportation agency could use the developed
methodology to identify, prioritize, and minimize the negative effect of schedule dependencies
within and among agencies in recovery from a region wide disaster (Lambert, 2002).
Transportation and freight route alterations following a natural disaster are also a concern for the
Department of Transportation (DOT). The DOT has initiated a $21 million program to improve
evacuations resulting from unexpected events. Through the National Academies’ report, the
organization realizes the transportation system usually has redundant capacity—alternate routes
and alternate transportation modes (NRC, 1999). A more important point made in the report is,
“redundancy is low in some specific cases, such as passenger transport in major cities during
peak commuting periods, or some types of freight transport.” Recommendations from the
National Academies state that DOT should conduct a study of the system’s redundancies to
determine where there is a lack of redundancy. The DOT currently focuses on tactical
vulnerabilities and not strategic vulnerabilities (NRC, 1999).
The Transportation Research Board (TRB) has also looked into the issue of emergency
preparedness. The TRB publishes guides for emergency transportation operations as well as
emergency response preparedness information. These guides outline a coordinated,
performance-oriented, all-hazard approach called “Emergency Transportation Operations”
(ETO) and focus on an enhanced role for state departments of transportation as participants with
12 | P a g e
nation’s ability to deal with the movement of people, goods, and services before, during, and
after emergencies (Transportation Research Board, 2008).”
The Federal Highway Administration has conducted research on Intelligent Transportation
Systems (ITS). The DOT has examined disadvantages of the transportation system. One finding
is that transportation analysis tools are not used to process incident information. If transportation
analysis tools were used they could inventory the information and make recommendations for
specific actions that could be taken by the transportation system. These tools might lead to better
management of events in real-time. The recommendations from this study focus on a more
automated system for rerouting freight and transportation following a natural disaster (FHA,
2003).
There are many approaches taken by the Federal Highway Administration when examining the
dilemma of freight routes following natural disasters. Another study supported by the DOT
scans and synthesizes current practices and state of transportation practices as related to
redundancy and recovery of Transportation Management Centers (TMCs). The
recommendations from this report concentrate on methods, and procedures for planning, design,
develop and implement recovery plans and redundancy of TMCs (FHA, 2007). The most
consistent recommendation from these studies in general is that there needs to be a more
13 | P a g e
2.2 Disruption to Freight Transportation and the Effects
Many studies have been done regarding the economic effects of interrupted freight
transportation. Though the majority of these studies have focused on the effects following
earthquakes, similar economic losses could be expected from other natural disasters. Therefore
some parallels can be drawn between disruption of freight transportation following an earthquake
and those that might occur following a hurricane.
One such study was conducted by Chang (2000) regarding the Port of Kobe (Japan) following
the 1995 Great Hanshin earthquake, concerning international container traffic. The findings of
the study show how freight transportation can be affected by a natural disaster. One of the most
important losses suffered in the Great Hanshin (Kobe) earthquake consisted of damage to the
Port of Kobe. The Port suffered extensive ground failure in the earthquake, including
liquefaction and lateral displacement, that damaged all of its container berths and almost all of its
non-container shipping berths. Gantry cranes, warehouses, all bridges to Rokko and Port Islands,
and utility lines carried by these bridges all suffered major damage. The Port was essentially shut
down as a result. Damage was estimated at 1 trillion yen (US$10 billion). Although
reconstruction proceeded rapidly, the scale of damage was so great that repairs were not
completed until March 1997, over two years after the earthquake. In the meantime, traffic that
would have gone through Kobe was diverted to other ports (Chang, 2000).
Chang found one very important observation from examining the Port of Kobe in the wake of the
14 | P a g e
major damage may lead to significant short-term loss of port revenue and long-term loss of
traffic and competitive position. The issue of long-term loss represents a potentially important
lesson for disaster planners in the US. In a future catastrophic earthquake, economic losses may
be much larger than what these models predict, due to long-term losses arising from both the
scale and the duration of disruption (Chang, 2000).
Another study completed by Satoshi Tsuchiya (2007), examined what would occur in Japan
following two possible earthquake scenarios. The first scenario of disruption increases transport
cost in the affected area that eventually spreads all over the region. The total transport-related
losses amount to 18.5 billion yen per day. The second scenario of transportation disruption
results in transport-related losses worth a total of 36.4 billion yen per day. What Tsuchiya
showed with research was the extent of the impacts of transportation network disruptions and the
difference of the transport-related losses that is estimated in conditions of disruption scenarios.
Furthermore, the network levels of development implied the importance of network redundancy
at the interregional level (Tsuchiya, 2007).
One study, conducted following an earthquake in the United States, focused on the Northridge,
California earthquake of 1994. Gordon (1998) found a local impact of at least $1.5 billion
associated with transportation disruptions that is a significant proportion of overall business
interruption (27.3%). This research also estimated an equivalent earthquake on the longer and
more dangerously located Newport-Inglewood Fault and yielded a potential total cost impact of
about $80 billion (with a much higher business interruption component of $33 billion); applying
15 | P a g e
interruption cost of $9.0 billion (Gordon, 1998). Gordon’s work shows that interruptions to
freight transportation can be quite costly to a coastal area of the United States.
Another analysis of the 1994 Northridge earthquake that destroyed portions of the I-5, I-10 and
other highways near Los Angeles found that road closures caused approximately 4,400 truck
hours of delay each workday during reconstruction. The overall impact on the economy in terms
of job loss and business closure was not calculated, but it’s estimated that the average shipping
costs increased by eight percent as a result of the road closures (Wesemann, et. al. 1996).
A case study by Grenzeback and Lukmann examined the economic impacts on the transportation
sector by Hurricanes Katrina and Rita. It is an especially pertinent case study because it focused
on freight transportation. According to the study, even though CSX was the most negatively
impacted railroad, impact on rail revenue was insignificant. Neglecting interchange traffic, CSX
only delivered and received 23,000 merchandise carloads in all of Louisiana last year and a slim
15,000 carloads in Mississippi. The Port of Gulfport is the third busiest containerized port in the
Gulf of Mexico and the 17th busiest nationally. The storm’s catastrophic damage affected those
companies like Dole, Chiquita, and Crowley that use the port on a contractual basis. The
companies were forced to reroute shipments to Port Everglades, Florida or Freeport, Texas at
extra expense. The need to reroute shipments to Texas and Florida led to some low inventories of
these fruits in southeastern states. Grain shipments at major Mississippi ports saw only a
moderate decrease in traffic compared to previous years. At the Port of South Louisiana,
shipments of soybeans and maize (the port’s two largest bulk edible commodities in 2005), were
16 | P a g e
estimated costs due to these hurricanes do not account for unreported emergency operations
expenditures, the short-term opportunity costs of lost or rerouted shipments, and the long-term
economic cost of displaced business and trade (Grenzeback and Lukmann, 2006).
The Association of American Railroads reported in September of 2008 that freight traffic on U.S.
railroads was off sharply during the week of September 20 in comparison with the same week in
2007, with much of the decline being attributed to disruptions caused by Hurricane Ike which
struck the Gulf Coast on September 13. Total volume was estimated at 32.8 billion ton-miles,
down 6.8 percent from the comparable week in 2007. Railroads provide more than 40 percent of
U.S. intercity freight transportation, more than any other mode, and rail traffic figures are
regarded as an important economic indicator (AAR, 2008). After Hurricane Wilma in 2005, the
Florida East Coast Railway’s fourth quarter revenues were reduced by approximately $1.5 to
$2.5 million. The Railway also incurred approximately $2.5 to $3.0 million of incremental
expenses related to clean-up costs, property damage, grade crossing operations and support and
additional train crew costs as a result of trains operating at reduced speeds (PR Newswire, 2005).
One other study on the aftermath of the Northridge earthquake of 1994 showed the financial
impacts felt by the trucking firms. The revenue and cost impacts of the earthquake reflected
effects that are quite complex. Increased costs, such as wages or fuel, were expected, but firms
also incurred increases or decreases in revenues, depending on their circumstances. The results
showed a modest overall impact on trucking operations in Los Angeles County. The only change
larger than 1%, either positive or negative, was a mean cost increase of 3.5% in the first quarter.
17 | P a g e
earthquake response plan in effect prior to the earthquake, nor did it stimulate them to prepare
one. The dominant form of plan (if there was one) was an emergency preparedness plan for
employees, not an operational plan. Only a handful of trucking firms had a rerouting plan, a
communications plan, an operations management plan, or arrangements with customers
(Willson, 1998). There is a lack of preparation on both the public and private side of
transportation networks.
2.3 Freight Transportation Planning
A paper on the possibility of building a framework for freight transportation planning following
a natural disaster developed an eight step process to develop state-wide Freight System
Resiliency Plans (Caplice, et al., 2007). The eight steps are:
• Step 1. Identify and segment customers of the transportation system
• Step 2. Identify and quantify the objective of a Freight System Resilience Plan for this
region
• Step 3. Conduct a vulnerability assessment of the region’s transportation network
• Step 4. Create public/private collaboration mechanisms
• Step 5. Determine what regulatory and policy procedures need to be put into place
• Step 6. Agree on priority and trigger setting processes
• Step 7. Conduct a failure mode analysis
• Step 8. Test the plan with a large scale simulation
Caplice, et.al. (2007) meant to expand on the little work that had been conducted on how to
18 | P a g e
the public sector infrastructure and the private sector business community, evident in the general
lack of defined plans and priorities for allocation and use of limited public sector transportation
resources post-incident by private sector entities (specifically the lack of planning for freight
system (rather than freight system) resumption). Caplice, et.al. (2007) felt this lack will hamper
state and regional economic recovery, and this could otherwise be mitigated or possibly avoided
with prior planning and public-private sector coordination. The culmination was a research
project conducted with the Washington State Department of Transportation on the development
of a state-wide Freight System Resiliency (FSR) Plan.
Based upon all these studies, a complete emergency plan should include certain elements for
freight transportation planning. One element is a developed methodology to identify, prioritize,
and minimize the negative effect of schedule dependencies within and among agencies in
recovery from a region wide disaster. Another critical element is an enhanced look at
redundancies in the transportation system at an interregional level. Most studies indicated that a
more automated system for rerouting freight and transportation following a natural disaster is
necessary. Specifically, Caplice’s study synthesized all of these elements into eight steps to
create a complete emergency operations plan with respect to freight transportation. There is a
lack of preparation on both the public and private side of transportation networks. The impetus
to provide freight transportation planning following natural disasters exists, but is this specific
type of planning evident in the current emergency operations plans?
19 | P a g e
FEMA designates State Emergency Operations Plans (EOP) as a document meant to address
several operational response functions. These functions focus on the direction and control,
warning, emergency public information, and evacuation actions that must be dealt with during
the initial phase of response operations, fall outside of the Federal response mission, and are not
appropriate for inclusion in Federal response plans. One major element of most EOPs is that the
state is meant to assess the damage done to transportation networks such as airports, major roads
and bridges, rail lines, ports, etc., which is directly related to freight transportation (FEMA,
1996). While EOPs are not meant to completely cover all recovery efforts in the long term,
FEMA does suggest that state EOPs include restoration of infrastructure "lifelines," and debris
removal to facilitate response. Recovery is termed by FEMA as the effort to restore
infrastructure and the social and economic life of a community to normal. For the short term,
recovery means bringing necessary lifeline systems (e.g., power, communication, water and
sewage, and transportation) up to an acceptable standard (FEMA, 1996). It can be argued that
restoring freight transportation routes is necessary for an acceptable standard of living by both
citizens in the area affected by the disaster, as well as those in the region. Without freight
transportation of goods through an area, the disruption can lead to vital materials being kept from
different regions all across the United States. However, as will be seen, most state EOPs do not
cover freight transportation in their priorities following a natural disaster, instead focusing
primarily on evacuation efforts.
2.4.1 Current Emergency Operations Plan in Florida
The Comprehensive Emergency Management Plan of 2004 (CEMP) for the state of Florida
20 | P a g e
mitigates the impacts of a wide variety of disasters that could adversely affect the health, safety
and/or general welfare of the residents of the State. The Plan provides guidance to State and local
officials on procedures, organization, and responsibilities, as well as provides for an integrated
and coordinated local, state, and federal response (CEMP, 2004).
Based upon a Hazard Risk Assessment done in 2003, Florida established that the greatest threat
comes from tropical cyclones. According to the National Hurricane Center, forty percent of all
U.S. hurricanes and major hurricanes hit Florida and eighty-three percent of category 4 or higher
hurricane strikes have hit either Florida or Texas (Blake and Rappaport, 2007). At least sixteen
of the thirty costliest hurricanes on record from 1900-2000 in the U.S. have occurred in Florida.
More importantly the Comprehensive Emergency Management Plan of 2004 for Florida appears
to give responsibility for transportation networks mainly to state governments with this
statement: “Identifying critical industry and infrastructures that may be impacted by disaster or
are required for emergency response efforts.” The issue of transportation following a natural
disaster is under the jurisdiction of the infrastructure support branch in the operations section
under the State Emergency Response Team. The function of transportation recovery is overseen
by the Department of Transportation in the case of a disaster in Florida. The main component of
transportation before a disaster covered by the Comprehensive Emergency Management Plan of
2004 is the possibility of reverse-lane routes. Reverse-lane routes affect major highways such as
21 | P a g e
These are the main elements concerned with transportation that are located in Florida’s
Comprehensive Emergency Management Plan of 2004. No mentions of freight transportation
are made nor are there any provisions outlined as to what should be done regarding major freight
transportation routes following a hurricane or any other natural disaster.
2.4.2 Current Emergency Operations Plan in Georgia
The main document which covers the subject of emergency operations for the state of Georgia is
the Georgia Emergency Operations Plan of 2008 (GEOP). This comprehensive state emergency
operations plan is developed to ensure mitigation and preparedness, appropriate response and
timely recovery from natural and manmade hazards which may affect residents of Georgia. All
actions undertaken by emergency management focus on the protection of lives and property,
with special sensitivity toward victims and their families (GEOP, 2008).
Based upon the Georgia Risk and Hazard Assessment, hurricanes and tropical storms are the
natural disasters that put the state of Georgia at the highest risk. Tropical systems can impact the
entire state of Georgia depending on a storm’s track and its forward motion. Even the weakest of
systems can produce tornadoes and major flooding. Georgia is vulnerable to tropical systems
coming from both the Gulf of Mexico and the Atlantic coast. Hurricanes bring the greatest
threats to Georgia’s six coastal counties and immediate adjacent seven inland risk counties
22 | P a g e
The Department of Transportation (DOT) in Georgia is responsible for coordination of state
transportation resources, assisting with evacuation and mobilizing transport of supplies and
equipment in the case of a natural disaster. Actions taken by the Georgia DOT can include the
identification of available transportation resources; implementing a coordinated approach among
and between designated state agencies and organizations; assisting local governments in
determining the most viable available transportation networks to, from and within the emergency
or disaster area; coordinating the movement and flow of land, air and marine traffic in and to the
disaster area for effective transport of relief supplies, personnel and equipment; and continuing to
render transportation support as long as the situation exists (GEOP, 2008). The overall goal for
transportation in Georgia following a natural disaster is to resume day-to-day operations as soon
as possible.
These are the main elements concerned with transportation that are located in the Georgia
Emergency Operations Plan of 2008. As seen in Florida’s plan there is no mention of freight
transportation or any transportation planning following a natural disaster.
2.4.3 Current Emergency Operations Plan in South Carolina
The main document which covers the subject of emergency operations in South Carolina is the
South Carolina Emergency Operations Plan of 2008 (SCEOP). The purpose of the SCEOP is it
establishes the policies and procedures by which the State will coordinate state and federal
response to disasters impacting South Carolina and its citizens. The plan also describes how the
23 | P a g e
management efforts through preparedness, response, recovery, and mitigation planning (SCEOP,
2008).
Based on a hazard analysis conducted by South Carolina, hurricanes were identified as a
statewide threat. The risks of many hazards were researched and reviewed against the potential
impact that they may have upon South Carolina, counties, and supporting critical infrastructure.
Hazards were identified as having both immediate and long-term impacts, with the potential to
disrupt day-to-day activities, cause extensive property damage, and create mass casualties. Since
1851, South Carolina has experienced thirty hurricane strikes (Blake and Rappaport, 2007). Of
the state's forty-six counties, six have coastlines, which border the Atlantic Ocean. These
counties have over 200 miles of general coastline and all inland counties may be directly affected
by these storms.
More specifically looking at the transportation recovery and response in South Carolina, the plan
states that a disaster or any emergency may severely damage state and local civil transportation
infrastructure. Most state/local transportation activities will be hampered by damaged roads,
bridges, and disrupted communications. The state's emergency responsibility will primarily
include route assessment and the allocation and prioritization of state transportation assets to
include processing all transportation requests from state agencies and local governments.
Further, the state must acquire and coordinate use of air, rail, and water transportation assets and
provide transportation damage assessment information (SCEOP, 2008). The process of
furnishing transportation services in South Carolina during a disaster situation involves two
24 | P a g e
1) Essential immediate transportation needs are identified and actions are taken to provide
for these needs.
2) As soon as possible, future continuing needs for transportation service and expected
future transportation capabilities are estimated.
Decisions are then made and actions taken to direct these expected future capabilities to meet the
needs considered most essential. Priority will be given to restoring transportation infrastructure
(roads, routes, rail, and channels) supporting mobilization sites, distribution points, staging areas,
post-impact evacuations, and medical facilities (SCEOP, 2008).
This brief overview covers the main elements of transportation that are covered in the plan.
While the South Carolina Emergency Operations Plan does go more into detail regarding
transportation following natural disasters than other states, there still is no mention of freight
transportation.
2.4.4 Current Emergency Operations Plan in North Carolina
The primary document which covers the subject of emergency operations in North Carolina is
the North Carolina Emergency Operations Plan of 2008 (NCEOP). The purpose of the NCEOP
is to establish a plan for a systematic, coordinated, and effective response to and recovery from
emergencies or disasters occurring in the State. The plan describes a system for effective use of
federal, state, and local government resources as well as private sector resources necessary to
preserve the health, safety and welfare of those persons affected during various emergencies
25 | P a g e
During each hurricane season (June – November), the North Carolina coast likely will be
threatened, if not struck, by at least one tropical storm. Since 1851, North Carolina has
experienced fifty hurricane strikes (Blake and Rappaport, 2007). These observations establish
that hurricanes are a definite threat to the operations of North Carolina and the NCEOP contains
a special annex pertaining specifically to operations plan following a hurricane.
The Infrastructure Branch plans, coordinates and arranges for infrastructure recovery after a
disaster. Such activities include, but are not limited to debris removal, repair of highways and
bridges, restoration of sewer and water systems, building inspection, and reconstitution of
electrical and telephone service. Three tasks of the Public Work and Engineering Group are
1) Emergency clearance of debris for access to the damaged areas by emergency personnel
and equipment for lifesaving, life protecting, health and safety purposes.
2) Temporary construction of emergency access routes that include damaged streets, roads,
bridges, ports, waterways, airfields, and any other facilities necessary for passage of
emergency service personnel.
3) Access to the disaster areas will be dependent upon the re-establishment of emergency
routes. Debris clearance and emergency road repairs will be given top priority to support
immediate lifesaving emergency response activities (NCEOP, 2008).
When looking at just the transportation elements of the NCEOP, the North Carolina Department
of Transportation is meant to provide for movement of resources in support of local
26 | P a g e
requiring transportation capacity to perform emergency assistance missions. Specific duties for
the Department of Transportation can include providing resources as required; erecting and
maintaining signs, lights, barricades or other control devices as needed to maintain or control
traffic along the emergency routes or required detour routes; monitoring and reporting road
conditions; and marking and maintaining required evacuation routes (NCEOP, 2008).
Despite the Plan’s hefty length of over five hundred pages, the North Carolina Emergency
Operations Plan does not mention freight transportation during or after a natural disaster. Other
elements of transportation are included, as well as mention of regional agreements with the state
of South Carolina, but an obvious absence of the routing of freight transportation.
2.4.5 Current Emergency Operations Plan in Virginia
The next state along the East Coast is Virginia and the main document which covers the subject
of emergency management is the Commonwealth of Virginia Emergency Operations Plan of
2004 (COVEOP). The purpose of the COVEOP is an all-discipline, all-hazards plan that
establishes a single, comprehensive framework for the management of statewide incidents
(COVEOP, 2004). The plan provides the structure and mechanisms for the coordination of state
support to impacted local governments and affected individuals and businesses. It assigns duties
and responsibilities to departments, agencies, and organizations for disaster mitigation,
preparedness, response, recovery, and prevention. It also provides the framework within which
more detailed emergency plans and procedures can be developed and maintained by both state
27 | P a g e
A hazard risk analysis study done by Virginia shows that the risk for hurricanes in the state is a
medium to high threat. An average of about two hurricanes each year comes close enough to
affect Virginia. The three most destructive hurricanes affecting Virginia in modern times were
the August (22-23) 1933 hurricane, Hazel in October 1954, and Camille in August 1969. The
August 1933 hurricane moved from the southeast and made landfall south of Norfolk and
Virginia Beach. Tides in Norfolk were reported to be 9.7 feet above mean low water. There were
18 fatalities and damages of $79 million (1969 dollars) were reported. The map below shows the
28 | P a g e
Figure 1. Map of Hurricane Risk Area for Virginia (COVEOP, 2006)
When looking at the transportation responsibilities following a natural disaster within the state,
there are specific duties listed within a separate annex of the COVEOP directed only at the issue
of transportation. The state is designed to provide transportation support to assist in incident
management. Activities include: processing and coordinating requests for transportation support
29 | P a g e
reporting damage to transportation infrastructure as a result of the incident; coordinating
alternate transportation services; coordinating the restoration and recovery of the transportation
infrastructure; performing activities conducted under the direct authority of state agencies; and
coordinating and supporting prevention, preparedness, response, recovery, and mitigation among
transportation infrastructure stakeholders at the local level. The Secretary of Transportation has
specific duties and will monitor and coordinate with respect to these needs:
1) Maintain the state highway system, to include debris clearance and restoration, following
an emergency or disaster.
2) Facilitate, in coordination with the State Police and affected local governments, traffic
movement during a large-scale evacuation and re-entry.
3) Provide an Initial Damage Assessment report within 72 hours of damages, to state
highways, roads, and bridges (COVEOP, 2004).
A brief mention of commercial traffic is made in the COVEOP:
“Carriers and shippers will conduct business as usual whenever possible. If exemptions to state rules and regulations are needed to expedite delivery of essential resources to disaster areas, VDOT will coordinate with the Governor to consider and/or implement accommodations. Payments for transportation services will be made in the normal manner except when the consignor or consignee is an emergency management state or federal agency. The unit or agency involved will be billed for services. The principal change from accustomed business conditions will be controls, which may be placed upon the use of transportation to assure that service is being utilized for essential survival activities in support of disaster areas on a priority basis, and for the other areas of the state as available and required (COVEOP, 2004).”
Another annex of the COVEOP is focused on the state response following a hurricane making
30 | P a g e
maintain a sub plan for hurricane evacuation traffic control. The VDOT will also coordinate the
closure of high-risk roadways such as bridges, tunnels, or flood prone sections of roadway as
indicated in the Transportation Emergency Operations Plan, the Chesapeake Bay Bridge-Tunnel
Closure Plan although not designated as an evacuation route, and other protocols for adjusting
transportation resources to meet impending emergencies (COVEOP, 2004).
The Commonwealth of Virginia Emergency Operations Plan of 2004 is the first state emergency
operations plan to even acknowledge the issue of freight and commercial transportation. Yet, the
issue of freight transportation is only mentioned with respect as to how supplies will be brought
into the affected areas. As seen with the other state plans, there is no planning being done
regarding the rerouting of freight transportation to ensure continued delivery across a region and
the nation.
2.4.6 Current Emergency Operations Plan in Maryland
The last state in this examination of existing plans for emergency management is Maryland. The
primary document covering the subject is the Maryland Emergency Operations Plan of 2007.
This state plan outlines an approach and designates responsibilities intended to minimize the
consequences of any disaster or emergency situation in which there is a need for state assistance
(MEOP, 2007). The plan also indicates that Maryland must also be prepared for events that can
impact citizens on a regional basis, including regions outside of Maryland (Mid Atlantic, Capital
31 | P a g e
Based upon the Maryland Hazard Analysis conducted in 2000, hurricanes are a major threat to
Maryland. Along with that, a Category 3 hurricane is listed as one of the more catastrophic
events that could affect the state of Maryland. Maryland has only experienced two hurricane
strikes since 1851, but tropical storms are still considered one of the top threats to disrupting
services in the state.
Maryland supports a transportation infrastructure that sustains significant air, road, rail, and
water traffic which is vulnerable to disastrous events. The purpose of the Emergency Service
Function of Transportation is to coordinate the use of transportation resources and services
necessary to support emergency response or recovery operations or other disaster assistance
initiatives. The scope of the Maryland transportation support includes providing or utilizing
land, air, rail, or watercraft for emergency response or assistance operations, as well as
coordinating the use of resources to facilitate an effective, efficient, and appropriate result. The
transportation element will also include providing resources or personnel that aid traffic control,
relocation, and evacuation efforts. When requested, state law enforcement personnel will work
with the incident commander to maintain traffic flow patterns and traffic around incident site.
Restoring state roads, bridges, or transit systems, or establishing similar temporary structures is a
priority. In Maryland if a disaster were to occur, the first step for transportation officials would
be to take assessment of the regional transportation network to determine feasibility of different
modes of travel. From there, that information would be shared with the appropriate
transportation agencies and organizations to assess the use of transportation infrastructure in the
32 | P a g e
The state of Maryland‘s Emergency Operations Plan of 2007 further shows that freight
transportation is not a priority following a natural disaster. Yet with connections to the welfare
of the entire nation as well as the affected area, freight transportation plans should be included in
emergency management in states along the East Coast. This section of the literature review
shows that there is no freight transportation planning at the state level.
2.5 Research Questions
Out of this review of literature two research questions have emerged for this thesis to address:
1) Do local emergency operations plans include more freight transportation planning than
state emergency operations plans?
2) How complete is freight transportation planning at the local level?
It is the duty of the government to protect the American public as best as possible from natural
disasters. One step in the process of protection is ensuring continued transportation of goods and
efficient delivery of recovery supplies to areas affect by natural disasters, as well as the rest of
the country. In the Secretary-General's Message for October 12, 2005, Koffi Anan wrote, "We
cannot stop natural calamities, but we can and must better equip individuals and communities to
33 | P a g e
3. Methodology
The methodological approach used in this thesis will be to examine the prevalence of freight
transportation planning following a natural disaster indicated at the local level. In order to
address the research questions this thesis will examine county level and city level emergency
operations plans (where available) to determine the priority of freight transportation planning, as
well as contact being made with the emergency managers overseeing those locations. Based
upon Caplice, et. al. (2007), the criteria for adequate planning for freight transportation in
emergency operations plans includes four key elements. These four elements are
1) A vulnerability assessment of the region’s transportation network – to help determine
the current state of the network
2) Public/private collaboration mechanisms – for communications purposes as well as to
have each sector learn from the other
3) Regulatory and policy procedures – determine priority for different authorities involved
in locality with respect to transportation, so that following an emergency, operations can
run smoothly
4) A freight transportation plan – an actual plan that has been tested through a table top
exercise or similar simulation
The locations were selected along the East Coast to provide a different perspective from studies
that have looked at the Gulf Coast region following Hurricane Katrina. The cities were chosen
based upon their location along a major freight route, their location along the East Coast, and as
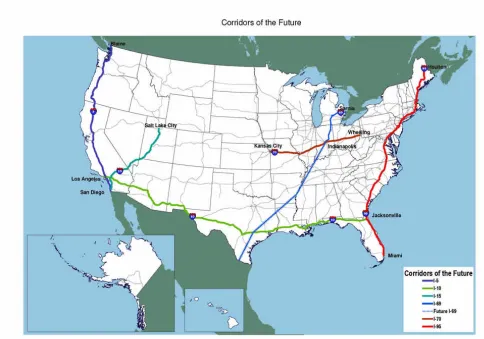
being a metropolitan area that would need transportation planning in the wake of a hurricane.
34 | P a g e
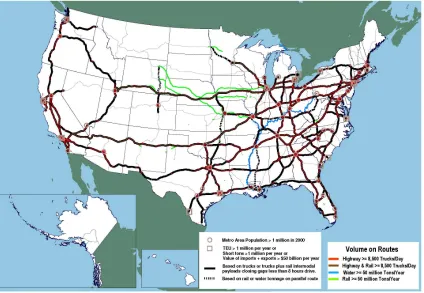
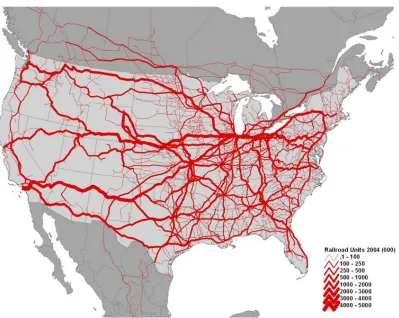
state within their emergency operations plans. The East Coast is vital to the freight industry and
[image:35.612.125.549.170.463.2]connects most of the nation with the world due to its’ many port locations.
35 | P a g e
Figure 3. Freight truck volumes, 2004 (Grenzeback and Lukmann, 2006).
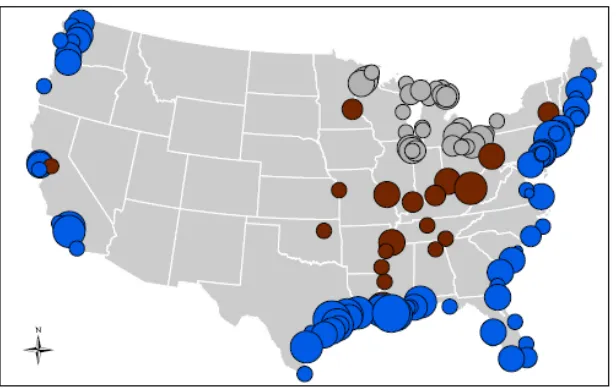
[image:36.612.73.472.370.688.2]36 | P a g e
Figure 5. Relative total tonnage handled at coastal, Great Lakes, and inland waterway ports, 2004. (Grenzeback and Lukmann, 2006)
The cities selected based upon these considerations are Miami, FL; Jacksonville, FL; Savannah,
GA; Charleston, SC; Wilmington, NC; Norfolk, VA; and Baltimore, MD. The state emergency
operations plans for each state were included in the review. Each city and county level
emergency management department was contacted in order to ensure that the plans being
reviewed were similar to those used in real time post disaster planning.
3.1 Data Collection
The data used will be city and county emergency operations plans, along with the GIFT model
transportation network information. First this thesis will thoroughly examine the county and city
plans for the areas of Jacksonville, FL; Miami, FL; Savannah, GA; Charleston, SC; Wilmington,
NC; Norfolk, VA; and Baltimore, MD. Each plan will be examined to see what mention of
[image:37.612.76.384.86.281.2]37 | P a g e
for freight transportation planning. Specific guidelines for reviewing the four elements are seen
in the table below and were developed based upon previous transportation studies.
Key Element Expected Wording or Evidence of Element in Local
Level Emergency Operations Plan
1) A vulnerability assessment of
the region’s transportation
network
• A designated vulnerability assessment of
transportation infrastructure in area
• Multiple hazards analysis for the locality with
respect to transportation
2) Public/private collaboration
mechanisms
• Identification of private sector stakeholders
within the community pertaining to freight
transportation
• Communication measures set up between
public and private sector
• These elements can be considered inclusive if
they are part of the document (even if with
respect to just transportation)
3) Regulatory and policy
procedures
• Specific procedures indicated with respect to
regulations or policy in emergency operations
for the transportation infrastructure
• Authority hierarchy detailed within
transportation infrastructure for clear chain of
command
• These elements can be considered inclusive if
they are part of the document (even if with
respect to just transportation)
4) A freight transportation plan • Actual section of emergency operations plan
dedicated entirely to freight transportation
38 | P a g e
From these observations and examinations, policy recommendations will be made regarding the
inclusion of freight transportation planning at the local level. As it has already been shown, there
is little to no evidence of freight transportation planning in these East Coast states at the state
level.
Potential problems do exist with this methodology. There is one main difficulty in evaluating
emergency operations plans at the local level. It is a subjective process and therefore open to
many different interpretations. By selecting a framework to follow while examining the
emergency operations plans for specific terminology, the majority of bias should be removed.
As well as this consideration, while plans may exist for emergency management, it is not always
the scenario seen in real time. Another difficulty is generalizing the results, because what could
work for one state or locality, may not work across a region. The criteria this thesis selects to
determine the choice may be different from the choices selected by a different approach.
Therefore, results should also be evaluated from more than one selection of criteria. These
problems present some difficulty with completing the research; however, the value of the
research outweighs what it may take to resolve any problems.
The specific steps for the methodology are as follows:
1) Select seven separate coastal areas and collect emergency operations plans for the
localities. The data obtained will be used to examine prevalence of freight transportation
39 | P a g e
2) Examine the documents and information provided by emergency managers for
prevalence of freight transportation and the four elements selected based on previous
research.
3) Develop broad policy recommendations for localities along the East Coast for inclusion
of freight transportation planning following natural disasters.
The examination of the emergency operations plans at the local level should lead to
recommendations for the transportation sector which will prove helpful to both freight delivery
40 | P a g e
4. Results and Discussion
4.1 Current County and Local Level Emergency Operations Plans
4.1.1 Current Emergency Operations Plan in Miami, Florida
The Comprehensive Emergency Management Plan1 (CEMP) establishes the framework to
ensure that Miami-Dade County and its municipalities are prepared to deal with these hazards,
and is the equivalent of an emergency operations plan. The CEMP outlines the basic strategies,
assumptions, operational goals and objectives, and mechanisms through which Miami-Dade
County mobilizes resources and conducts activities to guide and support emergency management
efforts through preparedness, response, recovery and mitigation. The plan is an operations-based
plan that addresses evacuation; sheltering, post disaster response and recovery; deployment of
resources; communications and warning systems (CEMP, 2008). The Comprehensive
Emergency Management Plan1 is the plan this thesis will use to determine how well it includes
the four key elements.
Freight transportation is mentioned in the plan, but a specific emergency operations plan for
freight transportation plan is not outlined. One of the main purposes of the CEMP is to
coordinate the return of essential services to a normal state as quickly and effectively as possible
after a disaster. Transportation and freight transportation can be considered essential services not
only for the Miami-Dade area but also the surrounding region.
The critical transportation infrastructure of Miami-Dade County includes airports, major
41 | P a g e
(MIA) is one of the largest and most active airports in the southeast. International freight is
growing at a rate of 10.8% and now exceeds 140,000 tons per month. The major roadways
serving Miami-Dade County are A1A, U.S. 1, U.S. 441, I-95, Florida Turnpike, S.R. 286, U.S.
41, S.R. 997, and S.R. 836 (CEMP, 2008). The primary seaport for the County is the Dante B.
Fascell Port of Miami-Dade. The Port hosts the largest passenger ship traffic in the southeast as
well as one of the eastern seaboard’s largest containerized cargo operations. The Port serves as a
significant point of entry for disaster relief resources and supplies. The Miami River provides an
important ancillary seaport for cargo vessels under 200 feet length overall (LOA). The river is
heavily utilized by ships from the Caribbean Basin. Miami-Dade County is served by four
railroad systems: Florida East Coast Railroad (freight); CSX (freight); Amtrak (passenger); and
Tri-Rail (passenger). The two primary railroad lines used by these companies run the length of
the County parallel to each other, approximately two miles apart and in a north/south direction.
These systems and their railway yards are of prime importance for the movement and
transportation of relief supplies into the County during a disaster (CEMP, 2008). While the
CEMP does not include a vulnerability assessment of its transportation infrastructure, past
experience with disasters may have helped show where vulnerabilities are in Miami’s
transportation network.
Miami-Dade County has had experience with disasters before and knows the economic toll that
natural disasters can have on the economy of a region. Hurricane Andrew, a small, fast moving
category 5 storm struck the sparsely populated agricultural area of southern Miami-Dade County,
where only 300,000 of the County’s residents lived. The resulting damage from this storm
42 | P a g e
municipalities, the County, and the insurance industry at large. A category 5 hurricane striking in
the more populated regions of the County could put over 2.4 million residents at risk and could
easily result in losses of such proportions that the financial health of the county, its
municipalities and many businesses in the private sector would be placed in jeopardy. A disaster
of this magnitude would also pose a serious threat, on a national level, to the banking and
insurance industries as well as the general economy of the country. This risk analysis specific to
hurricanes is not a vulnerability assessment for freight transportation but it is a good basis for
where to examine the transportation network for vulnerabilities in the future.
The Infrastructure Branch, outlined in the CEMP, is responsible for monitoring and coordinating
communications, response and recovery actions relative to flooding, drainage matters, debris
clearance, damage assessment, critical facilities, utilities, transportation, and engineering.
Therefore the responsibility of planning for freight transportation following a natural disaster
would fall to them. The County’s infrastructure includes roads, traffic controls, water and sewer
systems, storm drains, streetlights, medical services, electrical and telephone services, food
supplies, garbage and debris pick up and disposal. The CEMP states that:
“The short-term recovery phase begins with the restoration of these services. Full documentation of recovery efforts must be maintained especially in the event of an emergency or disaster declaration when FEMA will require such documentation to be attached to the Project Worksheets.” (CEMP, 2008)
The Infrastructure Branch must follow specified procedures and guidelines following a natural
disaster. While there is flexibility with such restrictions, the element of regulatory and policy
procedures regarding transportation is covered by the CEMP in respect to recovery actions.
43 | P a g e
could easily be applied and adapted in an annex of the emergency operations plan pertaining to
freight transportation.
The needs of the freight transportation industry may not be addressed during the response phase
following a natural disaster, but most certainly would need to be covered in the recovery phase
of any emergency operations plan. The recovery phase of an emergency or disaster deals with
the functional restoration of a community to the conditions prior to the disaster event. The
recovery phase will include the restoration of infrastructure including roads, traffic controls,
signs, canals, railroads, airports, shipping facilities, fuel supplies, potable water supplies,
electricity, sewage disposal, storm drains, and flood control facilities.
The element of public and private collaboration mechanisms is covered in the CEMP in the
section concerning debris removal. The process of debris removal and clearance of critical
transportation infrastructure is a cooperative effort between Miami-Dade Solid Waste
Management, Miami-Dade Parks & Recreation Department, Miami-Dade Public Works
Department and the Florida Department of Transportation. Therefore a freight transportation
planning element would need to incorporate these different agencies. The available and
obtainable resources of the transportation network in Miami-Dade County will be employed, in
the event of an incident or disaster to accomplish the following:
• Coordinate transportation resources for evacuations as a result of immanent threat of an
incident or disaster
• Coordinate drawbridge lockdown and reopening schedules between USCG, marine
44 | P a g e
• Develop situation reports and action plans for all available modes of transportation and
submit to the Operations Section Chief.
• Coordinate with ESF-3 (Public Works & Engineering) and Debris Removal in facilitating
the removal of obstructions from and the temporary repair of the transportation
infrastructure.
• Coordinate the production and distribution of transportation maps (CEMP, 2008).
All of these objectives would affect freight transportation, and one would hope that the local
government would consult with both the companies involved with railways and highways to
ensure the best continuation of vital needs. These issues concern not only the locality, but also
the region and the nation due to the movement of freight.
In summary, Miami-Dade County does not have an official vulnerability assessment for its
freight transportation network or a specific freight transportation emergency operations plan.
The county does however, have public and private collaboration mechanisms in place, along
with regulatory and policy procedures to be put into place following a natural disaster. These
elements currently pertain to transportation in general; however the framework could be
expanded to cover freight transportation as well. Therefore on the local level, Miami meets two
out of the four elements needed for a complete freight transportation emergency operations plan.
While there is no specific mention of freight transportation or planning for its resumption
following a natural disaster, it must be noted that Miami-Dade County has the foresight to see
they may need to plan for such an event. Recognizing the threat to local economies, the Federal
45 | P a g e
Industry, to its response and recovery tasks to address the recovery needs of the business
community. The State of Florida and Miami-Dade County subsequently adopted and named ESF
– 18 Business & Industry. ESF -18 is under development (CEMP, 2008). Therefore, while the
current CEMP does not address the issue of freight transportation following a natural disaster