Analysis of Wide-Area Availability of Wind
Generators During Storm Events
Hamish Macdonald
∗, Graeme Hawker
†and Keith Bell
†∗
Wind Energy Systems Centre for Doctoral Training, University of Strathclyde, Glasgow
†
Department of Electronic and Electrical Engineering, University of Strathclyde, Glasgow
{
hamish.m.macdonald, graeme.hawker, keith.bell
}
@strath.ac.uk
Abstract—During high wind speed shutdown (HWSS) events,
the power outputs of wind power plants may be subject to high ramp rates, causing issues for the System Operator (SO) in predicting total wind output, allocating adequate reserve levels and minimising balancing costs. As the timing of these events is difficult to predict, it is proposed that individual turbines may be used as probabilistic early warning indicators of HWSS events across sites, and by extension to a wide geographical area. The shut-down history of two separate wind farms across Scotland is analysed to determine the likelihood and impact of such events. It is shown that in most cases, HWSS doesn’t result in the full loss of availability. Factors such as turbine elevation and mean wind exposure are key indicators of the order of shut-down across a site. The relationship between the sites is more difficult to characterise, but there is evidence to suggest that some sites could be used as early warning indicators for the pattern of HWSS across a transmission zone.
Index Terms—Wind Turbines, Forecasting, High Wind Speed
Shutdown
I. INTRODUCTION
W
IND turbines are designed to operate within a partic-ular range of wind speeds. The majority of modern onshore horizontal axis models will start to generate power at a cut-in wind speed of 3 to 4 m/s and reach rated power at wind speeds of between 11 to 15 m/s. In order to protect the turbine from excessive mechanical loading, a shut-down procedure is typically initiated when wind speeds average over 25m/s for a preset period or for a gust around 30-35 m/s [1]. The precise wind speed constraints and control procedure will vary between different manufacturers and models of wind turbines. The increasing penetration of wind energy in Great Britain has been become of greater concern to the System Operator (SO) of the transmission network, National Grid, which is responsible for the real-time balancing of electricity supply and demand. Due to the inherent variability of wind power, the SO must procure additional reserve from other generators in order to compensate for short-term changes in output. The level of reserve required is typically dependent on the total wind power level across the system and the forecast accuracy [3]. [image:1.612.312.565.212.381.2]Incidents of High Wind Speed Shutdown (HWSS) add significant challenges to this balancing task as the power production from a wind farm may decrease from maximum to zero in a matter of minutes as the wind speed increases above a critical value. The site may increase output at a similar rate as the wind speed again reduces [4]. These rapidly changing
Fig. 1. High Wind Strategy for a Typical Wind Turbine [2]
events may not just impact the network in local regions, but in cases where a high wind pattern or storm front moves across the UK, could affect several wind farms at different locations. Significant growth in wind generation, especially offshore (where the average wind speeds can be higher), could cause HWSS events to be more frequent. The displacement of traditional synchronous generation with renewable sources could also increase the severity of such incidents, due to lower system inertia [5].
As part of a demonstration project for the Twenties re-port [6], a new High Wind Ride ThroughTM controller devel-oped by Siemens, which can lessen the gradients for reducing wind turbine power, was studied at the Horns Rev 2 wind farm in Denmark. However this is only installed at a selected number of sites and is not included in the analysis of this paper.
A recent HWSS workgroup established by the Grid Code Review Panel [7] found that the infrequent and insufficient consequences of HWSS events merited no changes to the Grid Code at present. However, it recognised that further refinement in the modelling and prediction of HWSS events is necessary given the current levels of uncertainty.
this report will asses the impact of other environmental factors relating to each turbine, such as elevation from mean sea level, to see if they enhance the likelihood of HWSS. The occurrence of multiple wind farm shut-downs will also be addressed to see if any particular farms can serve as indicators for further shut-down across the transmission network.
II. WINDFARMDATA
The data used for analysis in this report is from two separate wind farm sites: Wind Farm A, Wind Farm B. Wind Farm A consists of 60 turbines and Wind Farm B, 28. For each wind farm, the data is composed of high-wind speed shut-down alarms and associated timestamps which have been binned to 1 minute intervals. The wind farm net power is also available at 10 minute samples. Wind speed and direction information is taken from masts at the sites, along with the annual mean wind speed at each turbine. Contour information obtained from site maps provides elevations of each turbine at base level. The data intervals for the alarms for Wind Farm A and Wind Farm B are respectively 12th January 2010 - 31st August 2013 and 1st January 2010 - 13th December 2011.
This report will utilise the Wind Farm A data for the majority of the individual wind turbine indication assessment, whereas both will be used to determine individual wind farm indicators for shut-down events across the network.
III. HIGHWINDSPEEDSHUTDOWNINCIDENTS
A HWSS incident is defined by Coughlan et al to be ”when the shut-down signal exceeds 5% of availability” [9], where the availability is the proportion of total plant power able to operate. Based on discussions from the National Grid workgroup, HWSS events are currently believed to develop over a timescale of hours rather than minutes and normally occur less than once a year, in accordance with a weather front moving across the site region, affecting those turbines which are at the most exposed locations [7]. The definition of a HWSS event has not been included in the workgroup report but is considered to be of a larger scale than that proposed by Coughlan et al. For the wind farm data available, this section of the report will attempt to provide further detail on the extent of HWSS events and the time-scales involved. All other sources of turbine shut-down are excluded and only shut-down due to HWSS is considered. If a particular wind turbine is not operational during a HWSS incident, the shut-down period is determined from the nearest neighbouring operational turbine.
A. Distribution of HWSS Incidents
A HWSS incident was determined to be when a wind farm experienced the loss of one or more turbines due to a HWSS alarm. At Wind Farm A, for the period 10th January 2010 - 12th August 2013, approximately 30.1% of these incidents involved the loss of less than 5% of turbine availability, 15.8% in the loss of at least 50% turbine availability and 6.7% in the complete loss of turbine availability and hence generation at the site.
Of the incidents that Wind Farm B encountered during the period 15th January 2010 - 13th December 2011, 81.3%
resulted in the loss of less than 5% turbine availability, 34.4% in the loss of at least 50% turbine availability and 9.38% in the complete loss of turbine availability at the site.
<95% <90% <80% <70% <60% <50% <40% <30% <20% <10% 0% 0%
5% 10% 15% 20% 25% 30% 35%
Wind Farm A (19-03-2010 to 12-08-2013)
Availability [%]
In
ci
d
en
ts
[%
]
<95% <90% <80% <70% <60% <50% <40% <30% <20% <10% 0% 0%
10% 20% 30% 40% 50% 60% 70% 80% 90%
Wind Farm B (15-01-2010 to 13-12-2011)
Availability [%]
In
ci
d
en
ts
[%
[image:2.612.317.555.107.259.2]]
Fig. 2. Percentage of separate HWSS alarm incidents (involving the loss of one or more turbines), resulting inxamount of wind farm availability.
It is clear from the results presented in Figure 2 that the majority of HWSS ”incidents” still leave operation at
>95% availability at Wind Farm A and >75% availability at Wind Farm B. The percentage of cases involving full loss of generation are of a diminished but not insignificant amount.
B. Ramp Rates
In this section, a ramp-down time period is defined from when the number of turbines shutdown exceeds 5% of avail-ability to when the wind farm net power reaches a minimum level over the course of the day of that incident. The ramp-up time period is defined from when this wind farm minimum power level is exceeded to when the proportion of operational plant is once again greater than 95%.
TABLE I
RAMP-DOWN/UPRATESWINDFARMA
Date Time Wind Farm Rated Power Change Ramp Rate
(mins) (%) (MW/min)
04-Feb-2013 10 -61.296 -8.4589
08-Dec-2011 20 -97.504 -6.7278
03-Jan-2012 30 -96.755 -4.4507
23-Dec-2012 30 -91.169 -4.1938
28-Dec-2012 40 -99.229 -3.4234
23-May-2011 20 71.928 4.963
04-Feb-2013 20 65.668 4.5311
23-Dec-2012 30 84.662 3.8945
24-Nov-2011 30 69.071 3.1773
21-Jan-2012 40 70.989 2.4491
[image:2.612.311.570.516.630.2]MW/min for ramp-down and 0.1629 MW/min for ramp-up, however there are instances of ramp rates comparable to those in Table I.
The presence of 23rd Dec 2012 and 4th Feb 2013 in the top 5 most significant entries for both ramp-up and ramp-down are of particular note. These incidents represent scenarios where the time period from loss and return of power occur within 70 and 30 minutes of each event respectively. Although these are isolated incidents, such scenarios may represent a particular challenge for the system operator in the procurement of balancing services, due to the requirement of immediate connection and disconnection of reserve.
05:20 05:30 05:40 05:50 06:00 06:10 06:20 1 2 3 4 5 6 7 8 9 10 11 12 13 14 15 16 17 18 19 20 21 22 23 24 25 26 27 28 29 30 31 32 33 34 35 36 37 38 39 40 41 42 43 44 45 46 47 48 49 50 51 52 53 54 55 56 57 58 59 60
Shutdown Alarm Lengths
23-Dec-2012 T u rb in e In d ex
05:20 05:30 05:40 05:50 06:00 06:10 06:20 0 25 50 75 100 125 23-Dec-2012 P ow er [M W ]
Loss of Generation due to HWSS
05:20 05:30 05:40 05:50 06:00 06:10 06:20 0 5 10 15 20 25 30 35 40 45 50 55 60 Nu m b er of O p er at ion al T u rb in es
Wind Farm Power Wind Farm Rated Power No. of Operational Turbines
00:20 00:30 00:40 00:50 01:00 01:10 01:20 01:30 1 2 3 4 5 6 7 8 9 10 11 12 13 14 15 16 17 18 19 20 21 22 23 24 25 26 27 28 29 30 31 32 33 34 35 36 37 38 39 40 41 42 43 44 45 46 47 48 49 50 51 52 53 54 55 56 57 58 59 60
Shutdown Alarm Lengths
04-Feb-2013 T u rb in e In d ex
00:20 00:30 00:40 00:50 01:00 01:10 01:20 01:30 0 25 50 75 100 125 04-Feb-2013 P ow er [M W ]
Loss of Generation due to HWSS
00:20 00:30 00:40 00:50 01:00 01:10 01:20 01:30 0 5 10 15 20 25 30 35 40 45 50 55 60 Nu m b er of O p er at ion al T u rb in es
[image:3.612.314.558.86.233.2]Wind Farm Power Wind Farm Rated Power No. of Operational Turbines
Fig. 3. HWSS Incidents, Wind Farm A - 23rd of December 2012 & 4th of February 2013
Figure 3 also shows that the ”number of operational tur-bines” curves are quite consistent with the ”wind farm power” curves. By investigating ramp-rates based on the number of operational turbines, a greater resolution of ramp-rate time periods is obtained. For HWSS incidents which involved the loss of all turbines, it took a significant additional period of time for the final turbine to shut-down. Hence for these particular incidents, to give a more realistic impression of the ramping of power, the ramp rate minimum was defined for when 59 of the 60 turbines had experienced HWSS. A Weibull distribution is developed for these ramp-down and ramp-up time periods in Figure 4. A ”goodness-of-fit” was carried out using Pearson’s chi-squared test.
The test gave χ2 = 33.0690 for ramp-down times and
χ2= 10.8992for ramp-up times. For each case, the degrees
of freedom were calculated as the difference in the number of non-empty bins (k)and the number of estimated parameters for the distribution (c = 3 for a 2-parameter Weibull distri-bution). For (k−c) degrees of freedom and a significance level of α= 0.05, the chi-squared critical values were found to beχ2
1−α,k−c = 12.59 for both cases, proving that only the
hypothesis for ramp-up times was not rejected.
It should be noted that for both cases the significant con-tribution to the overall χ2 value comes from their last bins, with values of 29.1698 for down and 8.6697 for ramp-up times. However, there is no justification in treating these final bins as outliers.
The difference in minimum, average and maximum ramp
times can also be seen in Table II.
50 100 150 200 250 300 350 400 450
0 5 10
Ramp-Down Time [min]
F re q u en cy
50 100 150 200 250 300 350 400 450
0 5 10
Ramp-Up Time [min]
F re q u en cy
Fig. 4. Weibull Distribution of Ramp Times for No. of Turbines
TABLE II
RAMP-DOWN/UPTIMEPERIODS- WINDFARMA Data
10 minute 1 minute
Wind Farm Power No. of Operational Turbines
Ramp-Down Ramp-Up Ramp-Down Ramp-Up
Minimum 10 mins 20 mins 6 mins 13 mins
Mean 1.5 hrs 1.67 hrs 1.84 hrs 1.78 hrs
Maximum 7.17 hrs 4.33 hrs 7.23 hrs 4.45 hrs
While there are several cases where the loss or gain in power took place over a period of minutes, generally, high wind speed related ramp-down and subsequent ramp-up rates take place over a period greater than 1 hour, This reiterates the statement by National Grid [7] that power loss due to HWSS will be gradual, as weather fronts move over wind farms, causing a few high speed alarms at a time, over a period of minutes or hours rather than seconds.
IV. CASESTUDY- HURRICANEFRIEDHELM
On the 8th of December 2011, a deep Atlantic low pressure system brought very strong winds across the northern half of the UK. Due to the severity of the hurricane-force winds, the storm was offically named Hurricane Friedhelm. The event resulted in widespread travel disruption, power cuts and school closures. Mean wind speeds were found to be over 25m/s across many areas of Scotland and as such the storm provided the necessary wind speed conditions for a HWSS incident to occur at Wind Farm A.
[image:3.612.54.296.213.362.2]12:00 15:00 18:00 21:00
0 25 50 75 100 125 150
08-Dec-2011
P
ow
er
[M
W
]
12:00 15:00 18:00 21:00 0
5 10 15 20 25 30 35 40
W
in
d
S
p
ee
d
[image:4.612.311.565.52.198.2]Wind Farm Power Wind Farm Rated Power Cut-Out Speed Mean Wind Speed
Fig. 5. Power Loss Comparison with Mean Wind Speed at Wind Farm A
average period of downtime at Wind Farm A due to HWSS is approximately 4 hours.
10:55 11:00 11:05 11:10 11:15
1 2 3 4 5 6 7 8 9 10 11 12 13 14 15 16 17 18 19 20 21 22 23 24 25 26 27 28 29 30 31 32 33 34 35 36 37 38 39 40 41 42 43 44 45 46 47 48 49 50 51 52 53 54 55 56 57 58 59 60
Shutdown Alarm Lengths
08-Dec-2011
T
u
rb
in
e
In
d
ex
10:55 11:00 11:05 11:10 11:15 0
25 50 75 100 125
08-Dec-2011
P
ow
er
[M
W
]
Loss of Generation due to HWSS
10:55 11:00 11:05 11:10 11:150 5 10 15 20 25 30 35 40 45 50 55 60
Nu
m
b
er
of
O
p
er
at
ion
al
T
u
rb
in
es
[image:4.612.54.305.55.209.2]Wind Farm Power Wind Farm Rated Power No. of Operational Turbines
Fig. 6. HWSS Incident, Wind Farm A - 8th of December 2011
The number of operational turbines (which has a sample rate of 1 minute as opposed to 10 minutes for wind farm power) can also be inspected in Figure 6 against the wind farm power. The turbine ramp-rate appears to be a lot more severe, with 59 of the 60 turbines shutting down within a space of 8 minutes. This case actually serves as the minimum ramp-down time of 6 minutes, as displayed in Table II.
Examining the shutdown alarm periods in Figure 6, there appear to be certain turbines which experience HWSS earlier than others and therefore could serve as short-term indicators of a full HWSS event.
The individual locations of the first 30 turbines to be shut-down can be seen in Figure 7. There appears to be a directional trend from the south west for the first 10 turbines. The next 20 turbines that shut-down are spread further and appear to be in positions at the edge of the wind farm or in particularly elevated locations. The majority of the first 30 turbines are situated in the south or west edges of the wind farm, with the last 30 turbines to shut down roughly situated in the centre north or eastern parts of the site. The wind directions measured at masts 1 (north of the site) and 2 (south-west of the site) for the period of HWSS predominately come from the south-west
Fig. 7. Order of HWSS Shutdown - Wind Farm A, 8th of December 2011
and west respectively, showing good rationality for the order of shut-down. A wind front is also displayed from directional data from the nearest mast (mast 1) to the 1st wind turbine HWSS.
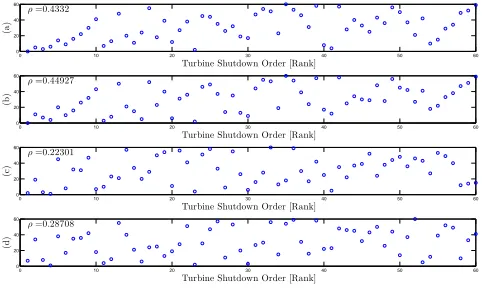
Four factors relating to the order of shut-down are assessed in Figure 8. These include: the Euclidean distance from the 1st turbine to experience HWSS, the Euclidean distance from the wind front, the elevation of the wind turbines (at the base) from mean sea level and the annual mean wind speed corresponding to the year of incident at each of the turbines. All of these factors are ranked in accordance to the turbines which have: the shortest distance to the 1st turbine, the shortest distance to the wind front, greatest elevation and highest wind speed. If the parameter shows a good relationship with turbine shut-down order, a high Spearman’s rank correlation coefficient is expected (also displayed in Figure 8).
0 10 20 30 40 50 60
0 20 40 60
ρ=0.4332
Turbine Shutdown Order [Rank]
(a
)
0 10 20 30 40 50 60
0 20 40 60
ρ=0.22301
Turbine Shutdown Order [Rank]
(c
)
0 10 20 30 40 50 60
0 20 40 60
ρ=0.28708
Turbine Shutdown Order [Rank]
(d
)
0 10 20 30 40 50 60
0 20 40 60
ρ=0.44927
Turbine Shutdown Order [Rank]
(b
)
Fig. 8. HWSS Ranked Indicators with Shutdown Order - Wind Farm A on
the 8th of December 2011: (a) Proximity to the 1st Turbine HWSS, (b) -Proximity to Wind Front, (c) - Elevation of Wind Turbine, (d) - Annual Mean Wind Speed at Turbine
The directional trend discussed before is apparent in the first 10 turbines in Figure 8(a) and (b). Many of the closer turbines are the first 30 to shut-down. However, it is difficult to interpret any overall trend for all four possible indicators.
V. FURTHERANALYSIS OFSHUT-DOWNINCIDENTS
[image:4.612.55.299.294.450.2] [image:4.612.317.558.448.592.2]0 5 10 15 20 25 30 35 40 45 50 55 60 0
5 10 15 20 25 30 35 40
Turbine Index
F
re
q
u
e
n
c
[image:5.612.324.563.58.195.2]y
Fig. 9. Number of Instances that a Turbine is one of the First Five to Shut Down
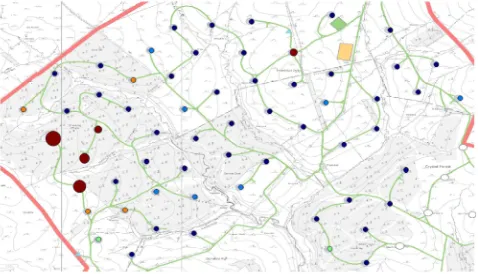
[image:5.612.61.286.59.202.2] [image:5.612.316.558.328.472.2]incidents which involved the HWSS of at least one turbine. It is evident that some specific turbines are more likely to shut-down first than others and there is the possibility that these turbines could be used as indicators for major HWSS events. Figure 9 can be interpreted locationally by assigning a colour grade to those turbines at the site, displayed in Fig-ure 10. Turbines with a higher frequency of cases exhibit warmer colours and those with a fewer frequency of cases exhibit cooler colours. Clearly, those turbines closer to the south and west edge of the site are more likely to shut down first, showing good correlation with the prevailing wind direction(s). Those less likely to shut down first are generally situated in the centre, north and east of the site. There also appears to be a few cases where turbines situated on the east side of a hill or in a small valley, are less likely to shut-down first.
Fig. 10. Heat Map of Shutdown Cases - Wind Farm A
There are several instances where the shut-down of one or more turbines does not result in the full loss of availability at the site. By investigating cases where the wind farm experiences full loss of availability in Figure 11, the five most likely candidates are in the westerly region, with one outlier near the peak of a hill towards the east. Circle radiuses are exaggerated to emphasise the top five candidates in ranking order.
If the factors from Figure 8 are analysed for all incidents involving the loss of full availability, a clearer picture of
shut-Fig. 11. Heat Map of Full Wind Farm Shutdown Cases - Wind Farm A
down factors becomes apparent. Turbines with higher annual mean wind speeds and elevations are generally more likely to shut-down first, withρvalues of However, there seems to be no improvement in trend for Figure 12 (a). The critical Spearman’sρvalue for the four ranked variables atp= 0.05
is 0.218, with
0 10 20 30 40 50 60
0 20 40 60
ρ=0.3948
Turbine Shutdown Order [Rank]
(a
)
0 10 20 30 40 50 60
0 20 40 60
ρ=0.78905
Turbine Shutdown Order [Rank]
(c
)
0 10 20 30 40 50 60
0 20 40 60
ρ=0.70281
Turbine Shutdown Order [Rank]
(d
)
0 10 20 30 40 50 60
0 20 40 60
ρ=0.23776
Turbine Shutdown Order [Rank]
(b
)
Fig. 12. HWSS Ranked Indicators with Shutdown Order - Wind Farm A
for all Full HWSS Events: (a) Proximity to the 1st Turbine HWSS, (c) -Proximity to Wind Front, (b) - Elevation of Wind Turbine, (d) - Annual Mean Wind Speed at Turbine
These results conflict the theoretical example of the pro-posed HWSS event by National Grid, suggesting that turbines will shut-down in a uniform fashion as the wind field passes over the wind farm.
VI. MULTIPLESHUT-DOWN OFWINDFARMS
[image:5.612.60.298.458.597.2]<95% <90% <80% <70% <60% <50% <40% <30% <20% <10% 0% 0%
10% 20% 30% 40% 50% 60% 70% 80% 90% 100%
Availability [%]
In
ci
d
en
ts
[%
]
[image:6.612.50.294.62.211.2]Wind Farm A before B Wind Farm B before A
Fig. 13. Incident Comparisons for Different Wind Farms
unable to consistently generate power from roughly 11:56 till 22:03. Similarly Wind Farm A had zero availability from 11:22 to 22:51.
[image:6.612.52.297.391.534.2]There was one definitive occasion where both wind farms experienced the full loss of availability due to high wind within a day of each other. Wind Farm B generated zero net power briefly on the 27th November 2011 00:16 and Wind Farm A on the 26th November 14:21. It should be noted that the time range for wind farm shut-downs to coincide is restricted by the reduced quantity of data for Wind Farm B.
Fig. 14. Net Power At Wind Farms A and B during Hurricane Friedhelm
(*total contribution frommeteredwind farms)
An aggregated UK Wind power curve is also provided in Figure 14. The curve follows a similar trend to the reduction and increase of power of Wind Farms A and B. However, the aggregated generation across the country still retains over 1.1GW of power over the period of the Hurricane. The reduction in aggregated power occurs before the HWSS events at the wind farms studied. This demonstrates the need for further examination of other wind farms that contribute to this overall reduction.
VII. CONCLUSIONS
This analysis has shown that HWSS events are of varying levels, with incidents predominately involving the loss of a fraction of availability. However these events can produce
characteristically high ramp rates, this presents a particular challenge to the System Operator in terms of the efficient allocation of reserve while minimising balancing costs. How-ever, while the timing of HWSS events is difficult to predict, analysis of the shut-down order and timings indicate that the SO may be able to make a probabilistic assessment of the likelihood of further turbines or sites shutting down following the first turbine(s) to do so. While it might be expected that the shutdown order is predicated by the direction of movement of a weather front, the data shows that differences in elevation and mean velocity provide a stronger correlation to shutdown order, and hence particular turbines may be suitable as HWSS indicators. Hence, any probabilistic method for forecasting shutdown magnitudes and timings could be tuned to particular site configurations. While the quantity of concurrent data available to this analysis has made it difficult to quantify an equivalent relationship in the shutdown order of sites across a transmission zone, particular cases have shown that it may be possible for outlying wind farms to serve as early warning indicators to other sites, and hence a wider analysis of HWSS data across multiple sites could serve to generate a probabilistic heuristic for setting reserve levels during a HWSS event across a region with a high level of wind generation.
ACKNOWLEDGEMENTS
The authors gratefully acknowledge National Grid for their involvement in this research proposal and Natural Power for SCADA data extraction and filtering. The authors also gratefully appreciate and acknowledge the support of the UKs Engineering and Physical Sciences Research Council via the University of Strathclyde’s Wind Energy Systems Centre for Doctoral Training, grant number EP/G037728/1.
REFERENCES
[1] P. Jamieson,Innovation in Wind Turbine Design. Wiley, 2011. [2] N. A. Cutululis, M. Litong-Palima, and P. Srensen, “Impact of high wind
shut-down in the danish power system,” in12th International Workshop on Large-Scale Integration of Wind Power into Power Systems as well as on Transmission Networks for Offshore Wind Power Plants, London, 2013.
[3] Imperial College and NERA, “Understanding the balancing challenge,” August 2012.
[4] N. Detlefsen, P. Sorensen, and P. Eriksen, “Managing critical weather conditions in a large-scale wind based european power system - the twenties project,” in Power and Energy Society General Meeting, San Diego, CA, July 2011.
[5] P. Tielens and D. Van Hertem, “Grid inertia and frequency control
in power systems with high penetration of renewables,” in Young
Researchers Symposium in Electrical Power Engineering, Delft, The Netherlands, April 2012.
[6] Twenties, “Twenties project - final report,” Twenties, Tech. Rep., October 2013.
[7] National Grid, “High wind speed shutdown workgroup report,” July 2013.
[8] RES, “High wind speed shutdown modelling,” March 2012.
[9] P. Coughlan, J. O’sullivan, and N. Kamaluddin, “High wind speed shut-down analysis,” inUniversities Power Engineering Conference (UPEC), 2012 47th International, London, September 2012.
![Fig. 1.High Wind Strategy for a Typical Wind Turbine [2]](https://thumb-us.123doks.com/thumbv2/123dok_us/1642140.117664/1.612.312.565.212.381/fig-high-wind-strategy-typical-wind-turbine.webp)