Computation of irradiance in a solar still by using a re
fi
ned algorithm
A. Madhlopa
*, J.A. Clarke
Energy Systems Research Unit, Department of Mechanical and Aerospace Engineering, University of Strathclyde, 75 Montrose Street, Glasgow G1 1XJ, United Kingdom
a r t i c l e i n f o
Article history:
Received 19 February 2012 Accepted 8 August 2012 Available online 6 October 2012 Keywords:
Effective irradiance Radiation exchange Multiple reflections
a b s t r a c t
A refined solar algorithm from the ESP-r system has been used to calculate the distribution of solar irradiation inside a basin-type solar still. In the approach, surfacefinish, view factors and multiple reflections are taken into consideration in the computation of the solar radiation that reaches the surface of the saline water in the distillation system. The algorithm was applied to a solar still tested at the University of Strathclyde in Glasgow (55520N, 4150W). Under the prevailing meteorological condi-tions, it was found that previous models overestimated the computed solar load on the saline water surface. The present modelling approach is demonstrated to exhibit a higher degree of accuracy than previous methods for irradiance distribution prediction, yielding new insights into approaches to solar still performance improvement. The modelling outcomes are presented and discussed.
Ó2012 Published by Elsevier Ltd.
1. Introduction
Clean water is essential for good health, which influences the social and economic development of any nation. Nevertheless, available water on the earth’s surface is usually impure[1]. This problem is exacerbated by pollution of fresh water resources and results in limited access to safe drinking water, especially in developing countries[2]. In such cases, the quality of water can be improved through desalination.
Conventional techniques for water desalination are broadly classified into thermal (phase-change) and membrane-based (single-phase) categories [3,4]. The former includes multi-stage flash (MSF), multi-effect distillation (MED) and vapour compres-sion distillation (VCD); while the latter comprises reverse osmosis (RO), nanofiltration (NF) and electrodialysis (ED). In thermal desa-lination, salts are removed from water by evaporatione condensation processes. Membrane based techniques employ a membrane through which water diffuses with a high proportion of the salts being retained. However, these techniques require a large input of energy and are not cost-effective for low volumes of clean water[5]. Improvements in solar distillation technology make it suitable for desalting water in remote areas where water demands are below 50 m3per day[6]. A review of the status of solar
distillation by Tiwari et al.[7]described it as the commonest, non-conventional method for upgrading water quality.
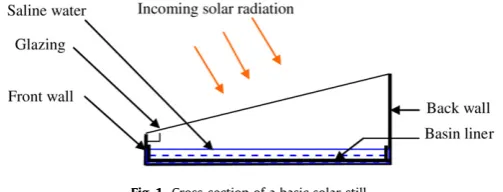
The most widely exploited solar distiller is a conventional solar still[8], which has a thin layer of saline water in a shallow basin, with a single- or double-sloped transparent cover over the water and a channel for collecting the distillate. Saline water in the basin is heated by solar radiation passing through an inclined transparent cover and absorbed by the water and bottom part of the still basin (Fig. 1). Vapour rises from the hot water and condenses when it comes into contact with the inner surface of the transparent cover. The condensate (clean water) is collected in a channelfitted along the lower edge of the transparent cover. For a given set of design parameters, the productivity of the system is influenced by weather and operational factors, with a single-slope solar still intercepting a higher proportion of the incident solar radiation than a double-sloped configuration at both low and high latitude locations[9]. In particular, solar radiation is the most influential environmental parameter[10]; it is therefore necessary to know the amount of solar energy that drives the thermal processes in the distiller.
Incoming solar radiation that reaches the earth’s surface comprises beam and diffuse components, which have different optical properties when incident on a surface[11e13]. Beam radi-ation travels directly from the sun’s disc to a receiver surface, and its rays are traceable from the sun’s position and used in deter-mining solar angles. This component of radiation can also be focused to increase the amount of solar energy intercepted per unit area of an absorber surface. On the other hand, diffuse radiation comes from the whole sky vault and it cannot be focused. Moreover, its rays are not traceable from the sun’s position, and the amount of
*Corresponding author. Present address: The Polytechnic, University of Malawi, P/Bag 303, Blantyre 3, Malawi.
E-mail addresses: [email protected], [email protected] (A. Madhlopa).
Contents lists available atSciVerse ScienceDirect
Renewable Energy
j o u r n a l h o m e p a g e : w w w . e l s e v i e r . c o m / l o c a t e / r e n e n e
diffuse solar energy directly received by a given surface depends on the proportion of the sky viewed by the surface[14].
[image:2.595.33.285.67.163.2] [image:2.595.114.476.608.729.2]Solar radiation travels through the air before it reaches a given surface. The surface reflects (
r
), absorbs (a
) and transmits (s
) part of the radiation. The sum of the proportions of reflected, absorbed and transmitted radiation is equal to one and these fractions are influenced by the optical properties of incoming solar radiation [14,15]. It should be mentioned that the values ofr
ands
at normal incidence (q
¼0) are commonly available for different transparent materials with specified thicknesses, ands
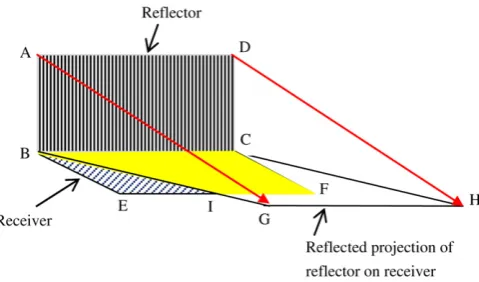
¼0 for opaque surfaces. Radiation may be reflected specularly or diffusely, depending on surfacefinish. Radiation goes in one direction from a specular plane reflector but it is scattered in different directions in diffuse refl ec-tion (Fig. 2). In addition, values of specular view factor and refl ec-tance are required in the computation of reflected beam radiation [16,17]. A schematic example of a specular plane reflector and receiver is shown inFig. 3. The reflector is illuminated by solar radiation during a certain time of the day. At this given time, the reflected projection area of the reflector on a horizontal surface is the parallelogram BCHG. Nevertheless, this area overlaps with that of the receiver in the region labelled BCFI. So, the reflector views only the overlapping area of the receiver. When the sun changes its position, the angles of incidence and reflection also change which affects the magnitude of the overlapping area. A specular view factor, therefore, varies with the position of the source of beam radiation (the sun, in this case). Diffuse view factor and reflectance are used in the calculation of the magnitude of reflected diffuse radiation[14]. It should nevertheless be mentioned that reflection is often assumed diffuse on real surfaces[15]. In addition, part of the reflected radiation may reach other surrounding surfaces, resulting in multiple reflections amongst surfaces (Fig. 4). It should be noted fromFig. 4that the intensity of the incident ray dimin-ishes after each reflection step due absorption by the surface. In addition, the reflected rayGr3can again reach surface 1. In this case, the total radiation incident on surface 1 is (GiþGr3) which is greater thanGi. The three surfaces can exchange radiation repeatedly until the intensity of the remaining radiation is insignificant. These optical properties are vital in the computation of irradiance on the surface of saline water.Previous studies have examined the proportion of the incident solar radiation that contributes to the heat and mass transfer processes in a solar still. Cooper[18]studied the factors that affect the efficiency of a single-slope solar still with a horizontal basin, taking into consideration the proportion of solar radiation reflected from the walls onto the surface of the saline water. It was estimated that irradiance on the water surface increased by 10%. Nevertheless, a model was not established for calculating the reported fraction. To address this drawback, Tripathi and Tiwari[19]proposed a model for computing the distribution of solar radiation inside a single-slope solar still. In their model, they included the proportion of the solar radiation reflected by the walls onto the water surface and calculated the solar fraction for a particular wall. They found that the effect of the solar fraction was significant at low solar altitudes. However, they did not split the global irradiance into beam and diffuse components and optical view factors were not taken into consideration. Tanaka and Nakatake[20]performed a theoretical analysis of a solar still with internal and external reflectors. They split the global irradiance into beam and diffuse components. It was found that reflectors could significantly increase distillate yield, but again optical view factors were not included in the model. Later, Madhlopa and Johnstone [21,22]split the global irradiance into beam and diffuse components, and included optical view factors in their models for computation of effective solar irradiance on the surface of saline water. Nevertheless, multiple reflections were not taken into account in all these studies. Internal surfaces of a prac-tical basin-type solar still reflect part of the transmitted solar radiation, resulting in multiple reflections as a reflective material is usually used on the inside walls of the still (Fig. 5). Thus, neglecting this process of radiation attenuation would limit the accuracy of predicting the distillate output. The objective of this study was therefore to overcome this limitation.
The radiation tracing algorithm as embedded within the ESP-r system was used to compute the solar radiation that effectively researches the surface of saline water in a solar still. The algorithm was applied to a solar still tested outdoors at the University of Strathclyde from 6th September to 5th November 2007. It is found that the performance of the refined algorithm is satisfactory.
2. Methodology
2.1. Description of solar still
Non-tracking solar collectors, including distillers, are generally inclined to the horizontal and face toward the Equator to optimize solar collection. Garg and Mann[9]reported that the optimum tilt angle (
b
) of the transparent cover over a conventional solar still is 10, which just enables the distillate toflow downwards on the inner surface of the cover without dropping back into the basin. Nevertheless,b
also affects the transmission of solar radiationFig. 1.Cross-section of a basic solar still.
through the cover[14]:
b
>10is sometimes used depending on the latitude (f
) of the site[10]. Generally,b
¼f
e10for the summer season,b
¼f
for annual performance andb
¼f
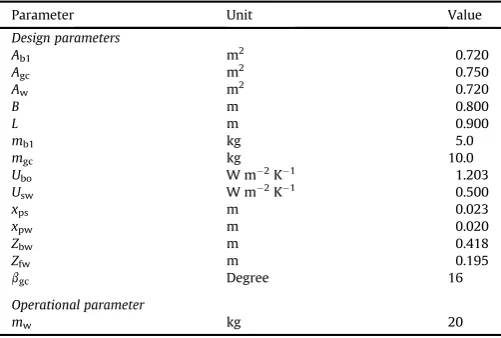
þ10for the winter season[23].The objective of the present study was to compute the amount of solar energy received by the saline water in a single-slope solar still by using a refined solar algorithm which takes into account design and site parameters, and view factors and multiple refl ec-tions. The basin (0.90 m0.80 m) of the test solar still was made of galvanized steel (0.0008 m thick), painted black on the inner surface to maximise the absorption of solar radiation and placed horizontally on polystyrene insulation inside a plywood box. A glass cover (0.004 m thick,
b
¼16) wasfitted on the top part of the evaporator chamber to allow solar radiation to reach the saline water in the basin. A rectangular galvanized steel channel was fitted inside the box on the lower edge of the glass. The inside part of the box was painted black to reduce the condensation of vapour on the walls, while the exterior part of the box was painted gloss light green to protect the wooden structure from weathering. Details of the system design and operating parameters are pre-sented inTable 1.2.2. Energy balance equations
Energy balance equations were formulated to predict the thermal performance of the solar still, with the following assumptions:
(a) the solar still is air-tight; and
(b) there is no leakage of vapour and condensate.
With these assumptions, the energy balance equations for the still are[21,22]:
Glass cover (gc)
mgcCp;gc
dTgc
dt ¼AgcGab;gcþAwhgc
TwTgc
Agchc;gca
TgcTa
Agchr;gcsk
TgcTsk
ð1Þ
hgc ¼ hc;wgcþhe;wgcþhr;wgc
(2)
Basin liner (bl)
mb1Cp;b1
dTb1
dt ¼ Aw h
Fb1Gg;efhc;b1wðTb1TwÞ
UboðTb1TaÞ
i
(3)
Saline water in basin (w)
mwCp;wdTw
dt ¼Aw h
FwGg;efþhc;b1wðTb1TwÞ i
AwhwTwTgc
AswUswðTwTaÞ (4)
hw ¼ hc;wgcþhe;wgcþhr;wgc (5)
Rate of evaporation (m_e)
_ me ¼
Awhe;wgc
TwTgc
L0w (6)
The distillate yield (Y) in a time interval of (t2et1) can be calculated from:
Y ¼ 1
Aw Zt2
t1 _
medt (7)
2.3. Solution procedure
[image:3.595.49.289.65.206.2]Solar radiation absorbed by the glass (Gab,gc) and the base of the still (Gab,sb) was calculated by ESP-r, which possesses a refined algorithm for the computation of insolation and shading effects[24].
Fig. 3.Specular reflection: AG and DH are reflected rays, ABCD¼vertical rectangular
reflector, BCFE¼horizontal rectangular receiver, BCHG¼projection of reflector on receiver and BCFI¼area of overlap between illuminated area and receiver. Specular view factor is the ratio of the overlap area to the area of the receiver.
Surface 2 Gi
Gr2 Gr1
Surface 1 Surface 3
[image:3.595.317.559.66.180.2]Gr3
Fig. 4.Multiple reflections on three opaque surfaces that are within proximity:Giis
the incident radiation whileGr1,Gr2andGr3are reflected components.
Fig. 5.Multiple reflections within the cavity of a basin-type solar still. Part of the
[image:3.595.46.291.499.712.2]Beam and diffuse components of solar radiation are treated sepa-rately, and optical view factors and multiple reflections are taken into consideration. The geometry and construction of the solar distillation system was defined in ESP-r with the origin atx¼0,y¼0 andz¼1.0 m to simulate the system in a mounted mode (thex-,y -andz-axes are mutually perpendicular,z-axis is vertical andxey
plane is horizontal). The still base was in thexeyplane, with the diagonals of the base intersecting at the origin. View factors were calculated by using ESP-r’s ray tracing technique, and the computed optical view factors were used in the computation of solar radiation absorbed by the base of the solar still in any given hour.
The solar radiation absorbed at the water surface was deter-mined after making allowance for the reflected and transmitted portions of the incidentflux (part of the transmitted component is absorbed by the basin liner). The effective solar radiation incident on the water surface (Gg,ef) was calculated from:
Gg;ef ¼ Gab;sb=
a
sb (8)The values of the solar absorption factors for water and the basin liner were computed using[14]:
Fw ¼
a
w (9)Fbl ¼
a
blð1a
wr
wÞ (10)Heat loss from the top of the glass cover to the environment is predominantly by convection (to ambient air) and longwave radi-ation (to sky). Wind influences the convective heat transfer from the top part and the convective heat transfer coefficient is calcu-lated from[25]:
hc;gca ¼
2:8þ3Vwd;Vwd5 ms1
6:15V0:8
wd;Vwd>5 ms1
(11)
The coefficient of radiative heat transfer to the sky is given by [14]:
hr;gcsk ¼
s
3gc
Tgc2 þTsk2TgcþTsk
(12)
with the following correlation for the sky temperature[26]:
Tsk ¼ 0:0552Ta1:5 (13)
The evaporation and condensation processes involve the transfer of both heat and mass. Consequently, relevant correlations
are used to estimate the coefficients of internal convective and evaporative heat transfers from the hot water to each of the condensing surfaces. Tsilingiris[27]studied the influence of using the thermo-physical properties of the mixture of moisture and dry air in the derivation of the coefficients of heat and mass transfer in solar stills. It was found that the accuracy of modelling the transfer of heat and mass in solar stills improved when the thermo-physical properties of a binary mixture were used instead of the properties of dry air alone. Recently, Tsilingiris[28]reported the following general equations for calculating the coefficients of heat transfer by natural convection and evaporation from the surface of hot water to the glass cover:
hc;wgc ¼ bkmaS3d1 g
4
mab
0 mam
maa
0ma!d
TwTgc
þTw
PwPgcðMdaMvÞ MdaPtoPwðMdaMvÞ
d
(14a)
S ¼ 0:5ZbwþZfw
(14b)
he;wgc ¼ 1000L 0
whc;wgcRda Cp;maRv
Pto
ðPtoPwÞPtoPgc (15)
Thermo-physical properties of a binary mixture were used in the study. It was found thatd¼1/3 can be used in a wide range of operating temperatures for a solar still, andb¼0.075 when the rate of distillation is lower than 1104kg m2s1andb¼0.05 at higher rates of distillate production. In addition, there was good agreement between theoretical and experimental rates of distillate production. So, Eqs.(14) and (15)were used to calculate the coef-ficients of convective and evaporative heat transfer inside the still, and properties of moist air were computed according to Tsilingiris[27].
There is also internal heat radiation from hot water to the glass cover. The coefficient of internal radiative heat transfer is estimated from[14]:
hr;wgc ¼
s
3w;gc
Tw2þTgc2TwþTgc
(16)
3w;gc ¼ 1 3wþ
1
3gc1
1
(17)
Heat is also transferred from the basin liner to the saline water. The coefficient of convective heat transfer from the surface of the basin liner to the saline water (hc,bl-w) was taken to be 100 Wm2K1 [19,29]. In addition, there is heat loss from the bottom and side walls of the still. In this study, the coefficient of bottom heat loss is calculated from[14]:
Ubo ¼ xps kpsþ
xpw kpw
1
(18)
The coefficient of heat loss from the sides is taken as 0.5 Wm2K1[30].
[image:4.595.33.284.93.262.2]Thermophysical properties of other materials used in the present study are: Cp,gc ¼ 750 Jkg1 K1, Cp,bl ¼ 477 Jkg1K1, Cp,w¼4190 J kg1K1,kps¼0.0346 Wm1K1,kpw¼0.1200 Wm1K1,
a
bl¼0.90,a
sb¼0.90,a
w¼0.05,a
wa¼0.90,r
w¼0.02,r
wa¼0.05, 3gc¼0.88, 3w1¼0.96, ands
¼5.67108Wm2K4. At normal incidence, the values ofa
gcands
gcwere 0.10 and 0.78 respectively. A temperature-dependent correlation was used to calculate the latent heat of water vaporization[31]. The saturation vapour pressure insideTable 1
Design and operational parameters for a solar still with separate condenser and reflectors.
Parameter Unit Value
Design parameters
Ab1 m2 0.720
Agc m2 0.750
Aw m2 0.720
B m 0.800
L m 0.900
mb1 kg 5.0
mgc kg 10.0
Ubo W m2K1 1.203
Usw W m2K1 0.500
xps m 0.023
xpw m 0.020
Zbw m 0.418
Zfw m 0.195
bgc Degree 16
Operational parameter
the solar stills was calculated using a correlation reported by ASHRAE[15].
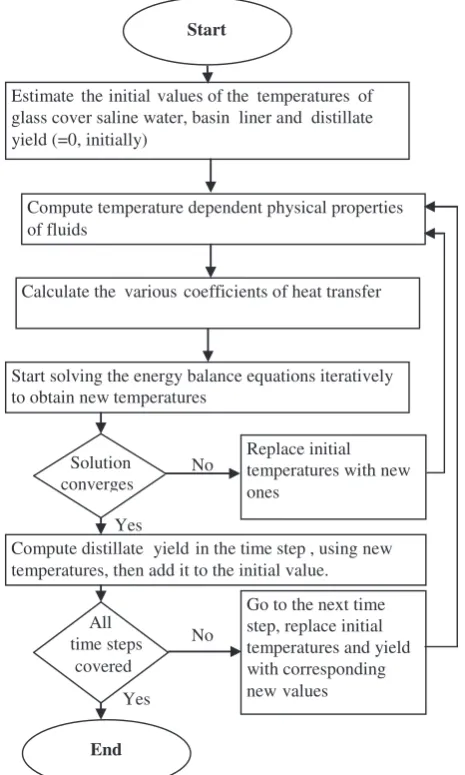
A computer program was written in MATLAB (version 7.0) to solve the above system of non-linear equations using the Gausse Seidel explicit iterative method [32], with a temperature toler-ance of 0.5 K and time step of 20 s. Values of the effective solar irradiance, ambient temperature and wind speed were used to predict the performance of the solar distillation system. Initial values for the temperatures of the system components were assumed to be approximately equal to ambient temperature (Ta). Based on these values of temperature and physical properties, appropriate coefficients of heat transfer (assumed constant in a given time step) were calculated for estimating temperatures in the next time step. Aflow chart for the computational scheme is shown inFig. 6.
2.4. Data acquisition and processing
The energy balance model requires accurate data on the design and operating factors of a solar still, and weather variables to compute distillate yield. Thus, both empirical input and output sets of data are needed for validation. Data on beam and diffuse
irradiance, ambient air temperature, wind speed and distillate yield was obtained from previous work[21]. Weather data were logged at intervals of 300 s. Hourly average values were then derived and used in the present simulations.
The beam solar irradiance (Gbh) on a horizontal surface (outside the solar still) was calculated from measured values ofGghandGdh:
Gbh ¼ GghGdh (19)
Normal incidence beam irradiance (Gnb) is required in the ESP-r algorithm, and so it was computed from[33]:
Gbn ¼ Gbh=cos
qz
(20)Effective irradiance was determined using this algorithm for calculating the distribution of solar radiation in a given solar still. The algorithm calculates beam, diffuse and ground-reflected radi-ation components incident on each exterior surface of a construc-tion layer [24]. In a given time step, the code computes beam radiation incident on a tilted surface (Gbt) using local solar angles [14]. Diffuse radiation on each external surface (Gdt) was calculated using an anisotropic model proposed by Perez et al.[34]. In addi-tion, ground reflected radiation (Ggt) was taken into account using an isotropic model[14]. In this study, the value of ground refl ec-tance was assumed to be 0.2 (there was no snow to augment ground reflectance during the experimental period). The total irradiance on each external surface (Ggt) is the sum of the three components:
Ggt ¼ GbtþGdtþGrt (21)
For the glass cover, part ofGgtis transmitted through the cover onto internal surfaces, where it undergoes absorption and refl ec-tion. For the walls (opaque), part of Ggt is absorbed while the remainder is reflected. The glass cover receives and re-transmits part of the radiation reflected from internal surfaces (Fig. 5), and diffuse reflection is assumed in the ESP-r system. The code re-distributes the remaining diffuse radiation in the cavity until its value is less than 1% of the incomingflux, or 0.1 Wm2.
Previous models were also used to estimate effective irradiance [19,20,22], which was used in the energy balance equations to predict distillate yield. Finally, the mean bias error (MBE), root mean square error (RMSE) andt-statistic were computed to eval-uate the performance of the present and previous computational techniques[35].
3. Results and discussion
3.1. Weather
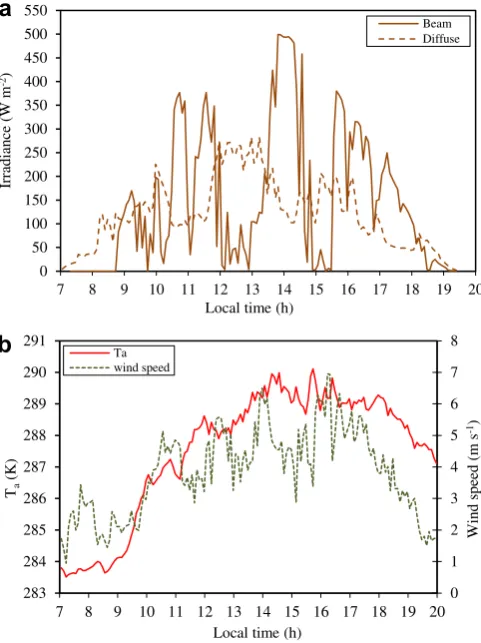
Fig. 7shows the variation of weather at time intervals of 300 s on a sample day (19th September 2007). It is observed that beam irradiance was higher than diffuse irradiance during most of the day. The beam irradiance was intermittent but the observed levels are satisfactory for a site at high latitude in the Northern hemi-sphere during the month of September. It should be mentioned that solar radiation is the most influential environmental parameter in distillate productivity[10]. Distillate production increases with the magnitude of solar irradiance.
It is seen that ambient air temperature was relatively low, varying between 284 and 290 K during the test period. Distillate production tends to increase with temperature [10,36]. Conse-quently, production of distilled water would also be adversely affected on such a day in spite of satisfactory levels of solar radiation.
All
time steps
covered
Yes
Yes
No
Estimate the initial values of the temperatures of
glass cover saline water, basin liner and distillate
yield (=0, initially)
Start
Compute temperature dependent physical properties
of fluids
Calculate the various coefficients of heat transfer
Start solving the energy balance equations iteratively
to obtain new temperatures
Compute distillate yield in the time step , using new
temperatures, then add it to the initial value.
End
No
Replace initial
temperatures with new
ones
Go to the next time
step, replace initial
temperatures and yield
with corresponding
new values
Solution
converges
Fig. 6.Flow chart for computation of the temperatures of system components and
[image:5.595.52.285.324.712.2]The wind speed (Vwd) varied between 0.9 and 11.4 m s1. Generally, wind speeds exceeded 2.0 m s1from 10:00 to 190 h. On other test days, wind speeds exceeding 10 m s1were also recorded during certain times. El-Sebaii [37] found that distillate yield decreased with increasing Vwd until a typical wind speed was reached, for water masses (mwb) less than 45 kg m2. So, the rate of distillation would be adversely affected by the levels of wind speed becausemwb¼28 kg m2in the present study.
3.2. Effective solar radiation
[image:6.595.38.279.69.391.2] [image:6.595.303.551.84.317.2]Fig. 8 shows the variation of the total hourly effective and observed irradiance with time on19th September 2007. It is seen that the effective irradiance is lower than the observed values due to radiation attenuation. Incoming solar radiation is incident on the transparent cover, which transmits part of the radiation onto the surface of the saline water and internal surfaces of the walls. In turn, these internal surfaces reflect a fraction of the radiation onto the water surface. The walls of the solar still also cast shadows on the surface of the water, with the effect of shading being higher at low solar altitudes.
Table 2shows the daily horizontal effective (Hg,ef) and observed global insolation (Hgh) on 22 different test days. It is observed that the effective insolation was consistently lower than the observed values on all test days. On average, the proportion ofHg,fe/Hghwas 40%, which indicates the significance of solar attenuation inside the solar still.
0 100 200 300 400 500 600
0 2 4 6 8 10 12 14 16 18 20 22 24
T
o
tal irrad
iance
(W
m
-2)
Local time (h)
[image:6.595.37.281.560.710.2]effective observed
Fig. 8.Variation of effective and observed irradiance at hourly intervals on 19th
September 2007 at the University of Strathclyde. Effective irradiance was computed using the refined algorithm.
Table 2
Daily effective (Hg,ef) and observed (Hgh) insolation at University of Strathclyde. Test day Daily insolation (106Jm2)
Hgh Hg,ef
1 10.242 3.056
2 11.903 5.056
3 7.669 2.052
4 10.652 5.676
5 11.717 6.160
6 9.282 5.544
7 12.097 6.768
8 9.182 5.512
9 2.016 0.488
10 9.393 3.584
11 2.520 0.016
12 8.591 4.792
13 5.450 2.364
14 2.936 0.768
15 7.211 4.016
16 6.595 3.644
17 3.162 0.956
18 5.912 3.168
19 2.751 0.732
20 2.448 0.604
21 2.421 0.544
22 3.981 1.604
Mean 6.733 3.050
0
0.01
0.02
0.03
0.04
0.05
0.06
0.07
10
11
12
13
14
15
16
17
18
Distllate y
ield
(k
g m
-2
)
Local time (h)
Fig. 9.Hourly distillate yield on 19th September 2007 at the University of Strathclyde.
a
b
0 50 100 150 200 250 300 350 400 450 500 550
7 8 9 10 11 12 13 14 15 16 17 18 19 20
Irradian
ce (W
m
-2)
Local time (h)
Beam Diffuse
0 1 2 3 4 5 6 7 8
283 284 285 286 287 288 289 290 291
7 8 9 10 11 12 13 14 15 16 17 18 19 20
Wi
n
d s
pe
ed (m
s
-1)
Ta
(K)
Local time (h)
Ta wind speed
Fig. 7.Variation of a) observed beam and diffuse irradiance on a horizontal surface,
[image:6.595.304.550.562.727.2]3.3. Distillate yield
Fig. 9 shows the variation of hourly distillate yield on 19 September 2007. It is seen that the amount of distilled water is low in the morning, with production commencing after 10:00 h on this test day. This is expected because production starts when the air inside the still is saturated with water vapour. The maximum rate of distillation is observed around 15:00 h, almost an hour after maximum insolation due to thermal inertia. On the typical date, the solar still produced a total amount of 0.606 kg m2 of distilled water.
The variation of the distillate yield on 22 different test days is presented inFig. 10. It is observed that the daily distillate yield varied from 0.040 to 0.646 kg m2. These levels of production are probably due to low values of insolation at this site which is located at high latitude in the Northern Hemisphere. Distillate yieldfl uc-tuated due to weather changes on different test days.
Fig. 11 shows the variation of the empirical daily distillate productivity (Y) with insolation (H) at the University of Strathclyde. It is seen thatYincreases withH, and the correlation between these two variables is very strong (r2¼0.921). This observation agrees with findings from previous work [10]. Thus, the relatively low yield is predominantly ascribed to the levels of solar radiation at this site.
3.4. Performance of dynamic algorithm
[image:7.595.44.292.66.202.2] [image:7.595.316.560.68.220.2]3.4.1. Effective solar radiation
Fig. 12shows the variation of observed global hourly irradiance on a horizontal plane and effective irradiance inside the solar still. It
is seen that the previous models slightly overestimate effective irradiance during most of the day when compared to predictions obtained from the refined solar model. This outcome is ascribed to the differences in the assumptions about the characteristics of solar radiation. Multiple reflections were not built in the previous models. In addition, all the values of effective irradiance are lower than the corresponding values of observed irradiance, probably due to attenuation of solar radiation inside the solar still.
The variation of effective daily insolation is presented inFig. 13. It is seen that the previous models yield higher values of insolation than those obtained by using the refined algorithm on most test days. On average, the proportion ofHg,fe/Hghestimated by the Tri-pathi and Tiwari[19], Tanaka and Nakatake[20], Madhlopa and Johnstone[22]and the refined models were respectively 55%, 83%, 53% and 40%. These differences are again attributed to the assumptions about the characteristics of solar radiation.
[image:7.595.314.561.557.719.2]3.4.2. Distillate output
Fig. 14 shows the variation of hourly distillate yield on 19 September 2007. It is observed that the Tanaka and Nakatake[20] model distinctly overestimated distillate yield compared to the other models on this date, with the Madhlopa and Johnstone[22] model slightly underestimating distillate output between 14:00 and 18:00 h. It should be noted that the hourly production is relatively small due to low insolation levels, which makes it difficult
Y = 0.0551H - 0.0722 r² = 0.921
0.0 0.1 0.2 0.3 0.4 0.5 0.6 0.7
0 2 4 6 8 10 12 14
Distillate
y
ield
(k
g m
-2)
Daily insolation (x106J m-2)
Fig. 11.Variation of the daily distillate production with insolation on a horizontal
surface outside the solar still.
0 100 200 300 400 500 600
0 2 4 6 8 10 12 14 16 18 20 22 24
T
o
tal irrad
iance
(W
m
-2)
Local time (h)
[image:7.595.46.290.572.718.2]Tripathi and Tiwari[19] Tanaka and Nakatake [20] Madhlopa and Johnstone [22] Refined algorithm observed
Fig. 12.Variation of effective and observed irradiance on 19th September 2007 at
University of Strathclyde. Effective irradiance was computed by using previous models and the refined algorithm.
Fig. 13.Variation of estimated and observed daily insolation inside and outside the
solar still at the University of Strathclyde. 0.0
0.1 0.2 0.3 0.4 0.5 0.6 0.7
1 2 3 4 5 6 7 8 9 10 11 12 13 14 15 16 17 18 19 20 21 22
Distillate
y
ield
(k
g m
-2)
Test day
to measure the hourly mass of distilled water with sufficient accuracy. So, the daily distillate yield was found to be more accurate for comparison of model performance.
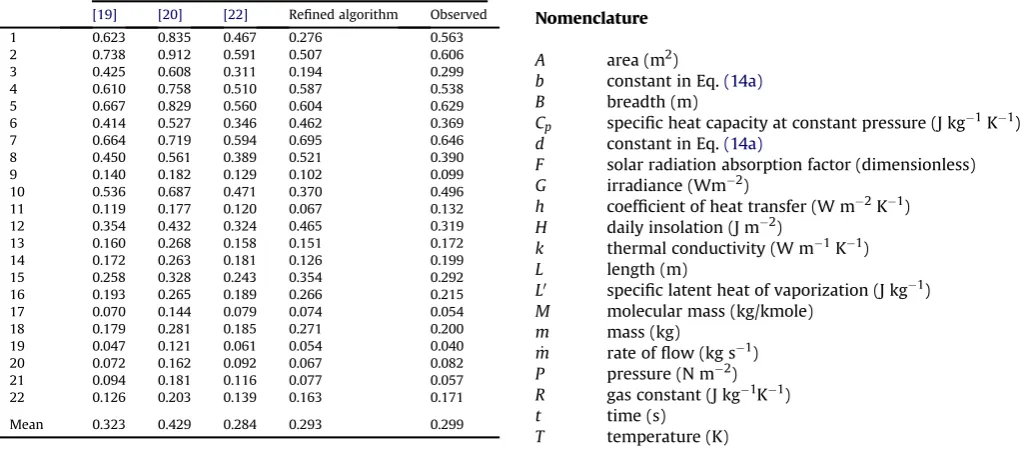
Table 3shows the estimated and observed daily distillate yield. It is seen that the Tanaka and Nakatake[20]models overestimated the daily distillate yield on all test days while all the other computational tools underestimated and overestimated on some days. Mean estimates obtained by using the Tripathi and Tiwari[19] and Tanaka and Nakatake[20]models are higher than the mean observed value while the Madhlopa and Johnstone[22]model and refined algorithm give lower average values. These observations are attributed to variations in the estimation of solar radiation that drives the distillation process. The daily distillate data was used for statistical validation of model performance.
Results of the statistical analysis of the daily yield (22 days) are presented inTable 4. It is observed that the Tripathi and Tiwari[19] and Tanaka and Nakatake [20] models slightly overestimate the
production of distilled water (MBE>0) while the Madhlopa and Johnstone[22]model and refined algorithm slightly underestimate the distillate output. Further, the RMSE for the Tanaka and Naka-take[20]model is highest, with the Madhlopa and Johnstone[22] model exhibiting the lowest value of RMSE. Finally, the refined algorithm exhibits the lowest magnitude of the t-statistic. This indicates that this algorithm is more accurate than previous tech-niques for computation of irradiance inside a basin-type solar still [34].
4. Conclusion
A refined algorithm that calculates the distribution of solar radiation in a solar still has been studied. In this algorithm, the reflectance and optical view factors of surfaces, and multiple reflections are taken into account. The algorithm was used to compute the effective irradiance in a solar still as tested at the University of Strathclyde in Glasgow. It was found that effective irradiance was lower than the irradiance observed on a horizontal surface outside the solar still and that the refined algorithm yielded lower values of effective solar radiation than previous models. Commensurate with the levels of effective irradiance, the refined algorithm yielded lower values of distillate output than the other computational techniques. In addition, the refined algorithm exhibited the lowest magnitude of the t-statistic. It is therefore concluded that the accuracy of modelling the performance of a basin-type solar still can be improved by using a refined algorithm for the computation of the effective solar irradiance.
Acknowledgements
The authors are grateful to the British Academy and Royal Society of Engineering for funding this research, and the University of Strathclyde for various forms of support.
Nomenclature
A area (m2)
b constant in Eq.(14a) B breadth (m)
Cp specific heat capacity at constant pressure (J kg1K1)
d constant in Eq.(14a)
F solar radiation absorption factor (dimensionless)
G irradiance (Wm2)
h coefficient of heat transfer (W m2K1)
H daily insolation (J m2)
k thermal conductivity (W m1K1)
L length (m)
L0 specific latent heat of vaporization (J kg1)
M molecular mass (kg/kmole)
m mass (kg)
_
m rate offlow (kg s1)
P pressure (N m2)
R gas constant (J kg1K1)
t time (s)
T temperature (K)
Table 3
Estimated and observed daily distillate yield at the University of Strathclyde. The estimated values were computed using the Tripathi and Tiwari[19], Tanaka and Nakatake[20], and Madhlopa and Johnstone[22]models, and refined algorithm.
Test day Daily distillate yield (kg m2)
[19] [20] [22] Refined algorithm Observed
1 0.623 0.835 0.467 0.276 0.563
2 0.738 0.912 0.591 0.507 0.606
3 0.425 0.608 0.311 0.194 0.299
4 0.610 0.758 0.510 0.587 0.538
5 0.667 0.829 0.560 0.604 0.629
6 0.414 0.527 0.346 0.462 0.369
7 0.664 0.719 0.594 0.695 0.646
8 0.450 0.561 0.389 0.521 0.390
9 0.140 0.182 0.129 0.102 0.099
10 0.536 0.687 0.471 0.370 0.496
11 0.119 0.177 0.120 0.067 0.132
12 0.354 0.432 0.324 0.465 0.319
13 0.160 0.268 0.158 0.151 0.172
14 0.172 0.263 0.181 0.126 0.199
15 0.258 0.328 0.243 0.354 0.292
16 0.193 0.265 0.189 0.266 0.215
17 0.070 0.144 0.079 0.074 0.054
18 0.179 0.281 0.185 0.271 0.200
19 0.047 0.121 0.061 0.054 0.040
20 0.072 0.162 0.092 0.067 0.082
21 0.094 0.181 0.116 0.077 0.057
22 0.126 0.203 0.139 0.163 0.171
[image:8.595.34.285.506.742.2]Mean 0.323 0.429 0.284 0.293 0.299
Table 4
Performance of previous models and the refined algorithm.
Model MBE (kg m2) RMSE (kg m2) t-statistic Tripathi and Tiwari[19] 0.025 0.053 2.42 Tanaka and Nakatake[20] 0.131 0.155 7.14 Madhlopa and Johnstone[22] 0.014 0.037 1.93
Refined algorithm 0.005 0.094 0.26
0.00 0.01 0.02 0.03 0.04 0.05 0.06 0.07 0.08 0.09
10 11 12 13 14 15 16 17 18
Distllate y
ield
(k
g m
-2)
Local time (h)
[image:8.595.34.551.521.747.2]Tripathi and Tiwari [19] Tanaka and Nakatake [20] Madhlopa and Johnstone [22] Refined algorithm Observed
Fig. 14.Variation of hourly estimated and observed distillate yield on 19th September
U coefficient of heat loss (W m2K1)
V velocity (m s1)
x distance alongx-axis (m)
y distance alongy-axis (m)
Y distillate yield (kg m2)
z distance alongz-axis
Z height of the wall of a solar still (m)
Greek symbols
a
absorptancea
0 thermal diffusivity (m2s1)b
angle of inclination to the horizontal plane (degree)b
0 coefficient thermal expansivity (K1)3 emittance (dimensionless)
4
density (kg m3)m
dynamic viscosity (kg m1s1)q
incidence angle (degree)r
reflectance (dimensionless)s
transmittance (dimensional)s
StefaneBoltzman constant (W m2K4)Subscripts
1 initial/first 2 final/second a air/ambient ab absorbed
b beam
bh beam on horizontal surface bl basin liner
bn normal incidence beam
bo bottom
bt beam on tilted surface bw back wall
c convective
cs condensing surface (glass cover, basin liner 2 and condensing cover)
da dry air
dh diffuse on horizontal surface dh diffuse on tilted surface e evaporative/evaporation ef effective
fw front wall g global or total gc glass cover
gh global on horizontal surface gt global on tilted surface
iej from theith to thejth surface ma moist air
ps polystyrene pw plywood r radiative
rt ground reflected on tilted surface sb still base
sk sky
sw side wall to total
v vapour
w water
wa wall
wb water per unit area of basin
wd wind
z zenith
References
[1] El-Sebaii AA, Al-Ghamdi AA, Al-Hazmi FS, Faidah AS. Thermal performance of a single basin solar still with PCM as a storage medium. Applied Energy 2009; 86:1187e95.
[2] WHO. World health statistics 2008. Geneva: World Health Organization (WHO); 2008.
[3] Fritzmann C, Löwenberg J, Wintgens T, Melin T. State-of-the-art of reverse osmosis desalination. Desalination 2007;216:1e76.
[4] Kalogirou SA. Seawater desalination using renewable energy resources. Progress in Energy and Combustion Science 2005;31:242e81.
[5] Mowla D, Karimi G. Mathematical modelling of solar stills in Iran. Solar Energy 1995;55:389e93.
[6] Bouchekima B, Gros B, Oahes R, Diboun M. Performance study of the capillary film solar distiller. Desalination 1998;116:185e92.
[7] Tiwari GN, Singh HN, Tripathi R. Present status of solar distillation. Solar Energy 2003;75:367e73.
[8] Al-Kharabsheh S, Goswami DY. Experimental study of an innovative solar water desalination system utilizing a passive vacuum technique. Solar Energy 2003;75:395e401.
[9] Garg HP, Mann HS. Effect of climatic, operational and design parameters on the year round performance of single-sloped and double-sloped solar still under Indian arid zone conditions. Solar Energy 1976;18:159e64.
[10] Nafey AS, Abdelkader M, Abdelmotalip A, Mabrouk AA. Parameters affecting solar still productivity. Energy Conversion and Management 2000;41:1797e809. [11] Liu BYH, Jordan RC. The interrelationship and characteristic distribution of
direct, diffuse and total radiation. Solar Energy 1960;4:1e19.
[12] Yang K, Huang GW, Tamai N. A hybrid model for estimating global solar radiation. Solar Energy 2001;70:13e22.
[13] Reindl DT, Beckman WA, Duffie JA. Evaluation of hourly tilted surface radia-tion models. Solar Energy 1990;45:9e17.
[14] Duffie JA, Beckman WA. Solar engineering of thermal processes. 3rd ed. New York: Wiley Interscience; 2006.
[15] ASHRAE. Fundamentals handbook. Atlanta: American Society of Heating, Refrigerating and Air-Conditioning Engineers; 2001.
[16] Wijeysundera NE. Geometric factors for plane specular reflectors. Solar Energy 1978;20:81e5.
[17] Abdel-Ghany AM, Kozai T. Radiation exchange factors between specular inner surfaces of a rectangular enclosure such as transplant production unit. Energy Conversion and Management 2006;47:1988e98.
[18] Cooper PI. The maximum efficiency of single-effect solar stills. Solar Energy 1976;15:205e17.
[19] Tripathi R, Tiwari GN. Performance evaluation of solar still by using the concept of solar fraction. Desalination 2004;169:69e80.
[20] Tanaka H, Nakatake Y. Theoretical analysis of a basin type solar still with internal and external reflectors. Desalination 2006;197:205e16.
[21] Madhlopa A, Johnstone C. Model for computation of solar fraction in a single-slope solar still. Solar Energy 2009;83:873e82.
[22] Madhlopa A, Johnstone C. Computation of solar radiation distribution in a solar still with internal and external reflectors. Solar Energy 2011;85:217e33. [23] Samee MA, Mirza UK, Majeed T, Ahmad N. Design and performance of
a simple single basin solar still. Renewable and Sustainable Energy Reviews 2007;11:543e9.
[24] Clarke JA. Energy simulation in building design. 2nd ed. London: Butterworth-Heinemann; 2001.
[25] Wattmuf JH, Charters WWS, Proctor D. Solar and wind induced external coefficients for solar collectors. Comples 1977;2:56.
[26] Sharma VB, Mullick SC. Estimation of heat-transfer coefficients, the upward Heatflow, and evaporation in a solar still. ASME Journal of Solar Engineering 1991;113:36e41.
[27] Tsilingiris PT. The influence of binary mixture thermophysical properties in the analysis of heat and mass transfer processes in solar distillation systems. Solar Energy 2007;81:1482e91.
[28] Tsilingiris PT. Analysis of the heat and mass transfer processes in solar stills. Solar Energy 2009;83:420e31.
[29] Tripathi R, Tiwari GN. Thermal modelling of passive and active solar stills for different depths of water by using the concept of solar fraction. Solar Energy 2006;80:956e67.
[30] Klein SA. Calculation offlat-plate collector loss coefficients. Solar Energy 1975. [31] Belessiotis V, Voropoulos E, Delyannis E. Experimental and theoretical method for determination of the daily output of a still: inputeoutput method. Desa-lination 1995;100:99e104.
[32] Burden RL, Faires JD. Numerical analysis. 3rd ed. Boston: PWS Publishers; 1985. [33] Kudish AI, Evseev EG. Assessment of four different correction models applied to the diffuse radiation measured with a shadow ring using global and normal beam radiation measurements for Beer Sheva, Israel. Solar Energy 2008;82:144e56. [34] Perez R, Ineichen P, Seals R, Michalsky J, Stewart R. Modelling daylight
availability and irradiance components from direct and global irradiance. Solar Energy 1990;44:271e89.
[35] Stone RJ. Improved statistical procedure for the evaluation of solar radiation estimation models. Solar Energy 1993;51:289e91.
[36] Cooper PI. Digital simulation of transient solar still processes. Solar Energy 1969;12:313e31.