R E V I E W
Open Access
Recruiting participants to walking intervention
studies: a systematic review
Charlie E Foster
1*, Graham Brennan
2, Anne Matthews
1, Chloe McAdam
2, Claire Fitzsimons
2and Nanette Mutrie
2Abstract
Purpose:
Most researchers who are conducting physical activity trials face difficulties in recruiting participants who
are representative of the population or from specific population groups. Participants who are often the hardest to
recruit are often those who stand to benefit most (the least active, from ethnic and other minority groups, from
neighbourhoods with high levels of deprivation, or have poor health). The aim of our study was to conduct a
systematic review of published literature of walking interventions, in order to identify the impact, characteristics,
and differential effects of recruitment strategies among particular population groups.
Methods:
We conducted standard searches for studies from four sources, (i) electronic literature databases and
websites, (ii) grey literature from internet sources, (iii) contact with experts to identify additional
“
grey
”
and other
literature, and (iv) snowballing from reference lists of retrieved articles. Included studies were randomised
controlled trials, controlled before-and-after experimental or observational qualitative studies, examining the effects
of an intervention to encourage people to walk independently or in a group setting, and detailing methods of
recruitment.
Results:
Forty seven studies met the inclusion criteria. The overall quality of the descriptions of recruitment in the
studies was poor with little detail reported on who undertook recruitment, or how long was spent planning/
preparing and implementing the recruitment phase. Recruitment was conducted at locations that either matched
where the intervention was delivered, or where the potential participants were asked to attend for the screening
and signing up process. We identified a lack of conceptual clarity about the recruitment process and no standard
metric to evaluate the effectiveness of recruitment.
Conclusion:
Recruitment concepts, methods, and reporting in walking intervention trials are poorly developed,
adding to other limitations in the literature, such as limited generalisability. The lack of understanding of optimal
and equitable recruitment strategies evident from this review limits the impact of interventions to promote
walking to particular social groups. To improve the delivery of walking interventions to groups which can benefit
most, specific attention to developing and evaluating targeted recruitment approaches is recommended.
Keywords:
Recruitment, walking, physical activity, health promotion
Introduction
It is over a decade since Professors Jerry Morris and
Adrienne Hardman described walking as the
‘nearest
activity to perfect exercise’
(Hardman & Morris, p328,
1997) [1]. The epidemiological research underpinning
their statement has rapidly increased, so that the
pro-motion of walking is now a central pillar in many
inter-national physical activity strategies and inter-national plans, e.
g. 2010 Toronto Charter for Physical Activity [2].
Regu-lar walking, independent of other physical activity, can
reduce the risk of overall mortality, of cardiovascular
disease (CVD) and improve risk factors for CVD,
including diastolic blood pressure and lipid profiles
[3-5]. Regular walking is associated with a reduction in
body mass index and body weight, with reduced risk of
type 2 diabetes [6] and is suggested to improve self
esteem, relieve symptoms of depression and anxiety, and
improve mood [7,8]. From a public health perspective,
enabling an increase in overall population levels of
* Correspondence: charlie.foster@dph.ox.ac.uk 1Department of Public Health, University of Oxford, UK Full list of author information is available at the end of the article
physical activity through walking will produce an
effec-tive reduction in risk of all cause mortality [9].
A systematic review of the effectiveness of walking
interventions found evidence for a range of approaches
[10]. These included brief advice to individuals, remote
support to individuals, group-based approaches, active
travel and community level approaches. Recent reviews
have provided evidence to support environmental and
school based travel interventions [10-12]. Despite the
evidence for the benefits of walking for health,
popula-tion rates of walking and overall physical activity remain
low and below recommended levels [13-15]. Population
surveys report that walking behaviour is socially
pat-terned by gender, age, socio-economic status (SES) and
by the purpose of walking i.e. for leisure or transport.
For example, in the UK long brisk paced walks are more
common among affluent groups, whereas walking for
transport is more common among less affluent groups
[14,16].
One criticism of the evidence base for walking
inter-ventions is a failure to recruit specific groups of the
population and further studies are needed to broaden
the reach of walking interventions [10-12]. Intervention
reach, or recruiting specific population sub-groups, is
only partially reflected in public health and clinical
research. For example the RE-AIM framework is
designed to guide the implementation of behaviour
change interventions [17]. It recommends assessing both
an intervention’s effectiveness and ability to reach a
tar-geted group. Similarly, recent CONSORT (2010)
guide-lines [18] recommend clearly displaying the flow of
participants throughout a study. Despite identifying
recruitment as part of their framework, the guidelines
do not define the actions needed to identify and recruit
potential populations of participants. There is an
absence of conceptual frameworks for recruitment to
intervention studies and also a lack of procedural
mod-els and systems for recruitment. There is a need to
iden-tify what factors are effective in engaging participation
at the recruitment phase [19-21].
Research examining recruitment practice has focused
on drug or medical interventions rather than public
health interventions [22]. Little is known about
recruit-ment to physical activity interventions. A Cochrane
review identified three stages of recruitment (invitation,
screening, intervention starting) for potential
partici-pants into physical activity randomised control trials
(RCTs). The authors noted a considerable loss of
parti-cipants across each stage limiting the effectiveness of
interventions [23]. The CONSORT (2010) guidelines,
suggest that studies report the number of eligible
parti-cipants prior to randomisation but do not insist on the
need to report the original overall number of responders
invited to participate (prior to eligibility) [18].
Clearly the effectiveness of a walking programme is
limited by not only its efficacy of dose (how well the
intervention works on its participants) but also by its
recruitment (maximising the numbers who will
partici-pate and receive the intervention dose). In response to
frequent research calls to evaluate effective approaches
to the recruitment of individuals to walking studies, the
Scottish Physical Activity Research Collaboration http://
www.sparcoll.org.uk undertook a series of studies to
examine recruitment strategies for research and
commu-nity based programmes of walking promotion. We
defined recruitment for such walking studies or
pro-grammes as the process of inviting participation to a
formal activity including the invitation, informing and
facilitation of interested parties to take part in an
orga-nised study, activity or event. This paper reports the
results of a systematic review to examine the reported
recruitment procedures of walking studies, in order to
identify the characteristics of effective recruitment, and
the impact and differential effects of recruitment
strate-gies among particular population groups.
Method
Identification of studies
We used The Quality of Reporting of Meta-analysis
statement (QUOROM) to provide the structure for our
review [24]. We identified four possible sources of
potential studies, (i) electronic literature databases and
websites, (ii) grey literature from internet sources, (iii)
contact with experts to identify additional
“grey”
and
other literature, and (iv) snowballing from reference lists
of retrieved articles. In the first stage of the literature
search, titles and abstracts of identified articles were
checked for relevance. In the second stage, full-text
arti-cles were retrieved and considered for inclusion. In the
final stage, the reference lists of retrieved full-text
arti-cles were searched and additional artiarti-cles known to the
authors were assessed for possible inclusion. We
con-ducted a systematic search of electronic databases
including OVID MEDLINE, EMBASE, PsychINFO,
PubMed, Scopus, SIGLE and SPORTDiscus. We
searched a number of web based databases including
National Institute of Health and Clinical Excellence
(NICE), Effective Public Health Project (EPHP
Hamil-ton), Health Evidence Canada, and the Evidence for
Pol-icy and Practice Information and Co-ordinating Centre
(EPPI)). We conducted searches of internet sites of key
international walking promotion agencies including
Walk England, the Centers for Disease Control and
Pre-vention (CDC) and the World Health Organisation
(WHO).
different databases included combinations of the
follow-ing key words: (walk*) AND (recruit* OR participat* OR
market*). Articles published or accepted for publication
in refereed journals were considered for the review.
Articles reported in UK grey and web based literature
including any evidence of types of recruitment
approaches and strategies, any evidence of effectiveness,
economic costs, and evidence of any differential
response to recruitment approaches were also
consid-ered in the review. Conference proceedings and
abstracts were included if further searching of the
data-bases or contact with the author was able to retrieve a
full article from the study presented in the original piece
of literature. We sent emails to international experts,
identified in a previous systematic review on walking
promotion [10].
Criteria for study inclusion/exclusion
Titles, abstracts and reports were independently assessed
(by AM, CF and GB) for inclusion. Studies were
consid-ered to be eligible for inclusion according to the
follow-ing criteria: (i) participants were of any age and were
not trained athletes or sports students, (ii) studies of any
type including randomised controlled trials, controlled
before-and-after experimental or observational studies,
(iii) studies that examined the effects of an intervention
to encourage people to walk independently or in a
group setting, (iv) interventions of any kind and in any
field, whether targeted on individuals, communities,
set-tings, groups or whole populations, (v) details of
meth-ods of recruitment were reported or were retrievable
through correspondence with the authors, (vi)
qualita-tive studies that examined the experiences of the
partici-pants during recruitment and which aimed to assess the
effectiveness of the recruitment methods used, and (vii)
studies published in English.
Included studies were categorised by study design
using standardised criteria for quantitative experimental
or observational studies (e.g. RCT, non-Randomised
Control Trials (NRCT), before-and-after,
cross-sec-tional), or qualitative studies (e.g. focus groups) [25].
Criteria for assessment of study quality in relation to
recruitment
Two authors (GB and CF) independently assessed the
quality of the studies in relation to recruitment
descrip-tion that met the inclusion criteria. The criteria for
assessing the recruitment reporting quality of each study
were adapted from Jadad (1998) [26], and in
consulta-tion with experts. A formal quality score for each study
was completed on a 5-point scale by assigning a value
of 0 (absent or inadequately described) or 1 (explicitly
described and present) to each of the following
ques-tions listed: (i) did the study report where the
population was recruited? (ii) did the study report who
conducted the recruitment? (iii) did the study report the
time spent planning/preparing the recruitment? (iv) did
the study report the time spent conducting the
recruit-ment? (v) did the study target a specific population?
Stu-dies that scored 4-5 were considered as high quality
studies while studies that scored 1-3 were considered
low quality.
Criteria for assessing efficiency and effectiveness
Where possible we calculated recruitment rates and
effi-ciency ratios for each study, based on a previous
sys-tematic review of interventions to promote physical
activity [23]. We defined four terms, (i)
“pool"-the total
number of potential participants who could be eligible
for study, (ii)
“invited"-the total number of potential
par-ticipants invited to participate in the study, (iii)
“responded"-the total number of potential participants
who responded to the invitation, (iv)
“started"-the
num-ber of participants who were assessed as eligible to
par-ticipate and began the programme. If data were
reported we calculated ratios for each stage, e.g. started/
pool-by dividing the number of participants who started
into the study by the total reported in the pool, and
expressed as proportions. If possible we attempted to
calculate a weekly rate of recruitment for those studies
on the number of weeks/months spent recruiting per
participant.
Results
Study Characteristics
[57,69], with one paper reporting qualitative data as
part of an RCT study [64]. No studies were located
from grey literature sources.
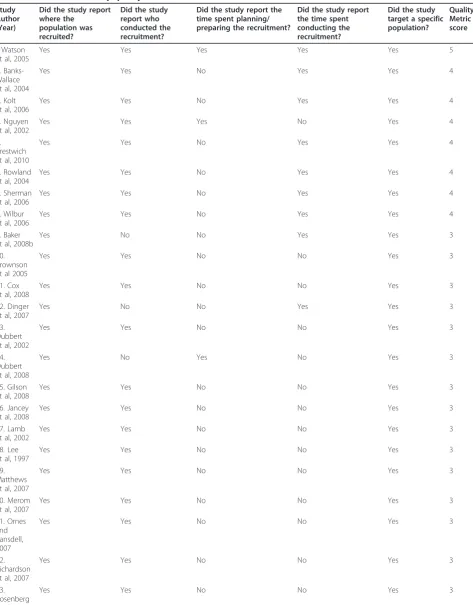
Overview of study quality in relation to recruitment
Eight studies were classified as
“high”
quality
[27-30,51,62,69,72] and the remaining thirty nine classified
as
“low”
quality in relation to recruitment description
(Table 2-Assessment of study quality). Forty five studies
reported a setting where the recruitment of participants
took place [27-49,51-67,69-73] but only twenty two
reported
who
conducted
the
recruitment
[27-31,33,35-40,45,51-54,62,64,65,69,72]. Eleven studies
reported the time spent conducting their recruitment
[27-30,32,51,62,63,66,70,72] three studies reported the
time spent planning/preparing recruitment [34,51,69].
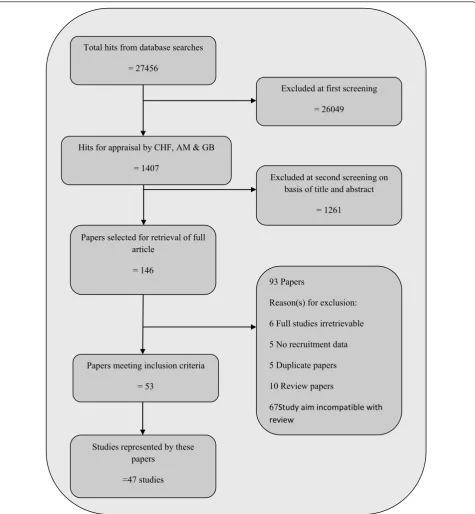
Excluded at first screening
= 26049
Excluded at second screening on
basis of title and abstract
= 1261
Total hits from database searches
= 27456
Papers meeting inclusion criteria
= 53
93 Papers
Reason(s) for exclusion:
6 Full studies irretrievable
5 No recruitment data
5 Duplicate papers
10 Review papers
67
Study aim incompatible with
review
Hits for appraisal by CHF, AM & GB
= 1407
Papers selected for retrieval of full
article
= 146
Studies represented by these
papers
[image:4.595.61.537.88.603.2]=47 studies
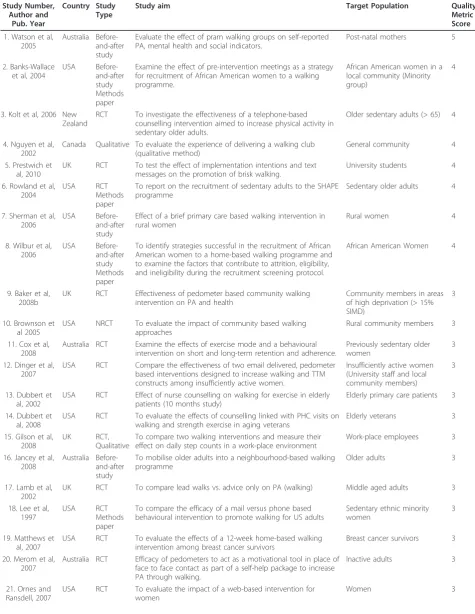
Table 1 Characteristics of included studies
Study Number, Author and
Pub. Year
Country Study Type
Study aim Target Population Quality
Metric Score
1. Watson et al, 2005
Australia Before-and-after study
Evaluate the effect of pram walking groups on self-reported PA, mental health and social indicators.
Post-natal mothers 5
2. Banks-Wallace et al, 2004
USA
Before-and-after study Methods paper
Examine the effect of pre-intervention meetings as a strategy for recruitment of African American women to a walking programme.
African American women in a local community (Minority group)
4
3. Kolt et al, 2006 New Zealand
RCT To investigate the effectiveness of a telephone-based
counselling intervention aimed to increase physical activity in sedentary older adults.
Older sedentary adults (> 65) 4
4. Nguyen et al, 2002
Canada Qualitative To evaluate the experience of delivering a walking club (qualitative method)
General community 4
5. Prestwich et al, 2010
UK RCT To test the effect of implementation intentions and text
messages on the promotion of brisk walking.
University students 4
6. Rowland et al, 2004
USA RCT
Methods paper
To report on the recruitment of sedentary adults to the SHAPE programme
Sedentary older adults 4
7. Sherman et al, 2006
USA
Before-and-after study
Effect of a brief primary care based walking intervention in rural women
Rural women 4
8. Wilbur et al, 2006
USA
Before-and-after study Methods paper
To identify strategies successful in the recruitment of African American women to a home-based walking programme and to examine the factors that contribute to attrition, eligibility, and ineligibility during the recruitment screening protocol.
African American Women 4
9. Baker et al, 2008b
UK RCT Effectiveness of pedometer based community walking
intervention on PA and health
Community members in areas of high deprivation (> 15% SIMD)
3
10. Brownson et al 2005
USA NRCT To evaluate the impact of community based walking
approaches
Rural community members 3
11. Cox et al, 2008
Australia RCT Examine the effects of exercise mode and a behavioural
intervention on short and long-term retention and adherence.
Previously sedentary older women
3
12. Dinger et al, 2007
USA RCT Compare the effectiveness of two email delivered, pedometer
based interventions designed to increase walking and TTM constructs among insufficiently active women.
Insufficiently active women (University staff and local community members)
3
13. Dubbert et al, 2002
USA RCT Effect of nurse counselling on walking for exercise in elderly
patients (10 months study)
Elderly primary care patients 3
14. Dubbert et al, 2008
USA RCT To evaluate the effects of counselling linked with PHC visits on
walking and strength exercise in aging veterans
Elderly veterans 3
15. Gilson et al, 2008
UK RCT,
Qualitative
To compare two walking interventions and measure their effect on daily step counts in a work-place environment
Work-place employees 3
16. Jancey et al, 2008
Australia Before-and-after study
To mobilise older adults into a neighbourhood-based walking programme
Older adults 3
17. Lamb et al, 2002
UK RCT To compare lead walks vs. advice only on PA (walking) Middle aged adults 3
18. Lee et al, 1997
USA RCT
Methods paper
To compare the efficacy of a mail versus phone based behavioural intervention to promote walking for US adults
Sedentary ethnic minority women
3
19. Matthews et al, 2007
USA RCT To evaluate the effects of a 12-week home-based walking
intervention among breast cancer survivors
Breast cancer survivors 3
20. Merom et al, 2007
Australia RCT Efficacy of pedometers to act as a motivational tool in place of face to face contact as part of a self-help package to increase PA through walking.
Inactive adults 3
21. Ornes and Ransdell, 2007
USA RCT To evaluate the impact of a web-based intervention for
women
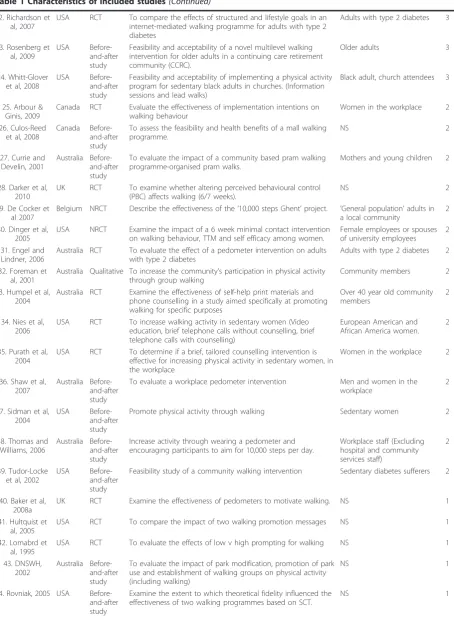
Table 1 Characteristics of included studies
(Continued)
22. Richardson et al, 2007
USA RCT To compare the effects of structured and lifestyle goals in an
internet-mediated walking programme for adults with type 2 diabetes
Adults with type 2 diabetes 3
23. Rosenberg et al, 2009
USA
Before-and-after study
Feasibility and acceptability of a novel multilevel walking intervention for older adults in a continuing care retirement community (CCRC).
Older adults 3
24. Whitt-Glover et al, 2008
USA
Before-and-after study
Feasibility and acceptability of implementing a physical activity program for sedentary black adults in churches. (Information sessions and lead walks)
Black adult, church attendees 3
25. Arbour & Ginis, 2009
Canada RCT Evaluate the effectiveness of implementation intentions on
walking behaviour
Women in the workplace 2
26. Culos-Reed et al, 2008
Canada
Before-and-after study
To assess the feasibility and health benefits of a mall walking programme.
NS 2
27. Currie and Develin, 2001
Australia Before-and-after study
To evaluate the impact of a community based pram walking programme-organised pram walks.
Mothers and young children 2
28. Darker et al, 2010
UK RCT To examine whether altering perceived behavioural control
(PBC) affects walking (6/7 weeks).
NS 2
29. De Cocker et al 2007
Belgium NRCT Describe the effectiveness of the‘10,000 steps Ghent’project. ’General population’adults in a local community
2
30. Dinger et al, 2005
USA NRCT Examine the impact of a 6 week minimal contact intervention
on walking behaviour, TTM and self efficacy among women.
Female employees or spouses of university employees
2
31. Engel and Lindner, 2006
Australia RCT To evaluate the effect of a pedometer intervention on adults
with type 2 diabetes
Adults with type 2 diabetes 2
32. Foreman et al, 2001
Australia Qualitative To increase the community’s participation in physical activity through group walking
Community members 2
33. Humpel et al, 2004
Australia RCT Examine the effectiveness of self-help print materials and phone counselling in a study aimed specifically at promoting walking for specific purposes
Over 40 year old community members
2
34. Nies et al, 2006
USA RCT To increase walking activity in sedentary women (Video
education, brief telephone calls without counselling, brief telephone calls with counselling)
European American and African America women.
2
35. Purath et al, 2004
USA RCT To determine if a brief, tailored counselling intervention is
effective for increasing physical activity in sedentary women, in the workplace
Women in the workplace 2
36. Shaw et al, 2007
Australia Before-and-after study
To evaluate a workplace pedometer intervention Men and women in the
workplace
2
37. Sidman et al, 2004
USA
Before-and-after study
Promote physical activity through walking Sedentary women 2
38. Thomas and Williams, 2006
Australia Before-and-after study
Increase activity through wearing a pedometer and encouraging participants to aim for 10,000 steps per day.
Workplace staff (Excluding hospital and community services staff)
2
39. Tudor-Locke et al, 2002
USA
Before-and-after study
Feasibility study of a community walking intervention Sedentary diabetes sufferers 2
40. Baker et al, 2008a
UK RCT Examine the effectiveness of pedometers to motivate walking. NS 1
41. Hultquist et al, 2005
USA RCT To compare the impact of two walking promotion messages NS 1
42. Lomabrd et al, 1995
USA RCT To evaluate the effects of low v high prompting for walking NS 1
43. DNSWH, 2002
Australia Before-and-after study
To evaluate the impact of park modification, promotion of park use and establishment of walking groups on physical activity (including walking)
NS 1
44. Rovniak, 2005 USA
Before-and-after study
Examine the extent to which theoretical fidelity influenced the effectiveness of two walking programmes based on SCT.
Forty
studies
reported
a
target
population
[27-45,48,50-60,62-65,68-70,72,73].
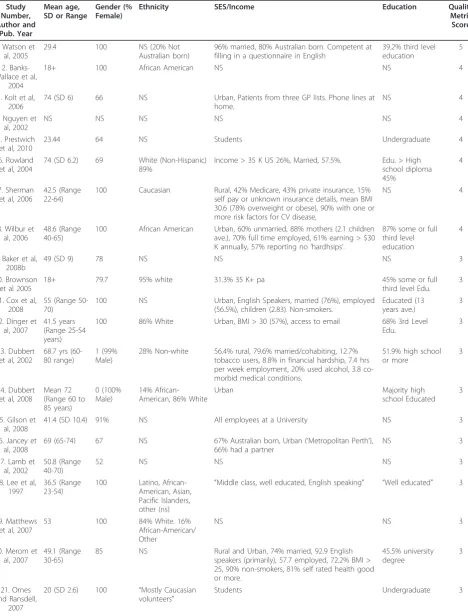
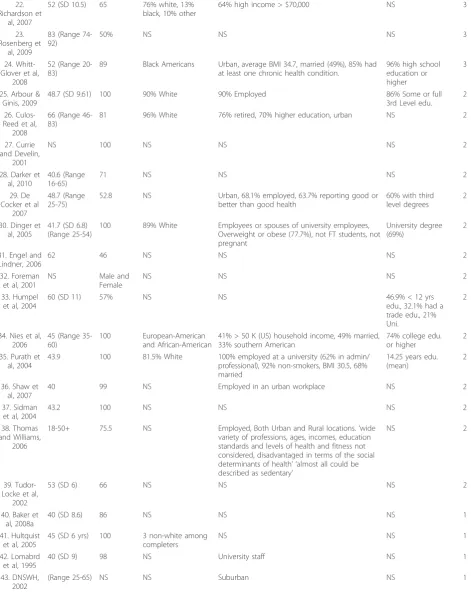
Characteristics of the participants
Thirty seven studies reported participant ages
[28-30,32-47,49,51-54,56,58,59,62-67,70-73] with a mean
age of 50.6 years, (SD ± 8.1 years), and a range of 18 to
92 years (Table 3-Characteristics of participants).
Six-teen out of forty two studies that reported gender data
focused on recruiting female only participants
[27,29,30,32,35-37,41-44,46,51,52,55,68,70], with one
study recruiting men only [34]. From the remaining
twenty five studies that did not recruit sex specific
groups, 70% (SD ± 20.8) of participants were female.
Twenty two studies reported data on nationality and
ethnicity, of which seventeen reported descriptive
statis-tics for ethnicity or race [27-38,40-42,46,49,51,
54,58,68,70,71]. Three studies reported targeting one
specific ethnic group, African-Americans [27,30,40]. Of
the remaining studies, twelve reported other ethnicity
data; 87% of these participants were white Caucasian
[28,31-34,36,38,41,43,49,70,71]. Additional
socio-demo-graphic data (SES or income groups, education, urban/
rural living and relationship status) were reported but
not consistently across all studies. Seven studies
reported data on participant’s income level data, which
tended to be higher than average [28,30,31,38,42,49,68].
Sample sizes of the studies ranged from 9 to 1674
participants.
Recruitment data reported
Two studies reported all data for all components of
recruitment, i.e. where recruitment took place; who
con-ducted the recruitment; the time taken to conduct the
planning/preparing and delivery stages [27,51]. Thirty
nine studies did report a specified target group (Table
4-Recruitment planning/preparing and implementation).
Forty four studies provide some details of where
recruit-ment was conducted [27-49,51-56,58-67,69-73] but the
recruitment location was often given vague descriptions,
for example
“in the community”. Most popular were
medical/care settings (n = 12) [29-31,33,34,36,
38,43,49,51,55,63] or universities (n = 9) [37,40,41,43,44,
46,47,62,70]. Other community settings included for
example, places of worship [67], hair salons [29], food
establishments [29,71] or specific events within such
set-tings, for example meetings for new mothers [51].
Twenty one studies reported who conducted the study
recruitment. Most popular recruiters were research staff
[28,31,33,34,37,39,51,52,54,62,64,67,72], often with
assis-tance from health professionals like doctors or nurses
[29,33,51,65]. Five studies reported using a dedicated
“recruitment specialist”
[27,30,35,51,69]. Only three
stu-dies reported the time spent planning/preparing their
recruitment phases [34,51,69]. Eleven studies reported
the
time
spent
on
implementing
recruitment
[27-30,32,51,62,63,71,72] and this averaged as 35 weeks,
with a range of 2 days to 56 weeks.
Recruitment procedures and approaches
The reporting of recruitment methods was often sparse
and unstructured (Table 5-Number of methods and types
of recruitment procedures). Forty five studies provided
data on the number of recruitment methods used (mean
2.7, SD 1.97). Sixteen studies relied on one method of
recruitment
only
[33,34,43-45,50-53,56,58,60,62,
64,65,72], and 26 studies used between two and four
methods [27-32,35-41,54,55,63,66,69-71,73]. We
identi-fied two types of recruitment approaches, (i) active
approaches; a recruitment method that requires those
conducting the study to make the first contact with a
participant (e.g. phone calls, face to face invitation, word
of mouth, referrals), (ii) passive approaches; a
recruit-ment method that requires a potential participant makes
the first contact with the study (e.g. posters, leaflets
drops, newspaper advertisements, mail outs). We did not
observe any relationship between the quality of
recruit-ment reporting and the number of recruitrecruit-ment strategies
used. We did however observe that a number of studies
used only passive techniques (n = 21) [32,34,38,41,42,44,
46-48,52,54,56,58-62,64,66,67,70], some used a mixture
of active and passive techniques (n = 22) [27-31,33,35-37,
39,40,49,53,55,57,63,65,68,69,71-73] and a small number
used solely active only methods (n = 4) [43,45,50,51].
[image:7.595.56.540.103.186.2]Passive recruitment methods, which require no
inter-action with the potential participants, were popular
(Fig-ure 2). Flyers/posters/advertisements/mail drops were
the most cited approach used, appearing in 31 studies.
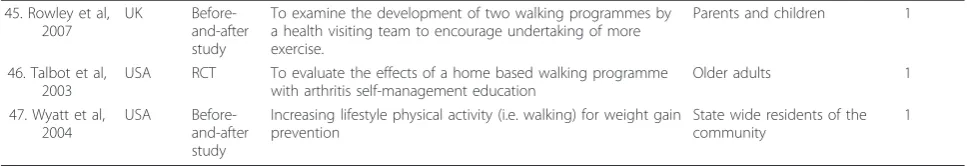
Table 1 Characteristics of included studies
(Continued)
45. Rowley et al, 2007
UK
Before-and-after study
To examine the development of two walking programmes by a health visiting team to encourage undertaking of more exercise.
Parents and children 1
46. Talbot et al, 2003
USA RCT To evaluate the effects of a home based walking programme
with arthritis self-management education
Older adults 1
47. Wyatt et al, 2004
USA
Before-and-after study
Increasing lifestyle physical activity (i.e. walking) for weight gain prevention
State wide residents of the community
Table 2 Assessment of study quality
Study Author (Year)
Did the study report where the
population was recruited?
Did the study report who conducted the recruitment?
Did the study report the time spent planning/ preparing the recruitment?
Did the study report the time spent conducting the recruitment?
Did the study target a specific population?
Quality Metric score
l. Watson et al, 2005
Yes Yes Yes Yes Yes 5
2. Banks-Wallace et al, 2004
Yes Yes No Yes Yes 4
3. Kolt et al, 2006
Yes Yes No Yes Yes 4
4. Nguyen et al, 2002
Yes Yes Yes No Yes 4
5. Prestwich et al, 2010
Yes Yes No Yes Yes 4
6. Rowland et al, 2004
Yes Yes No Yes Yes 4
7. Sherman et al, 2006
Yes Yes No Yes Yes 4
8. Wilbur et al, 2006
Yes Yes No Yes Yes 4
9. Baker et al, 2008b
Yes No No Yes Yes 3
10. Brownson et al 2005
Yes Yes No No Yes 3
11. Cox et al, 2008
Yes Yes No No Yes 3
12. Dinger et al, 2007
Yes No No Yes Yes 3
13. Dubbert et al, 2002
Yes Yes No No Yes 3
14. Dubbert et al, 2008
Yes No Yes No Yes 3
15. Gilson et al, 2008
Yes Yes No No Yes 3
16. Jancey et al, 2008
Yes Yes No No Yes 3
17. Lamb et al, 2002
Yes Yes No No Yes 3
18. Lee et al, 1997
Yes Yes No No Yes 3
19. Matthews et al, 2007
Yes Yes No No Yes 3
20. Merom et al, 2007
Yes Yes No No Yes 3
21. Ornes and Ransdell, 2007
Yes Yes No No Yes 3
22. Richardson et al, 2007
Yes Yes No No Yes 3
23. Rosenberg et al, 2009
Table 2 Assessment of study quality
(Continued)
24. Whitt-Glover et al, 2008
Yes Yes No No Yes 3
25. Arbour & Ginis, 2009
Yes No No No Yes 2
26. Culos-Reed et al, 2008
Yes No No Yes No 2
27. Currie and Develin, 2001
Yes No No No Yes 2
28. Darker et al, 2010
Yes No No Yes No 2
29. De Cocker et al 2007
Yes No No No Yes 2
30. Dinger et al, 2005
Yes No No No Yes 2
31. Engel and Lindner, 2006
Yes No No No Yes 2
32. Humpel et al, 2004
Yes No No No Yes 2
33. Nies et al, 2006
Yes No No No Yes 2
34. Purath et al, 2004
Yes No No No Yes 2
35. Shaw et al, 2007
Yes No No No Yes 2
36. Sidman et al, 2004
Yes No No No Yes 2
37. Thomas and Williams, 2006
Yes No No No Yes 2
38. Tudor-Locke et al, 2002
Yes No No No Yes 2
39. Foreman et al, 2001
No Yes No No Yes 2
40. Baker et al, 2008a
Yes No No No No 1
41. Hultquist et al, 2005
Yes No No No No 1
42. Lomabrd et al, 1995
Yes No No No No 1
43. DNSWH, 2002
Yes No No No No 1
44. Rovniak, 2005
Yes No No No No 1
45. Rowley et al, 2007
No No No No Yes 1
46. Talbot et al, 2003
This was almost twice as prevalent as the second most
popular approach, newsletters/newspaper articles (n =
18) and was nearly three times more frequently used
than word of mouth. Word of mouth appeared in 12
studies, but we were unable to identify whether this was
a proactive recruitment strategy or a reactive strategy,
responding to low recruitment numbers. Less popular
methods included medical and health insurance referral,
invitations derived from clinical or employment data,
study information sessions, resident listings,
announce-ments at group meetings or community events and
information stands.
Locations for recruitment, interventions and target
populations
Table 6 presents data on the setting and location of
recruitment and the study. We observed some studies
that
“
matched
”
where the recruitment was conducted
with where the intervention was delivered. Culos-Reed
et al, 2008 reported recruiting participants for a mall
walking study at the mall where the intervention was
going to be delivered [71]. Other studies did not match
in this way, and recruited in many different locations,
often relying on print material alone, and requiring
potential participants to attend a location which may
not be easily accessible to them. Studies reported that
they
were
“community-based”
(n
=
25)
[27-31,35,36,42,48-52,54-58,61,63,68,69,71-73] but asked
community members to travel into a research setting to
begin the process of participation; for example medical
centres
or
universities
(n
=
20)
[29,30,33-38,41,43,46,47,49,56,62-67]. These
interven-tions used a mixture of recruitment approaches
includ-ing media events and led walkinclud-ing groups, face to face
interventions (e.g. counselling, pedometers) or mediated
interventions, such as internet, e-health and mobile
phone technology [74].
Recruitment rates and efficiencies
We originally planned to calculate recruitment rates and
efficiency ratios for each study but we were unable to
do so due to missing data (Table 7-Recruitment rates
and efficiency ratios). Only three studies provided all the
data points [33,36,65]. We were able to calculate a
weekly recruitment rate using the final numbers of
par-ticipants divided by the time spent recruiting in weeks
for eleven studies (mean 38 participants per week, range
1 to 268 participants per week). We were not able to
see any pattern between recruitment approaches and
weekly rates. Two studies reported some data on the
efforts needed to undertake recruitment. Jancey et al
(2008) reported that after potential participants had
received invitation cards it took approximately 9 calls to
recruit one participant [53].
Developing Recruitment Approaches
We identified factors that may have helped or hindered
recruitment from qualitative [57,64,69] and protocol
[27,28,30,35] papers. These factors emerged as possible
principles of recruitment and were related to training,
engaging possible participants in the recruitment
pro-cess and allowing sufficient time to pilot-test
approaches. Watson et al (2009) used trained post-natal
health care staff to actively recruit participants during
their first home and health centres visits, and at group
meetings for new mothers [51]. Recruitment approaches
used by Banks-Wallace et al (2004) were based on a 5
month needs assessment study of the concerns and
priorities of their target group [27]. The authors
reported this process established trust between the
research team and participants and ensured active
parti-cipation in the study and in fact over-recruited from
this population. Nguyen et al (2002) reported promoting
participation via word of mouth, e.g. one participant
tells/recruits another participant [69]. These appeared to
have more impact on recruitment than passive
approaches like posters or media stories [69]. These
data suggest that developing recruitment approaches is a
time and resource intensive activity, requiring skilled
research and recruitment staff.
Discussion
We conducted a systematic review to examine the
reported recruitment procedures of walking studies, in
order to identify the characteristics of effective
ment and the impact and differential effects of
recruit-ment strategies among particular population groups. We
identified the need for a common understanding of the
recruitment process for walking studies in terms of
con-ceptual definition, defining effectiveness and more
detailed reporting. Due to the heterogeneity of studies
we were not able to identify what specific recruitment
approaches were most successful with particular
popula-tion groups.
[image:10.595.55.545.102.138.2]We identified eighteen recruitment strategies from 47
studies but did not see any relationship between one
Table 2 Assessment of study quality
(Continued)
47. Wyatt et al, 2004
No No No No Yes 1
Table 3 Characteristics of participants
Study Number, Author and
Pub. Year
Mean age, SD or Range
Gender (% Female)
Ethnicity SES/Income Education Quality
Metric Score
l. Watson et al, 2005
29.4 100 NS (20% Not
Australian born)
96% married, 80% Australian born. Competent at filling in a questionnaire in English
39.2% third level education
5
2. Banks-Wallace et al,
2004
18+ 100 African American NS NS 4
3. Kolt et al, 2006
74 (SD 6) 66 NS Urban, Patients from three GP lists. Phone lines at
home.
NS 4
4. Nguyen et al, 2002
NS NS NS NS NS 4
5. Prestwich et al, 2010
23.44 64 NS Students Undergraduate 4
6. Rowland et al, 2004
74 (SD 6.2) 69 White (Non-Hispanic)
89%
Income > 35 K US 26%, Married, 57.5%. Edu. > High
school diploma 45%
4
7. Sherman et al, 2006
42.5 (Range 22-64)
100 Caucasian Rural, 42% Medicare, 43% private insurance, 15%
self pay or unknown insurance details, mean BMI 30.6 (78% overweight or obese), 90% with one or more risk factors for CV disease,
NS 4
8. Wilbur et al, 2006
48.6 (Range 40-65)
100 African American Urban, 60% unmarried, 88% mothers (2.1 children
ave.), 70% full time employed, 61% earning > $30 K annually, 57% reporting no‘hardhsips’.
87% some or full third level education
4
9. Baker et al, 2008b
49 (SD 9) 78 NS NS NS 3
10. Brownson et al 2005
18+ 79.7 95% white 31.3% 35 K+ pa 45% some or full
third level Edu. 3
11. Cox et al, 2008
55 (Range 50-70)
100 NS Urban, English Speakers, married (76%), employed
(56.5%), children (2.83). Non-smokers.
Educated (13 years ave.)
3
12. Dinger et al, 2007
41.5 years (Range 25-54 years)
100 86% White Urban, BMI > 30 (57%), access to email 68% 3rd Level
Edu.
3
13. Dubbert et al, 2002
68.7 yrs (60-80 range)
1 (99% Male)
28% Non-white 56.4% rural, 79.6% married/cohabiting, 12.7%
tobacco users, 8.8% in financial hardship, 7.4 hrs per week employment, 20% used alcohol, 3.8 co-morbid medical conditions.
51.9% high school or more
3
14. Dubbert et al, 2008
Mean 72 (Range 60 to 85 years)
0 (100% Male)
14% African-American, 86% White
Urban Majority high
school Educated 3
15. Gilson et al, 2008
41.4 (SD 10.4) 91% NS All employees at a University NS 3
16. Jancey et al, 2008
69 (65-74) 67 NS 67% Australian born, Urban (’Metropolitan Perth’),
66% had a partner
NS 3
17. Lamb et al, 2002
50.8 (Range 40-70)
52 NS NS NS 3
18. Lee et al, 1997
36.5 (Range 23-54)
100 Latino,
African-American, Asian, Pacific Islanders, other (ns)
“Middle class, well educated, English speaking” “Well educated” 3
19. Matthews et al, 2007
53 100 84% White. 16%
African-American/ Other
NS NS 3
20. Merom et al, 2007
49.1 (Range 30-65)
85 NS Rural and Urban, 74% married, 92.9 English
speakers (primarily), 57.7 employed, 72.2% BMI > 25, 90% non-smokers, 81% self rated health good or more.
45.5% university degree
3
21. Ornes and Ransdell,
2007
20 (SD 2.6) 100 “Mostly Caucasian
volunteers”
Table 3 Characteristics of participants
(Continued)
22. Richardson et
al, 2007
52 (SD 10.5) 65 76% white, 13%
black, 10% other
64% high income > $70,000 NS 3
23. Rosenberg et
al, 2009
83 (Range 74-92)
50% NS NS NS 3
24. Whitt-Glover et al,
2008
52 (Range 20-83)
89 Black Americans Urban, average BMI 34.7, married (49%), 85% had
at least one chronic health condition.
96% high school education or higher
3
25. Arbour & Ginis, 2009
48.7 (SD 9.61) 100 90% White 90% Employed 86% Some or full
3rd Level edu.
2
26. Culos-Reed et al, 2008
66 (Range 46-83)
81 96% White 76% retired, 70% higher education, urban NS 2
27. Currie and Develin,
2001
NS 100 NS NS NS 2
28. Darker et al, 2010
40.6 (Range 16-65)
71 NS NS NS 2
29. De Cocker et al
2007
48.7 (Range 25-75)
52.8 NS Urban, 68.1% employed, 63.7% reporting good or
better than good health
60% with third level degrees
2
30. Dinger et al, 2005
41.7 (SD 6.8) (Range 25-54)
100 89% White Employees or spouses of university employees,
Overweight or obese (77.7%), not FT students, not pregnant
University degree (69%)
2
31. Engel and Lindner, 2006
62 46 NS NS NS 2
32. Foreman et al, 2001
NS Male and
Female
NS NS NS 2
33. Humpel et al, 2004
60 (SD 11) 57% NS NS 46.9% < 12 yrs
edu., 32.1% had a trade edu., 21% Uni.
2
34. Nies et al, 2006
45 (Range 35-60)
100 European-American
and African-American
41% > 50 K (US) household income, 49% married, 33% southern American
74% college edu. or higher
2
35. Purath et al, 2004
43.9 100 81.5% White 100% employed at a university (62% in admin/
professional), 92% non-smokers, BMI 30.5, 68% married
14.25 years edu. (mean)
2
36. Shaw et al, 2007
40 99 NS Employed in an urban workplace NS 2
37. Sidman et al, 2004
43.2 100 NS NS NS 2
38. Thomas and Williams,
2006
18-50+ 75.5 NS Employed, Both Urban and Rural locations.‘wide
variety of professions, ages, incomes, education standards and levels of health and fitness not considered, disadvantaged in terms of the social determinants of health’ ‘almost all could be described as sedentary’
NS 2
39. Tudor-Locke et al,
2002
53 (SD 6) 66 NS NS NS 2
40. Baker et al, 2008a
40 (SD 8.6) 86 NS NS NS 1
41. Hultquist et al, 2005
45 (SD 6 yrs) 100 3 non-white among
completers
NS NS 1
42. Lomabrd et al, 1995
40 (SD 9) 98 NS University staff NS 1
43. DNSWH, 2002
particular strategy or group of strategies and
recruit-ment rates. Many studies blended different recruitrecruit-ment
approaches and strategies, adopting an almost
“trial and
error”
approach. Only two studies reported the
effective-ness of their approaches to recruitment [28,35]. We
were able to distinguish active and passive recruitment
approaches. Further research is needed to directly
com-pare specific recruitment strategies.
Very few studies examined the successes of
recruit-ment approaches to physical activity interventions.
Har-ris et al (2008) conducted a randomized controlled trial
of four recruitment strategies in their physical activity
promotion intervention study for older adults [75]. The
authors reported that telephone follow up a week post
invitation significantly increased recruitment compared
to invitation only. Certainly the principle of follow up
was found in a number of our included studies
[53,63,72] but we could not assess the efficacy of these
strategies. The efficacy of phone recruitment has been
questioned by Margitic et al (1999) [76] who compared
three recruitment strategies for Project ACT: patient
mailings, office-based questionnaires and telephone
con-tact. However their participants were not randomized to
a particular strategy. The authors also reported that
despite telephone recruitment appearing to be
produc-tive this strategy was dropped in two out of eight
recruitment sites on cost grounds. This behavioural
approach of using phone follow up has previously been
reported to be more effective than no follow up in
chan-ging physical activity and walking behaviour [10,23] and
certainly warrants further testing in terms of a possible
recruitment strategy.
Tai and Iliffe’s (2000) experiences of conducting
physi-cal activity studies also support our observation that
piloting and pre-testing of recruitment methods would
improve rates of recruitment and precision in recruiting
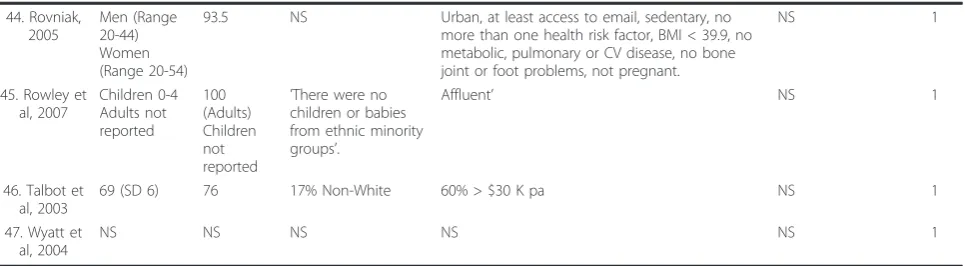
specific target groups [77]. Our review clearly shows
that current recruitment strategies resulted in recruiting
mostly white, well-educated, middle aged women. The
attraction of walking projects to particular social groups
has also been reported in previous evaluation studies of
community walking programmes both in the UK [78]
and USA [27,31]. Our review found that recruitment
rates were poorer for men, especially within workplace
or community settings but we were unable to determine
if it is a fault of the recruitment, or the offer of walking
or a combination of both that is at fault.
We identified a number of studies that
“
matched
”
where the recruitment was conducted, with where the
intervention was delivered. This principle supports the
notion that connecting the place of recruitment and
intervention may be more efficient both for the
partici-pants, recruiters and interventions teams. We found
stu-dies that did not effectively match these aspects and
perhaps this was reflected in the total number of
partici-pants recruited and the longer time it took to conduct
their recruitment phase. For example, Baker et al (2008)
reported that participants were expected to travel to the
university to receive their intervention. We found little
data on the time spent planning/preparing and
imple-menting recruitment so any potential learning from
recruitment remains unreported [63].
[image:13.595.57.540.101.234.2]We identified a number of studies that also aimed to
match those recruiting with those being recruited.
Banks-Wallace et al (2004) reported in detail their use
of a recruitment mediator [27]. The mediator was the
same gender as the target group, was a prominent local
figure, trained in delivering community interventions
and female. Her role was to introduce the study to key
significant figures in the area and increase awareness, to
assist directly with the recruitment phase and to
intro-duce the researchers to the potential participants at an
information session. Banks-Wallace et al (2004)
described this approach as increasing trust and
decreas-ing differences between the recruiters and recruited [27].
Our review clearly found there was very little
consis-tency in the definition or reporting of recruitment. We
found many different interpretations of (i) what is the
recruitment process? and (ii) what is an appropriate
metric for evaluating the effectiveness of recruitment?
Table 3 Characteristics of participants
(Continued)
44. Rovniak, 2005
Men (Range 20-44) Women (Range 20-54)
93.5 NS Urban, at least access to email, sedentary, no
more than one health risk factor, BMI < 39.9, no metabolic, pulmonary or CV disease, no bone joint or foot problems, not pregnant.
NS 1
45. Rowley et al, 2007
Children 0-4 Adults not reported
100 (Adults) Children not reported
’There were no children or babies from ethnic minority groups’.
Affluent’ NS 1
46. Talbot et al, 2003
69 (SD 6) 76 17% Non-White 60% > $30 K pa NS 1
47. Wyatt et al, 2004
Table 4 Recruitment planning and implementation (Quality Metric categories)
Study Author (Year)
Where did the Recruitment take place?
Who did the Recruitment? Time spent Planning/ Preparing recruitment
Time spent Executing recruitment (Weeks)
Population Targeted (Yes/No)?
Quality Metric score
l. Watson et al, 2005
Home, health centre visits, at mothers group meetings
Nurses trained in recruitment and research staff
1 month including all training of nurses and intervention by researchers to help with recruitment difficulties.
6 weeks Yes 5
2. Banks-Wallace et al, 2004
In the community at venues typically used for hosting African American community events
Recruitment Protocol Specialist NS 21.6 weeks Yes 4
3. Kolt et al, 2006
By mail and a follow up home visit
Researchers NS 39 weeks Yes 4
4. Nguyen et al, 2002
Mainly passively in the community but also used press conferences and info/taster sessions
Public health official 3 years (Rolling
development)
NS Yes 4
5. Prestwich et al, 2010
University Researchers NS 2.5 weeks Yes 4
6. Rowland et al, 2004
Via telephone, direct mail and then at multiple locations and media in the community
Research team members NS 43.3 weeks Yes 4
7. Sherman et al, 2006
In a clinic, hair salons-and food establishments
Nurses NS 0.28 weeks Yes 4
8. Wilbur et al, 2006
Two federally qualified
community health centres serving poor and working class urban populations. Screening and data collection was carried out here to reduce power differences (perceived) and increase trust. Concentrated on an area within a 3-mile radius of the data collection sites. Also interacted in the community at health fairs and presentations.
Team specifically set up to deliver the recruitment made up of AA female nurses, either living in the community or who had family ties to the community.
NS 121.3 weeks Yes 4
9. Baker et al, 2008b
Local community, GP surgeries, shops, community stalls
NS NS 21.6 months Yes 3
10. Brownson et al 2005
Through media, at physicians practices, at community centres, on walking routes, in the community active and passively
Community organisation staff, research staff, physicians
NS NS Yes 3
11. Cox et al, 2008
Ads delivered in the community. Screening took place at the community centre
Research assistants NS NS Yes 3
12. Dinger et al, 2007
Local media and electronically NS NS 4.3 weeks Yes 3
13. Dubbert et al, 2002
By mail, phone and at the clinic Researchers and Research Nurse NS NS Yes 3
14. Dubbert et al, 2008
Primary care medical centre as part of routine care
NS 2 to 3 years NS Yes 3
15. Gilson et al, 2008
Via work email Researchers NS NS Yes 3
16. Jancey et al, 2008
Over the phone to home phone numbers
Researchers NS NS Yes 3
17. Lamb et al, 2002
Via post, phone and info sessions at primary care setting
Researchers, via GP, and staff nurse
NS NS Yes 3
18. Lee et al, 1997
Directly and indirectly in the community
Female students trained in recruitment methods
Table 4 Recruitment planning and implementation (Quality Metric categories)
(Continued)
19. Matthews et al, 2007
Clinic Clinical staff NS NS Yes 3
20. Merom et al, 2007
Passively in the community and actively by phone via another study
Researchers in the NSW Health survey (recruitment by proxy) and researchers on this study
NS NS Yes 3
21. Ornes and Ransdell, 2007
University campus Researchers NS NS Yes 3
22. Richardson et al, 2007
Medical centre Physicians NS NS Yes 3
23. Rosenberg et al, 2009
Care community Researchers NS NS Yes 3
24. Arbour & Ginis, 2009
University and Local Community NS NS NS Yes 2
25. Baker et al, 2008a
University campus NS NS NS NS 2
26. Culos-Reed et al, 2008
In the community and at the malls
NS NS 2 weeks No 2
27. Currie and Develin, 2001
Places where pre and post natal mums engage with health care, shopping and school
NS NS NS Yes 2
28. Darker et al, 2010
In the local media (Passive) NS NS 30.3 weeks No 2
29. De Cocker et al 2007
By mail or phone to participants homes. Indirect but active
NS NS NS Yes 2
30. Dinger et al, 2005
University NS NS NS Yes 2
31. Engel and Lindner, 2006
In community via newspapers NS NS NS Yes 2
32. Foreman et al, 2001
NS Walk leaders and organisers NS NS Yes 2
33. Humpel et al, 2004
Via post. No face to face NS NS NS Yes 2
34. Nies et al, 2006
Through media and fliers in the community
NS NS NS Yes 2
35. Purath et al, 2004
Health screening day within a university
NS NS NS Yes 2
36. Shaw et al, 2007
Workplace (Health centre) NS NS NS Yes 2
37. Sidman et al, 2004
Two University campuses NS NS NS Yes 2
38. Thomas and Williams, 2006
Workplace (Electronically) NS NS NS Yes 2
39. Tudor-Locke et al, 2002
Diabetes Centre NS NS NS Yes 2
40. Whitt-Glover et al, 2008
The lack of conceptual clarity about recruitment as a
process is surprising and potentially impacts on
cost-effectiveness. The RE-AIM framework emphasises the
need to judge the success of an intervention from both
the reach and uptake of an intervention [79]. In light of
this we constructed a conceptual framework for our
review by defining the stages of recruitment and
poten-tial pool of participants (Figure 3). This framework
offers a starting point for further debate and refinement.
The framework offers a clear concept of the stages and
steps of recruitment and the chance to record the
num-bers of participants at each stage and action.
Our framework divided recruitment into two phases,
planning/preparing and implementation, with four
stages involving discrete actions by
researchers/recrui-ters, (i) identification of participant pools, (ii) invitation
and monitor response and uptake, (iii) assessment,
screening and facilitation and (iv) re-invitation of
responders, before the delivery of intervention to
star-ters. This framework highlights the actions needed at
the start of a recruitment process, i.e.
planning/prepar-ing the recruitment process. It also emphasises the
importance of the reach of an intervention i.e. the pool
of participants used to provide recruits. This differs
from the recent new CONSORT framework which asks
for dates of recruitment period (i.e. delivery) and
enrol-ment stage [18]. CONSORT stipulates data must be
reported for numbers of participants eligible for study
which we feel not only ignores the overall pool of
possi-ble participants, especially in community based studies
of walking interventions, but also ignores the population
deemed ineligible, as seen in pre-screenings of patient
lists for existing conditions [18]. The
“pool”
of
partici-pants perhaps provides a more realistic denominator for
assessing overall recruitment rates. This metric will
allow new studies to (i) consider if the recruitment was
efficient (i.e. study recruited expected numbers of
parti-cipants) and/or (ii) consider if it was effective (i.e. study
recruited the right target group), and/or (iii) reflect the
true costs of all recruitment actions within overall cost
benefit calculations. The need for better reporting of
recruitment actions and numbers is essential to improve
the assessment of present recruitment strategies. This
view is mirrored in recruitment studies of other health
behaviours, and better reporting must begin before we
can start to identify which strategies provide the best
recruitment rates [80].
The results of our review were limited to walking
intervention studies. We were limited by only including
studies written in the English language. We were limited
by what was reported in papers but our consistent
appli-cation of inclusion, quality and data extraction criteria
have illustrated the need for improvement in both the
reporting and science of recruitment. As journals look
to keep research reports within word limits, it is likely
that there will continue to be a lack of journal space to
report recruitment details, and we would like to call on
editors and authors to report recruitment details or
pro-vide short methods papers for the insight of future
researchers. As far as we are aware this review is the
first of its kind focusing on one domain of physical
activity behaviour. The lack of understanding and
stu-dies into recruitment may reflect some of the findings
about the existing weaknesses of the evidence base for
walking interventions, e.g. lack of generalisability of
interventions across different social groups [10].
[image:16.595.57.538.100.280.2]The evidence base for the benefits of walking is now
expanding but until it is clearer what strategies are
effective in both recruiting and initiating people to
begin walking, such benefits may be out of reach for
particular population groups. Practitioners would benefit
from the assurance of having an evidence based best
Table 4 Recruitment planning and implementation (Quality Metric categories)
(Continued)
41. Hultquist et al, 2005
University NS NS NS No 1
42. Lomabrd et al, 1995
University campus NS NS NS No 1
43. DNSWH, 2002
In local area via media and advertising and information
NS NS NS No 1
44. Rovniak, 2005
At multiple locations in the community. Mainly passive.
NS NS NS No 1
45. Rowley et al, 2007
NS NS NS NS Yes 1
46. Talbot et al, 2003
Senior centres, ads in local newspapers
NS NS NS NS 1
47. Wyatt et al, 2004
Table 5 Recruitment planning and implementation (Quality Metric categories)
Study Author (Year)
No. Of Methods Used
Procedures including who conducted the recruitment, where it took place and what was done
Active, passive or a mixture of approaches
Quality Metric Score
l. Watson et al, 2005
1 Nurse conducted face to face recruitment at clinics, mothers’group meetings
and home visits.
Active 5
2. Banks-Wallace et al, 2004
4 Researchers placed flyers in church bulletins and the community, health
practitioner referrals were generated, word of mouth was used and structured pre-intervention meetings took place.
Passive/Active 4
3. Kolt et al, 2006
1 A three phased and sequenced approach was conducted by the researchers,
the GP and staff nurse. An invitation letter was sent from the GP surgery a pre-paid response card for those expressing interest. Follow up screening calls then follow up visits to provide info and gain consent.
Passive/Active 4
4. Nguyen et al, 2002
3 A public health official co-ordinated the recruitment and used the local
media, network construction and face to face recruitment of volunteer walk leaders. Press conferences and promotional materials were sent to local media outlets, community health centres, libraries, senior’s club networks to promote the club. Leaflets on local community settings, ads in free newspapers, promotional messages placed on light panels around the city, community TV ads and features, press releases for local media, newsletters, press conference, celebration events. Comments elsewhere stated that face to face recruitment was the most successful for this study, but this was only used to recruit walk leaders.
Passive/Active 4
5. Prestwich et al, 2010
1 Researchers sent emails to the current students at their university. Course
credit or cash were used as an incentive.
Passive 4
6. Rowland et al, 2004
11 Computer assisted telephone interviews (CATI) was initially conducted by
researchers. A database of potential participants was screened for telephone numbers. If this was not successful in recruiting the sample size needed the direct mailing was used. Finally, to complete the sample size quota canvassing in the local community (including face to face, door to door, posters and flyers at churches and senior housing units, snowballing, utilising ‘community brokers’, and newspapers) was conducted. Recruitment was systematic, purposeful and carried out in the order described but was somewhat inequitable as the first screening criterion was the availability of a phone number. It also required significant community assistance to reach those harder to engage.
Active/Passive 4
7. Sherman et al, 2006
2 Active recruitment by a nurse at a health clinic, advertisements in hair salons
and food establishments. The paper states that the‘main source of recruitment came from advertisements in the community and word of mouth’.
Active/Passive 4
8. Wilbur et al, 2006
3 Researchers designed a flyer with community input and received advice on
where to place it. Emails and newspaper announcements were also used. Recruitment staff distributed print material at specified schools, churches, grocery shops, libraries, clinics, community agencies and community fairs and at 10 presentations in community agencies, clinics, and churches. Email announcement at local medical centre workplaces and an announcement in the community newspaper were used. A good aim of matching the invitation to the invitee and finding the best place to distribute it was a positive here. Unfortunately word of mouth wasn’t actively used or reported and only the research team recruitment staff acted as recruiters for face to face recruitment.
Passive/Active 4
9. Baker et al, 2008b
4 Mail drops were carried out and adverts were placed in local papers and
posters in GP surgeries and shops. Manned community stalls were also set up. This approach was modified and expanded throughout the recruitment phase as the researchers identified their lack of impact on the target group. However, the methods were mainly passive and not altered to be more engaging or mediating with the target group. It is not specifically stated who conducted the recruitment.
Passive/Active 3
10. Brownson et al 2005
8 Recruitment was initially by proxy during a baseline survey for another piece
of work (no details or what survey was). Awareness of the walking group was also promoted at community events, by physician recommendation, trail signage advertising and word or mouth. Recruitment methods were not explicitly reported but intervention communities used participatory approaches to develop their intervention options. Taster events, one off walks, clean up trail days, and 5 media events were held.
Passive/Active 3
11. Cox et al, 2008
Table 5 Recruitment planning and implementation (Quality Metric categories)
(Continued)
12. Dinger et al, 2007
3 Flyers were placed in the community, emails were sent to university staff and
a television advertisement was broadcast. It is not specifically stated who conducted the recruitment.
Passive 3
13. Dubbert et al, 2002
1 A three phased sequenced approach was used. Researchers and a research
nurse reviewed medical records. Potential participants were sent a letter and recruited during their scheduled visits with the primary health care providers or following an expression of interest. Nurses conducted a pre screening and financial compensation to offset costs of visits to the centre was provided.
Active/Passive 3
14. Dubbert et al, 2008
1 Participants were recruited via referral by primary care providers, but which
specific type of care provider was not reported. It is not specifically stated who conducted the recruitment.
Passive 3
15. Gilson et al, 2008
1 Researchers recruited participants via workplace email. Passive 3
16. Jancey et al, 2008
1 A two phased sequenced approach was used. Researchers marched electoral
roll lists against telephone directory lists to identify potential participants who owned phones. A preceding postcard informing the recruit about the study and the likelihood of a phone call to follow. Phone calls were then made by members of the research team and approximately 9 calls were required to recruit one participant.
Passive/Active 3
17. Lamb et al, 2002
1 A three phased sequenced approach was used. Researchers, assisted by staff
nurses sent an eligibility questionnaire to a randomly selected group from a GP client list (GP letters included). This was followed by a letter explaining the study to those expressing an interest and then a phone call to the responders to arrange which info session they could attend.
Passive/Active 3
18. Lee et al, 1997
4 Researchers and trained female students conducted telephone calls, face to
face approaches at supermarkets, direct mailing and flyers.
Passive/Active 3
19. Matthews et al, 2007
3 Clinical staff recruited women by letter and phone follow up in two health
centres. The paper also states that in another centre clinical populations were recruited, but this is not clearly explained. Women who were also past participants in a case control study and had agreed to take part in future research.
Active/Passive 3
20. Merom et al, 2007
3 Invitation by proxy during the NSW phone Health Survey. Researchers in this
study then produced a community based newspaper and sent intranet messages in the area health services (it is not clear what they meant by that).
Passive 3
21. Ornes and Ransdell, 2007
4 Researchers placed newspaper ads and posters on a university campus.
Researcher also visited classes on college campus and conducted face to face recruitment on campus.
Passive/Active 3
22. Richardson et al, 2007
3 Researchers placed adverts in a local newspaper and flyers at local hospital,
clinics, and other public locations. A listing was placed on a medical research recruitment site. Information and water bottles were given to potential participants and doctors to raise the profile of the study and encourage referrals from doctors.
Passive 3
23. Rosenberg et al, 2009
2 Researchers used flyers and information meetings. Passive/Active 3
24. Whitt-Glover et al, 2008
5 Pastors who attended luncheons regarding health promotion and disease
prevention strategies among African Americans were recruited to help introduce the intervention and aid recruitment of participants. Following this, researchers placed flyers in churches, bulletins in newsletters, announcements at Sunday services and held information meetings.
Active/Passive 3
25. Arbour & Ginis, 2009
2 Posters and internet ads were sent as part of an employee health
programme. It is not specifically stated who conducted the recruitment.
Passive 2
26. Culos-Reed et al, 2008
4 Posters, cards on food hall tables and two community newspapers were used
to circulate information. Three presentations were held at local health programme meetings. It is not stated who conducted the recruitment.
Passive/Active 2
27. Currie and Develin, 2001
4 Flyers were placed at the local maternity wards, doctors’surgeries, early
childhood centres, day care centres, immunization clinics, baby product stores and playgrounds. Adverts placed in school bulletins; local newspapers and also paid adverts in newspapers. Information sessions were conducted for new mothers in childhood centres. It is not specifically stated who conducted the recruitment.
Passive/Active 2
28. Darker et al, 2010
2 Adverts were placed in local newspapers. Radio interviews were conducted. It
is not specifically stated who conducted the recruitment.