City, University of London Institutional Repository
Citation
:
Slingsby, A., Strachan, J., Vidale, P., Dykes, J. and Wood, J. (2010). Making
hurricane track data accessible. Paper presented at the Discovery Exhibition at Visweek
2010, 24 - 29 October 2010, Salt Lake City, USA.
This is the unspecified version of the paper.
This version of the publication may differ from the final published
version.
Permanent repository link:
http://openaccess.city.ac.uk/3028/
Link to published version
:
Copyright and reuse:
City Research Online aims to make research
outputs of City, University of London available to a wider audience.
Copyright and Moral Rights remain with the author(s) and/or copyright
holders. URLs from City Research Online may be freely distributed and
linked to.
City Research Online:
http://openaccess.city.ac.uk/
[email protected]
Discovery Exhibition: Making Hurricane Track Data Accessible
Aidan Slingsby∗
City University London
Jane Strachan†
University of Reading
Pier-Luigi Vidale‡
University of Reading
Jason Dykes§
City University London
Jo Wood¶
City University London
ABSTRACT
Our interactive tool allows the exploration, validation and presen-tation of hundreds of years of dynamically simulated storm tracks. The tracks were generated as part of a research project to improve the risk assessment of tropical storm damage by the insurance in-dustry. The main impact of the tool is that exploratory interactive visualisation is now being used by the storm track modellers to
(a)validate and improve model outputs, (b)discuss outputs with their peers(c)obtain a better understanding of the formation and development of tropical storms and(d)present examples of the be-haviour of storms under different conditions to the insurance in-dustry and others. Insights into tropical storm behaviour have been obtained and these insights are being articulated.
Index Terms: H.5.1 [Information Systems]: Information systems applications—Multimedia information systems: animation; H.5.2 [Information Systems]: Information interfaces and presentation— User Interfaces: user-centered design;
1 INTRODUCTION
We are a team of climate scientists at the UK’s National Centre for Atmospheric Science (NCAS-Climate, University of Reading; Strachan and Vidale) and information visualisers at the giCentre (City University London; Slingsby, Dykes and Wood). Through the Willis Research Network – the worlds largest collaboration between academia and the insurance industry – we are working collabora-tively to develop visual techniques and lightweight tools to explore data and communicate information about atmospheric processes.
Climate modellers at NCAS-Climate are generating thousands of dynamically simulated storm tracks through multi-century global climate simulations using General Circulation Models (GCMs) that can now be run at resolutions which resolve information about in-dividual storms. Numerical techniques [1] are increasingly being used to help understand and simulate atmospheric processes. It is hoped that these will help generate more representative storm haz-ard event-sets than can be provided by observations alone. Haz-ard event-sets are a key component of catastrophe (CAT) models, important risk-assessment tools for helping insurance companies assess the financial impact of catastrophic natural events [2]. Cur-rently these event-sets are based on historical records that typically cover the last 50 years – too short to give a statistically significant representation of events, particularly for the rare extreme events that can lead to the most damage. More representative event sets may be produced using hundreds of years of dynamically simulated storm tracks, which – if adopted by the insurance industry and used along-side historical data – may lead to better assessments of risk.
∗e-mail: [email protected]
†e-mail: [email protected] ‡e-mail:[email protected] §e-mail: [email protected] ¶e-mail: [email protected]
The climate modellers in our team need to explore the sim-ulated storms produced by the numerical model simulations, for validation, discussion amongst peers and to obtain a deeper un-derstanding of how atmospheric processes affect storm behaviour. They need to present examples of storm behaviour and their likely insurance-related impacts to help improve the insurance industry’s understanding of how atmospheric conditions affect the distribu-tion, frequency and intensity of storms and the implications of this.
2 DATA AND REQUIREMENTS
A high-resolution GCM was run for hundreds of simulated years and a feature-tracking algorithm [3] was used to locate and follow storm-like features. Tropical storms were then extracted to build a dynamically simulated storm dataset. This is challenging to view in its entirety. It is global in coverage and spans several hundreds of years at multiple atmospheric levels. Yet individual events are a few hundred kilometres in size, short-lived and move rapidly, requir-ing a temporal granularity of a few hours. Wind speed, mean sea level pressure and storm rotation (vorticity) are provided at track points spaced at six-hourly intervals. The climate modellers em-phasised the need to explore storm tracks in their spatial context in narrow temporal windows, to enable track evolution to be assessed and clustering to be detected, both of which have important impli-cations for insurance risk management.
The climate modellers’ initial requirement was for a tool that could produce animated video clips of the simulated tracks to ac-company presentations given to wider audiences in science and the insurance industry. As the tool was being developed, the ex-ploratory research potential was quickly recognised by the climate modellers, and the designers responded by adding functionality to support this. Contrary to existing approaches used by the modellers for analysing the dataset, the tool allowed them to explore the for-mation and evolution of tracks without the need to imposea priori
assumptions on the dataset. Specific examples of the formation and evolution of tracks could be isolated, replayed, stored and used for discussion, further investigation and presentation of the responses of storms to seasonal and atmospheric conditions.
3 DESIGN
latitudes, but since the scale increases towards the poles, poleward-moving storms may appear to increase in speed. We plan to imple-ment other projections that can be changed on-demand suit the task at hand, e.g. a radial projection that gives constant radial scale from a point of interest.
Exploration of the data is achieved through the following modes of navigation:
• Start/stop animation: ‘play’ the tracks as an animation at a fine temporal resolution.
• Playback speed: slow down the animation to study key track behaviour in detail, e.g. observing a storm as it makes landfall.
• Time: quickly scan through the whole temporal sequence by moving the mouse over a timeline that spans the screen width.
• Temporal window: increase to study seasonal variation; de-crease to study tracks in their immediate temporal context.
• Vertical navigation: switch between the atmospheric levels to study the vertical structure of the storm.
• Pan/zoom: focus on particular regions of the globe or obtain a global overview.
• Individual track interrogation: move the mouse over sections of tracks to provide numerical detail.
• Video capture: capture examples for subsequent use. We preferred not to clutter the tool with a graphical user inter-face, but a clear and concise help screen describing how the tool is controlled (through the keyboard and mouse) appears when the tool it is launched and is available at all times. Users found this adequate to be able to use the tool with little or no additional training1.
4 IMPACT ON SIMULATED STORM DATABASE VALIDATION
The main impact of the tool was its demonstration of the value of exploratory interactive visualisation to the climate modellers in our team. The ability to scan through the whole dataset and explore the configuration of tracks through time – in a way not previously pos-sible – made discoveries much easier to obtain. Standard scientific tools used by the climate modellers to process and plot model out-put – such as IDL (interface description language) – are powerful, but are not conducive to data exploration because of thea priori
assumptions required when preparing and processing the data and the time required to do this, the imposition of which is a barrier to knowledge discovery. The climate modellers in our team found that these standard scientific tools became more efficient and effective when used in conjunction with interactive exploratory visualisation. The tool was easily adopted by the modellers at NCAS-Climate because it was distributed as a cross-platform Java application and could read the storm track dataset from the model directly without further processing or file conversion. The application itself is small, but the computational and memory requirements depend on the size of the data. 106,592 track points (2096 tracks) is 33Mb on disk and 553,949 track points (11,439 tracks) is 196Mb. The latter dataset runs comfortably within a 500Mb memory heap space, well within the specifications of most desktop computers.
The discoveries described were made by the climate modellers (Strachan and Vidale). The exploratory nature of the tool allowed discoveries to be made quickly, but collaborative development and use was over a period of about three months.
4.1 Storm track origins and paths
Using the tool to ‘play’ through the storm database helped the mod-ellers assess the spatial and temporal storm generation process. For example, a number of tracks that originate off the west coast of Cen-tral America and in CenCen-tral Africa within days of each other can be
1See accompanying video at http://www.gicentre.org/ stormtracks/discovery2010.mov
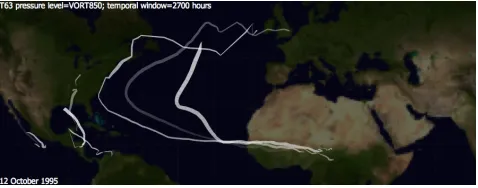
seen in Fig. 1, suggesting that local conditions at these times were favourable for generating low pressure disturbances which evolved into tropical storms. We were able to quickly identify periods wor-thy of further investigation using standard analysis tools.
[image:3.612.318.558.216.310.2]The tool was also used to identify and investigate apparently anomalous storm behaviour, to establish whether the outputs are valid or whether they result from limitations in the model simula-tion. We found that the tracking algorithm tended to identify storm structures much earlier in their lifetime than seen in the observed record. Storms that track over the Atlantic begin just off the West coast of Africa in the observed record, but those in the simulated set tend to originate in the continent’s interior (Fig. 1). We found that these early structures did not always evolve into tropical storms and were able to study the conditions under which these early storm structures do and do not evolve into tropical storms.
Figure 1: Co-genesis of tracks from the dynamical simulated storm set in Central America and West Africa on 27 August 1984 (see bot-tom of screen) in a temporal window of 2500 hours (∼3months; see top of screen). In all screenshots, line thickness represents wind speed and transparency is such that tracks fade over time.
Narrowing the temporal window and reducing the playback speed enabled the co-genesis and co-evolution of tracks to be ob-served. This is difficult to observe using existing tools available to the climate modellers. Cases were identified where tracks that form at about the same time, took very different paths. In Fig. 2 three tracks start in Central Africa within a month of each other, and take different paths across the Atlantic, one affecting the east coast of USA and two potentially affecting Northern Europe. This be-haviour occurs because although storms are governed by large scale circulation patterns, their behaviour is also determined by very local surface conditions. This makes storm path forecasting challenging.
Figure 2: Screenshot of the North Atlantic region, showing several storm tracks that originate in Central Africa, follow similar paths, then diverge, taking very different paths over the Atlantic Ocean, before dissipating at high latitudes.
[image:3.612.319.558.499.593.2]feedback does not always overcome prime local conditions. ’Sticky tracks’ could lead to multiple storms affecting the same location within a short time, thus impacts on society may be high.
Figure 3: ‘Sticky tracks’ in the West Pacific where multiple storms follow similar paths within a relatively short temporal window, zoomed to the West Pacific region.
[image:4.612.317.558.106.201.2]Zoom, pan and the use of a narrow temporal window, allowed the modellers to isolate individual tracks and obtain detailed infor-mation about them. For example, Fig. 4 shows a simulated storm in July 1996 that takes an unexpected northward path from the West African coast and then northeastwards across Western Europe. The evolution of tracks can be studied, including how the characteristics of a storm change over its lifetime.
Figure 4: Simulated storm originating in West Africa, but taking an unexpected northward turn across Western Europe. Details about this track along its length can be queried using the mouse.
4.2 Seasonal comparisons between basins
The adjustable temporal window enabled the exploration of tracks occurring over whole seasons. In Fig. 5 the temporal window has been increased to just over a year. The differing track transparencies in different hemispheres and basins indicated temporal – therefore seasonal – variation between basins. We also studied the impact of large scale circulation patterns on seasonal storm activity. The ef-fects of theEl Nino Southern Oscillation (ENSO)– a quasi-periodic global climate mechanism that results in correlated (teleconnected) storm patterns between basins – can be seen in Fig. 6. Fig. 6 (top) shows storm tracks occurring during the coolLa Ninaphase of the ENSO, revealing – as expected – fewer storms than usual in the West Pacific and more than usual in the North Atlantic basin. The opposite pattern can be observed in Fig. 6 (bottom), corresponding to the warmEl Ninophase of the ENSO. Visualising these expected patterns helped support the legitimacy of the simulated storm tracks and revealed correlated events.
The tool also allowed the modellers to unearth deviation from expected patterns. This is difficult to study using standard analysis tools because of thea prioriassumptions that, by their very na-ture, often relate to what we expect. Interactive scanning through the dataset allowed them to observe anomalous activity. For exam-ple, 1980 saw a very busy season in the Atlantic, but the storms occurred much later in the season (October to December) than the
[image:4.612.318.558.270.460.2]expected most active period (August and October). This is related to the different atmospheric conditions of these years, which once the periods have been established, could be investigated further us-ing standard tools.
Figure 5: Using a temporal window spanning just over a year, we can gain an overview of the Northern hemisphere tropical cyclone season for a particular year. Opaque tracks are the more recent in the temporal window – in this case, close to 6thDecember, 1993.
Figure 6: Here, we compare the behaviour of storms in two different seasons: during aLa Ninaperiod (top), the simulated storm dataset reveals more and stronger storms in the North Atlantic basin and fewer and weaker storms in the West Pacific basin. The opposite pattern occurs in anEl Ninoperiod (bottom), as expected.
5 IMPACT ON THE DISSEMINATION OF RESULTS
[image:4.612.55.294.325.419.2]The tool has had a positive impact on the way that information is disseminated because it has enabled the use of real examples to illustrate the information conveyed, making the information more tangible and engaging. It also allowed and encouraged potential industry users to explore the storm database themselves.
6 IMPACT ON THE INSURANCE INDUSTRY
Phenomena well-known to climate modellers – such as the ten-dency for storms to spatially and temporally cluster, and the im-pact of natural climate variability – have strong implications for insurance risk. Effectively transferring this knowledge is important because outputs from the CAT models used in the insurance indus-try should not be taken at face-value – they are particular views of risk that should be assessed alongside alternative views and with sufficient understanding of the phenomena in question. This helps those who evaluate risk to make better decisions.
6.1 Spatial and temporal clustering
The tendency for events to cluster and its implications are not fully appreciated in the industry. CAT models usually treat each event independently, often leading to the underestimation of risk because the accumulated impact of spatially and temporally clustered events is not assessed. Examples of storm clustering can be found in sec-tion 4.1, where ‘sticky tracks’ (Fig. 3) are of particular interest. Pre-senting illustrated examples of these and their likely impacts helped the insurance industry make more realistic assessments of risk.
6.2 Teleconnected events
The globally connected nature of the climate system means that extreme events in very different locations across the globe can be physically connected – or ‘teleconnected’ – as described in section 4.2. This is an important consideration for the insurance industry because it can lead to the accumulation of seemingly unrelated risk. Teleconnected events are neglected when using current risk assess-ment tools which take a spatially disconnected view of risk. CAT models are often run for particular regions of the globe, without considering what is happening in other regions. Our tool is helping demonstrate these issues to the industry.
6.3 Tropical origin of storms at high latitudes
Fig. 2 demonstrates that many of the storms we see at high lati-tudes have tropical origins. Tropical and extratropical modelling is usually treated separately, but the fact that these are often sim-ply different stages of the same event means that one storm may have multiple, insurance related, impacts, both as tropical storms and extratropical wind storms, and therefore multiple claims.
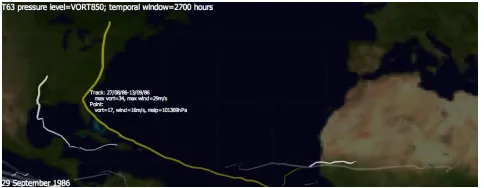
6.4 Characteristics of storms at landfall
The insurance industry has particular interest in what happens when tracks make landfall as this is where and when most dam-age is likely to occur. Interrogating tracks to obtain the windspeed and vorticity provided useful information about how the simulated storm behaves as it makes landfall (e.g. Fig. 7).
7 FURTHER AND ONGOING WORK
[image:5.612.318.560.53.147.2]Work is ongoing, the tool is still being developed and development continues to be collaborative. New functionality is being added, in response to both climate and catastrophe modellers’ needs. We are evaluating the techniques we use and writing up case studies of how interactive visualisation is being used to generate insights and disseminate information within and between atmospheric sci-ence and the insurance industry (section 5). We recently passed the tool to other climate modellers to try and hope their views will pro-vide useful input for future development. Suggestions for enhanced functionality currently include: visually highlighting the point at which the transition from a ‘warm core’ tropical storm structure
Figure 7: The track, highlighted in yellow, is queried at the point it makes landfall in Florida. Information is provided about the whole track, as well as at the specific point queried.
to ‘cold core’ extratropical storm structure occurs; and displaying atmospheric and oceanic conditions (e.g. surface temperature), to help visual exploration of the relationships between surface condi-tions and storm behaviour.
Our experience of presenting to the insurance industry shows that there is strong potential for sequential and interactive graphical methods to be used in educational contexts for demonstrating the genesis and behaviour of storm tracks in response to atmospheric conditions, and the interdependent relationship between storm ac-tivity across individual basins. This is necessary education for an industry where geographical correlations can be a significant con-sideration in risk optimisation strategies. We are also investigating ways in which the tool could be used by atmospheric science stu-dents to explore and understand observed and dynamically simu-lated global storm activity.
8 CONCLUSION
The impact of our tool on atmospheric modellers and the insurance industry demonstrates the value of exploratory interactive visualisa-tion in these domains. The success is due to the close collaborative work between the designers and the modellers and the use of the simple but effective visualisation techniques and intuitive interac-tions. This has resulted in the rapid adoption of a new approach to the exploration and validation of storm tracks, improvements to the dynamical climate models, the identification and capture of useful case studies for the dissemination of knowledge and insights into storm behaviour that have been obtained by both the modellers and the insurance industry. Insights obtained are both helping improve the storm track modelling and providing examples of storm track behaviour of importance to the insurance industry.
ACKNOWLEDGEMENTS
The authors thank the Willis Research Network for supporting this work and Matthew Foote and Brian Owens from Willis for their useful comments on this manuscript. Simulated storm tracks were extracted from high-resolution versions of the UK Met Office Hadley Centre Model, with feature tracking algorithm developed by Kevin Hodges at the University of Reading. High-resolution global climate model development was undertaken as part of the UK HiGEM Project and UK Japan Climate Collaboration. Back-ground imagery in the figures is NASA’s Blue Marble.
REFERENCES
[1] A. Gilchrist. Numerical simulation of climate and climate change. Na-ture, 276(5686):342–345, 1979.
[2] P. Grossi, H. Kunreuther, and D. Windeler. An introduction to catas-trophe models and insurance. In P. Grossi and H. Kunreuther, editors,
Catastrophe Modelling: A New Approach to Managing Risk, chapter 2. Springer, New York, 2005.