1
DEVELOPMENT AND VALIDATION OF ANALYTICAL METHODS FOR QUANTIFICATION OF SOME NOVEL DRUGS IN FORMULATION
THESIS
Submitted to
The Tamilnadu Dr. M. G. R. Medical University
Guindy, Chennai-600032, Tamilnadu, India
In partial fulfillment of the requirement for the award of the degree of
DOCTOR OF PHILOSOPHY
(Faculty of Pharmacy)
Submitted by
A. MEENA, M. Pharm.,
Under the guidance of
Prof. V. VAIDHYALINGAM, M. Pharm, Ph.D.,
VELS COLLEGE OF PHARMACY CHENNAI
2
CONTENTS
S.no.
Title
Page no.
I
INTRODUCTION
1
1.1 Drug Profile
20
II
AIM AND OBJECTIVE OF THE STUDY
30
III
REVIEW OF LITERATURE
31
IV
MATERIALS AND METHODS
42
4.1 Reference Standards
42
4.2 Reagents and Instruments
43
4.3 Pharmaceutical Formulation Used
45
4.4 Development and Validation of Analytical Techniques
46
V
RESULTS AND DISCUSSION
102
VI
SUMMARY AND CONCLUSION
122
3 ABBREVIATIONS
% Percentage
max Maximum wave length
mM Millimole
µg Microgram
ACN Acetonitrile
APZ Alprazolam
AR Analytical grade
ASN Aspirin
BP British Pharmacopeia
CIL Cilnidipine
CLN Cilastatin sodium
et al And others
g Gram
H3PO4 Phosphoric acid
HCl Hydrochloric acid
HPLC High Performance liquid Chromatography
HPTLC High Performance Thin Layer Chromatography
ICH International conference on Harmonization
IMI Imipenem
IP Indian Pharmacopeia
ISM Isosorbide Mononitrate
KH2PO4 Potassium dihydrogen Phosphate
4
LOQ Limit of quantification
min Minutes
ml Millilitre
NaOH Sodium hydroxide
NAP Naproxen
ng Nanogram
nm Nanometer
Rf Retention factor
RP-HPLC
Reverse Phased High Performance Liquid
Chromatography
RSD Relative Standard Deviation
RT Retention time
SD Standard Deviation
TEL Telmisartan
TLC Thin Layer Chromatography
USP United States Pharmacopeia
v/v Volume by volume
5
LIST OF TABLES
Table No. Title
Formulation 1 : Naproxen and Esomeprazole magnesium
1 Linearity range (UV Spectrophotometry)
2 Analytical performance (UV Spectrophotometry) 3 Recovery Data (UV Spectrophotometry)
4 Repeatability (UV Spectrophotometry) 5 System Suitability Test (RP - HPLC) 6 Linearity Range (RP -HPLC)
7 Statistical Data for precision ( RP- HPLC ) 8 Accuracy /Recovery Data ( RP - HPLC ) 9 Stability of analytical solutions (RP - HPLC) 10 Robustness Data ( RP - HPLC )
11 Linearity data (HPTLC )
12 Analytical performance parameter ( HPTLC ) 13 Precision Data ( HPTLC )
14 Accuracy Data (HPTLC )
Formulation 2 : Telmisartan and Cilnidipine
15 Linearity range ( UV Spectrophotometry)
16 Analytical performance ( UV Spectrophotometry) 17 Recovery Data ( UV Spectrophotometry)
6
19 System Suitability Test (RP - HPLC) 20 Linearity Range (RP -HPLC)
21 Statistical Data for precision (RP- HPLC) 22 Accuracy /Recovery Data ( RP - HPLC ) 23 Stability of analytical solutions (RP - HPLC) 24 Robustness data( RP-HPLC)
25 Linearity data ( HPTLC )
26 Analytical performance parameter (HPTLC) 27 Precision Data ( HPTLC )
28 Accuracy Data ( HPTLC )
Formulation 3 : Alprazolam and Propranolol hydrochloride
29 Linearity range (UV Spectrophotometry)
30 Analytical performance (UV Spectrophotometry) 31 Recovery Data ( UV Spectrophotometry)
32 Repeatability (UV Spectrophotometry) 33 System Suitability Test (RP – HPLC) 34 Linearity Range (RP -HPLC)
35 Statistical Data for precision ( RP- HPLC ) 36 Accuracy /Recovery Data ( RP - HPLC ) 37 Stability of analytical solutions (RP - HPLC) 38 Robustness Data ( RP - HPLC )
39 Linearity data ( HPTLC )
40 Analytical performance parameter ( HPTLC ) 41 Precision Data ( HPTLC )
7
Formulation 4 : Cilastatin sodium and Imipenem
43 Linearity range ( UV Spectrophotometry)
44 Analytical performance ( UV Spectrophotometry) 45 Recovery Data ( UV Spectrophotometry)
46 Repeatability ( UV Spectrophotometry ) 47 System suitability Test ( RP - HPLC ) 48 Linearity Range ( RP -HPLC )
49 Statistical Data for precision (RP- HPLC) 50 Accuracy /Recovery Data ( RP - HPLC ) 51 Stability of analytical solutions ( RP - HPLC ) 52 Robustness data( RP-HPLC)
53 System Suitability Test ( RP - HPLC )
Formulation 5 : Isosorbide Mononitrate and Aspirin
54 Linearity Range ( RP -HPLC )
55 Statistical Data for precision ( RP- HPLC ) 56 Accuracy /Recovery Data ( RP - HPLC ) 57 Stability of analytical solutions ( RP - HPLC ) 58 Robustness Data ( RP - HPLC )
59 Linearity data ( HPTLC )
60 Analytical performance parameter ( HPTLC ) 61 Precision Data ( HPTLC )
8
LIST OF FIGURES
Figure:1 Schematic procedure for HPTLC method development
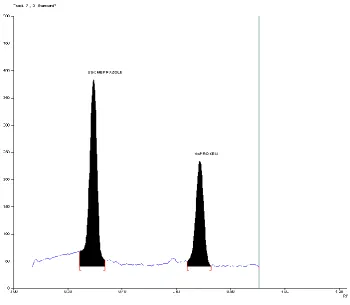
Figure:2 Chromatogram of Naproxen and Esomeprazole magnesium (Trial )
Figure:3 Chromatogram of Telmisartan and Cilnidipine
Figure:4 Chromatogram of Propranolol hydrochloride and Alprazolam
Figure:5 Chromatogram of Cilastatin sodium and Imipenem
Figure:6 Chromatogram of Isosorbide Mononitrate and Aspirin.( Trial )
Figure:7 UV spectrum for Naproxen max
Figure:8 UV spectrum for Esomeprazole magnesium max
Figure:9 Overlain spectrum of Naproxen and Esomeprazole magnesium.
Figure:10 Linearity graph of Naproxen and Esomeprazole magnesium
Figure:11 Calibration curve of Naproxen
Figure:12 Calibration curve of Esomeprazole magnesium
Figure:13 Chromatogram of standard (I) Naproxen and Esomeprazole magnesium
Figure:14 Chromatogram of standard (II) Naproxen and Esomeprazole magnesium
Figure:15 Chromatogram of standard (III) Naproxen and Esomeprazole magnesium
Figure:16 Chromatogram of standard (IV) Naproxen and Esomeprazole magnesium
Figure:17 Chromatogram of standard (V) Naproxen and Esomeprazole magnesium
Figure:18 Linearity of Naproxen (RP-HPLC)
Figure:19 Linearity of Esomeprazole magnesium (RP-HPLC)
Figure:20 Chromatogram of Naproxen and Esomeprazole magnesium in formulation
Figure:21 Overlain spectrum of Naproxen and Esomeprazole magnesium
9
Figure:23 Standard (I) Densitogram of Naproxen and Esomeprazole magnesium
Figure:24 Standard (II) Densitogram of Naproxen and Esomeprazole magnesium
Figure:25 Standard (III) Densitogram of Naproxen and Esomeprazole magnesium
Figure:26 Standard (IV) Densitogram of Naproxen and Esomeprazole magnesium
Figure:27 Standard (V) Densitogram of Naproxen and Esomeprazole magnesium
Figure:28 Linearity for Naproxen (HPTLC)
Figure:29 Linearity for Esomeprazole magnesium (HPTLC)
Figure:30 Densitogram of Naproxen and Esomeprazole magnesium formulation
Figure:31 UV spectrum for Telmisartan max
Figure:32 UV spectrum for Cilnidipine max
Figure:33 Overlain spectrum of Telmisartan and Cilnidipine tablets
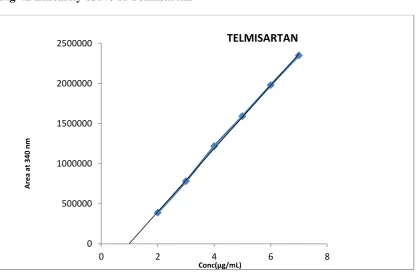
Figure:34 Linearity graph of Telmisartan and Cilnidipine tablets
Figure:35 Telmisartan calibration curve
Figure:36 Cilnidipine calibration curve
Figure:37 Standard (I) Chromatogram of Telmisartan and Cilnidipine
Figure:38 Standard (II) Chromatogram of Telmisartan and Cilnidipine
Figure:39 Standard (III) Chromatogram of Telmisartan and Cilnidipine
Figure:40 Standard (IV) Chromatogram of Telmisartan and Cilnidipine
Figure:41 Standard (V) Chromatogram of Telmisartan and Cilnidipine
Figure:42 Linearity curve of Telmisartan
Figure:43 Linearity curve of Cilnidipine
Figure:44 Chromatogram of Telmisartan and Cilnidipine formulation
Figure:45 Overlain spectra of Telmisartan and Cilnidipine
Figure:46 Dimensional spectrum of Telmisartan and Cilnidipine
10
Figure:48 Standard (II) Densitogram of Telmisartan and Cilnidipine
Figure:49 Standard (III) Densitogram of Telmisartan and Cilnidipine
Figure:50 Standard (IV) Densitogram of Telmisartan and Cilnidipine
Figure:51 Standard (V) Densitogram of Telmisartan and Cilnidipine
Figure:52 Linearity for Telmisartan (HPTLC)
Figure:53 Linearity for Cilnidipine (HPTLC)
Figure:54 Chromatogram of Telmisartan and Cilnidipine formulation
Figure:55 UV spectrum for Alprazolam max
Figure:56 UV spectrum for Propranolol hydrochloride max
Figure:57 Overlain spectrum of Alprazolam and Propranolol hydrochloride
Figure:58 Linearity graph of Alprazolam and Propranolol hydrochloride
Figure:59 Calibration curve of Propranolol hydrochloride
Figure:60 Calibration curve of Alprazolam
Figure:61 Chromatogram of standard (I) Alprazolam and Propranolol hydrochloride
Figure:62 Chromatogram of standard (II) Alprazolam and Propranolol hydrochloride
Figure:63 Chromatogram of standard (III) Alprazolam and Propranolol hydrochloride
Figure:64 Chromatogram of standard (IV) Alprazolam and Propranolol hydrochloride
Figure:65 Chromatogram of standard (IV) Alprazolam and Propranolol hydrochloride
Figure:66 Linearity of Propranolol hydrochloride (RP-HPLC)
Figure:67 Linearity of Alprazolam (RP-HPLC)
Figure:68 Chromatogram of Alprazolam and Propranolol hydrochloride formulation
Figure:69 Overlain spectrum of Alprazolam and Propranolol hydrochloride
Figure:70 Standard (I) Densitogram of Alprazolam and Propranolol hydrochloride
Figure:71 Standard (II) Densitogram of Alprazolam and Propranolol hydrochloride
11
Figure:73 Standard (IV) Densitogram of Alprazolam and Propranolol hydrochloride
Figure:74 Standard (V) Densitogram of Alprazolam and Propranolol hydrochloride
Figure:75 Linearity for Propranolol hydrochloride (HPTLC)
Figure:76 Linearity for Alprazolam (HPTLC)
Figure:77 Densitogram of Alprazolam and Propranolol hydrochloride formulation
Figure:78 UV spectrum for Cilastatin sodium max Figure:79 UV spectrum for Imipenem max
Figure:80 Overlain spectrum of Cilastatin sodium and Imipenem tablets
Figure:81 Linearity spectrum of Cilastatin sodium and Imipenem tablets
Figure:82 Cilastatin sodium calibration curve
Figure:83 Imipenem calibration curve
Figure:84 Standard (I) Chromatogram of Cilastatin sodium and Imipenem
Figure:85 Standard (II) Chromatogram of Cilastatin sodium and Imipenem
Figure:86 Standard (III) Chromatogram of Cilastatin sodium and Imipenem
Figure:87 Standard (IV) Chromatogram of Cilastatin sodium and Imipenem
Figure:88 Standard (V) Chromatogram of Cilastatin sodium and Imipenem
Figure:89 Linearity curve of Cilastatin sodium
Figure:90 Linearity curve of Imipenem
Figure:91 Chromatogram of Cilastatin sodium and Imipenem formulation
Figure:92 Chromatogram of standard (I) Aspirin and Isosorbide Mononitrate
Figure:93 Chromatogram of standard (II) Aspirin and Isosorbide Mononitrate
Figure:94 Chromatogram of standard (III) Aspirin and Isosorbide Mononitrate
Figure:95 Chromatogram of standard (IV) Aspirin and Isosorbide Mononitrate
Figure:96 Chromatogram of standard (V) Aspirin and Isosorbide Mononitrate
12
Figure:98 Linearity of Isosorbide Mononitrate (RP-HPLC)
Figure:99 Chromatogram of Aspirin and Isosorbide Mononitrate in formulation
Figure:100 Overlain spectrum of Aspirin and Isosorbide Mononitrate
Figure:101 Dimensional spectrum of Aspirin and Isosorbide Mononitrate
Figure:102 Standard (I) Densitogram of Aspirin and Isosorbide Mononitrate
Figure:103 Standard (II) Densitogram of Aspirin and Isosorbide Mononitrate
Figure:104 Standard (III) Densitogram of Aspirin and Isosorbide Mononitrate
Figure:105 Standard (IV) Densitogram of Aspirin and Isosorbide Mononitrate
Figure:106 Standard (V) Densitogram of Aspirin and Isosorbide Mononitrate
Figure:107 Linearity for Aspirin (HPTLC)
Figure:108 Linearity for Isosorbide Mononitrate (HPTLC)
1
I.
INTRODUCTION
Analytical chemistry is the study of separation, identification and
quantification of the chemical components of natural and artificial material.
Quantitative analysis gives an indication of identity and purity of the chemical species
in the sample and quantitative analysis determines the amount of one or more of these
components. The separation of components often performed prior to analysis.
Analytical chemistry is also focused on improvement in experimental design,
chemometrics and creation of new measurement tools to provide better chemical
information.
Analytical instrumentation plays an important role in production and
evaluation of new product. Analytical technique is a method that is used to determine
the concentration of a chemical compound or chemical element. There are a wide
variety of techniques used for analysis, from simple weighing to titration to advanced
techniques using highly specialized instruments. The most common techniques used
in analytical chemistry are the following.
Titrimetry, based on the quantity of the titrant needed to react with the analyte.
Electroanalytical methods, includes potentiometry and volumetry.
Spectroscopy based on the differential interaction of the analyte along with
electromagnetic radiation.
Chromatography in which the analyte is separated from the rest of the sample
so that it may be measured without interference from other compounds
Microscopy
Bio-analysis
2 NEED FOR METHOD DEVELOPMENT
Analytical method development and validation plays important role in the
discovery, development and manufacture of pharmaceuticals. Pharmaceutical
products formulated with more than one drug are referred to as combination products.
These combination products can present daunting challenges to the analytical chemist
responsible for the development and validation of analytical methods.
The aim of method development is to develop and validate analytical methods
like UV, high performance liquid chromatography (HPLC) and High performance
thin layer chromatography (HPTLC) for drug products containing more than one
active ingredient. The official test methods that results from these process can be used
by quality control laboratories to ensure the identity purity, potency and efficacy of
the drug products.
Basic criteria for new method development of drug analysis
The drug or drug combination may not be official in any pharmacopoeia
The proper analytical procedure of the drug may not be available in the
literature due to patent regulation.
Analytical methods may not be available for the drug in the form of a
formulation due to interference caused by the excipients.
Analytical methods for the quantification of the drug in biological fluids may
not be available.
The existing analytical procedure may require expensive reagent and solvents.
It may also be cumbersome extraction and separation procedure and these may
3 UV SPECTROPHOTOMETRIC METHODS
The technique of ultraviolet visible spectroscopy is one of the most frequently
employed methods in pharmaceutical analysis.
The basis of all the spectrophotometric techniques for multicomponent sample is the
property that at all wavelengths
the absorbance of the solution is the sum of absorbance of the individual
components or
the measured absorbance is the difference between the total absorbance of the
solution in the sample cell and that of the solution in the reference cell.
There are various spectrophotometric methods available which can be used for the
analysis of combination samples. The following methods can be used
Simultaneous equation method
Derivative spectroscopic method
Absorbance ratio method [Q- Absorbance method]
Orthogonal polynomial method
4 SIMULTANEOUS EQUATION METHOD
If a sample contains two absorbing drugs namely X and Y each of which absorbs at
the λmax of the other, it may be possible to determine both the drugs by the technique
of simultaneous equation method [vierodt’s method]
The information’s required are
i. The absorptivities of X at λ1 and λ2, ax1and ax2 respectively
ii. The absorptivities of Y at λ1 and λ2, ay1and ay2 respectively
iii. The absorbance of the diluted samples at λ1 and λ2, A1 and A2 respectively
iv. At λ1 A1 = ax bcx+ay1bcy 1
At λ2 A2 = ax2bcx+ay2bcy 2
For measurement in 1 cm cell b = 1
Rearrange eq. (2)
A2-ax2Cx
Cy =
ay2
A2ay2-A1ay2
Cx =
Ax2ay1-axay2
criteria for obtaining maximum precision based upon absorbance ratio
A2/A1 ay2/ay1
and ax2/ax1 A2/A1
should lie outside the range 0.1- 2.0 for the precise determination of Y and X
respectively. These criteria are satisfied only when the λ max of the two components
5 ABSORBANCE RATIO METHOD
The absorbance ratio method is the modification of the simultaneous equation
procedure. It depends on the property that, for a substance which obeys Beer’s law at
all wave length, the ratio of absorbance at any two wave length is a constant value
independent of concentration or path length. Two different dilutions of the same
substance give the same absorbance ratio A1/A2 and this is referred as Q value in USP.
In the quantitative assay of two components in admixture by the absorbance
ratio method, absorbance is measured at two wavelengths. One being a wave length of
equal absorptive of the two components ie, an iso-absorptive point [permarowski et
al., 1961]
The above equation explains the concentration of X in term of absorbance
ratio, the absorbance of a mixture and the absorptive wavelength. Accurate dilution of
the sample solution and of the standard solution of X and Y are necessary for the
accurate measurement of A1 and ax1 respectively.
Geometric correction method and orthogonal polynomial methods involves
mathematical correction procedure which reduces or eliminate the background
6 DIFFERENCE SPECTROSCOPY
The essential feature of a difference spectroscopy assay is that the measured
value is the difference in the absorption (∆A) between equimolar solutions of the
analyte in different chemical forms which exhibit different spectral characteristics.
The criteria for applying difference spectrometry to the assay of the substance
in the presence of other absorbing substance are that;
Reproducible changes may be induced in the spectrum of the length by
the addition of one or more reagents.
The absorbance of the interfering substance is not altered by the
7 DERIVATIVE SPECTROSCOPY
Derivative spectrophotometry involves the conversion of a normal spectrum to
its first, second or higher derivative spectrum.
The first derivative (D1) spectrum is a plot of the rate of change of absorbance
with wavelength against wavelength ie.,
The second derivative (D2) spectrum is a plot of the curvature of the D0
spectrum against wave length ie.,
d2A
vs
d2
SOLVENT EXTRACTION METHOD
If the interference from other absorbing substance is large or if its contribution
to the total absorption cannot be calculated, it may be possible to separate the
interfering substance from the analyte by solvent extraction procedure. This is
appropriate for acidic and basic drugs whose state of ionization determines the solvent
8 HPLC METHOD
High Performance Liquid Chromatography is the most versatile and widely
used type of elution chromatography. The types of high performance liquid
chromatography are often classified by separation mechanism or by the type of
stationary phase.
These include
i. Partition or liquid- liquid chromatography
ii. Adsorption or liquid - solid chromatography
iii. Ion- exchange or ion chromatography
iv. Size exclusion chromatography
v. Affinity chromatography
INSTRUMENTATION
The basic system of HPLC is illustrated below
The mode of operation of this system is isocratic ie., one particular solvent or a
mixture is pumped throughout the analysis and for some determinations the solvent
9 HPLC instrumentation includes a
i. Pump
ii. Injection
iii. Column
iv. Detector
v. Data system
Pump
High pressure pumps are needed to force solvents through packed stationary
beds.
Mechanical pumps of the reciprocating piston type give a pulsating supply of
mobile phase. A damping device is therefore required to smooth out the pulses so that
excessive noise at high level of sensitivity or low pressure does not distract from
detection of small quantities of sample.
Dual piston reciprocating pumps produce an almost pulse-free flow because
the two pistons are carefully phased so that as one is filling and the other is pumping.
These pumps are expensive than single piston pumps but are of benefit when using a
flow-sensitive detector such as an ultraviolet or refractive index detector.
Injection system
Injection ports are of two basic types
Those in which the sample is injected directly into the column
Those in which the sample is deposited before the column inlet and then swept
10 Column
Typical HPLC columns are 5, 10, 15 and 25 cm in length and are filled with
small diameter (3, 5 or 10 µm) particles. The internal diameter of the column is
usually 4.6 mm. However if pure substances are to be collected then larger diameter
column may be needed.
There are two variants in use in HPLC depending on the relative polarity of
the solvent and stationary phase.
Normal phase HPLC.
Here the column is filled with tiny silica particles and the solvent is non-polar.
Polar compounds in the mixture sticks to the polar silica and the non-polar
compounds will elute quickly.
Reverse Phase HPLC
In Reversed Phase HPLC silica is modified to make it non polar by attaching
long hydrocarbon chains to its surface with either 8 or 18 carbon atoms and the
solvent is polar. Non polar compounds in the mixture are retained by the column and
the polar molecules will travel through the column more quickly.
Detector
The detector of the separated components in the eluate from the column is
based upon the bulk property of the eluate (eg. its refractive index) or the solute
property of the individual components (eg. their ultraviolet absorption, fluorescence
or electrochemical activity). The most commonly used detector in the HPLC analysis
of pharmaceutical substance is described below.
Photometric detectors
These normally operate in the ultraviolet region of the spectrum and are the
most extensively used detector in pharmaceutical analysis. They comprise essentially
11
measurement and a photomultiplier tube or diode to measure the intensity of
transmitted light.
Photometric detectors are of five principal types.
Single wavelength detector:
The absorbance is measured at the most intense resonance wavelength of
mercury at 254 nm.
Multi-wavelength detector:
It allows a number of monochromatic wavelengths to be selected eg. 206,
226,280, 313,340 or 365 nm.
Variable wavelength detector:
It allows the selection of wavelength between 190-360 nm.
Programmable detector:
It allows the automatic change of wavelength between and during
chromatographic analysis.
Diode assay detector:
These are microprocessor- controlled photodiode array spectrophotometer.
Each diode detects light at a discrete wavelength.
Fluorescence Detector.
These are filter fluorimeter or spectrofluorimeter equipped with grating
monochromator and micro flow cells. Their sensitivity depends on the fluorescence
properties of the components in the eluate. For substance that are fluorescent
fluorescence detector are used. They are more sensitive than photometric detectors.
Refractive index detector
These are differential refractometer which responds to the change in bulk
property of the refractive index of the solution of the components in the mobile
12 Electro chemical detector
These are based on standard electrochemical principle involving amperometry,
voltametry and polarography. These detectors are very sensitive for substances that
are electroactive, ie., those that undergo oxidation or reduction at a suitable potential.
Data system
The main goal in using electronic data system is to increase analytical
accuracy and precision while reducing operator attention. In routine analysis where no
automation is needed a pre programmed computing integrator may be sufficient. If
higher control levels are desired, more intelligent devices such as data station or
13
HIGH PERFORMANCE THIN LAYER CHROMATOGRAPHY
HPTLC is a sophisticated instrument technique based on the full capabilities
of thin layer chromatography. The advantage of automation, scanning full
optimization, selective detection principle, minimum sample preparation, hyphenation
etc enable it to be a powerful analytical tool for chromatographic information of
complex mixture of inorganic, organic and biomolecules.
The advancement in terms of better separation and resolution and faster
resolution is due to
Use of readymade HPTLC plates with optimized adsorbent layers having
small particle size with uniform particle size distribution as the stationary
phase.
The use of pressure enables faster development of chromatogram even in
complex mixtures.
14 Stationary phase
It uses HPTLC plates featuring small particles with a narrow size distribution.
HPTLC plates provide improved resolution, higher detection sensitivity and improved
in situ quantification and are used for industrial pharmaceutical densitometric
quantitative analysis. Silica gel with a less polar mobile phase, such as chloroform–
methanol, has been used for NP- HPTLC. Lipophilic C-18, C-8, C-2; phenyl
chemically-modified silica gel phases; and hydrocarbon- impregnated silica gel plates
developed with a more polar aqueous mobile phase, such as methanol–water or
dioxane–water, are used for RP-HPTLC.
Plates are used without pretreatment unless chromatography produces
impurity fronts due to contamination of the plate. Generally methanol is used as a
prewashing solvent.
Mobile Phase:
The selection of mobile phase is based on adsorbent material used as
stationary phase and physical and chemical properties of analyte.
Sample preparation and application:
Proper sample preparation is an important prerequisite for the successful
HPTLC separation. If the analyte concentration is sufficiently high, pharmaceutical
dosage forms can often be simply dissolved in a solvent that will completely
solubilize the analyte and leave excipients or extraneous compounds undissolved to
yield a test solution that can be directly spotted for HPTLC analysis. Several steps
may be necessary such as grinding, sonication, filtration, extraction, centrifugation,
and concentration procedure if low concentration of analyte is present in
15 Development of Chromatogram:
HPTLC plates are developed in flat-bottom chambers, twin-trough chambers,
or horizontal-development chambers. Separations obtained in HPTLC are affected by
the vapor phase, which depends on the type, size, and saturation condition of the
chamber during development. The interactions of these three phases as well as other
factors, such as temperature and relative humidity, must be controlled to obtain
reproducible TLC separations.
Detection
Detection under UV light is the first choice as it is nondestructive. The layer
can be viewed under long [366nm] and short wave [254nm] UV light.
Chemical Derivatization
Derivatization is necessary in most cases to visualize the analytes of interest.
Derivatization can be performed either by immersing the plates or by spraying the
plates with a suitable reagent. To induce or optimize the derivatization reaction, it
may be necessary to heat the plates.
Quantification
Most modern HPTLC quantitative analysis are performed in situ by measuring
the zones of samples and standards using a chromatogram spectrophotometer usually
called a densitometer or scanner with a fixed sample light beam in the form of a
rectangular slit. Quantitative evaluation is performed with the TLC Scanner 3 using
16 Validation of Analytical Method
Analytical method validation is the process used to confirm that the analytical
procedure employed for a specific test is suitable for its intended use. Results from
methods validation can be used to judge the quality, reliability and consistency of the
analytical results; it is an integral part of any good analytical practice.
Analytical methods used to be validated or revalidated.
Before their introduction into routine use
Whenever the condition changes or which the method has been validated
The USP has published specific guidelines for method validation for compound
evaluation. USP defines right steps for validation.
Accuracy Precision Specificity
Limit of detection Limit of quantitation Ruggedness
Robustness
The FDA has also published guidelines for the validation of bio-analytical methods.
Wegscheider15 has published procedure for method validation with a special focus on
calibration, recovery experiments, method comparison and investigation of
ruggedness.
Accuracy
The accuracy of an analytical method is the closeness of test results obtained
by that method to the true value.
Precision
The precision of an analytical procedure expresses the closeness of agreement
17
homogenous sample under prescribed condition. Precision may be considered at three
levels.
Repeatability
Intermediate precision
Reproducibility
The precision of an analytical procedure is usually expressed as the variance, standard
deviation or coefficient of variation of a series of measurements.
Repeatability expresses the precision under the same operating conditions over
a short interval of time. Repeatability is also termed intra- assay precision.
Intermediate precision expresses within laboratory variations different days,
different analysis, different equipment etc.
Reproducibility expresses the precision between laboratories.
Limit of detection.
The detection limit of an individual analytical procedure is the lowest amount
of analyte in a sample which can be detected but not necessarily quantitated as an
exact value.
Limit of Quantitation:
The quantitation limit of an individual analytical procedure is the lowest
amount of analyte in a sample which can be quantitatively determined with suitable
precision and accuracy.
Linearity and Range
The linearity of an analytical procedure is its ability (within a given range) to
obtain test results which are directly proportional to the concentration of analyte in the
18
The range of an analytical procedure is the interval between the upper and
lower concentration of analyte in the sample for which it has been demonstrated that
the analytical procedure has a suitable level of precision, accuracy and linearity.
Robustness
The robustness of an analytical procedure is a measure of its capacity to
remain unaffected by small, but deliberate variations in method parameters and
19
STATISTICS IN ANALYTICAL METHOD VALIDATION
The statistics required for the interpretation of validation results include:
The calculation of the mean, standard deviation, confidence intervals and
relative standard deviation for data sets obtained;
Regression analysis for evaluation of linearity and accuracy
Comparative studies
Validation statistics software package are normally used for the calculation of
20
I.1 DRUG PROFILE
A. Cilnidipine
Structure:
Molecular formula : C27 H28O2N2
Molecular weight : 492.52
IUPAC Name :
1,4-dihydro-2,6-dimethyl-4-(3-nitropheny -3,5 pyridine dicarboxylic
acid- 2 methoxyethyl(2E)- 3-Phenyl-2-Propenyl ester
Description : Light yellow crystalline powder
Solubility : Soluble in DMSO and ethanol
Therapeutic use : Slow acting calcium channel blocker, antihypertensive and
21 B. Telmisartan
Structure:
Molecular formula : C30 H30N4O2
Molecular weight : 514.62
IUPAC Name :
2(4-{(4-methyl-6-(1-methyl-1H-1,3benzodiazol-2-yl)-2-propyl-1H-1,3-benzodiazol-1-yl)methyl}phenyl)benzoic
acid
Description : White to slightly yellowish colored powder.
Solubility : Insoluble in water soluble in strong base and sparingly
soluble in strong acid
22 C. Imipenem
Structure:
Molecular formula : C12 H17N3O4S
Molecular weight : 299.347
IUPAC Name
:
(5R, 6S)-6-((1R)-1-hydroxy ethyl)-3-({2-[(iminomethyl)
amino] ethyl} thio)-7-oxo-1-azabicyclo (3.2.0)
hept-2-ene-2-carboxylic acid.
Description : White solid.
Solubility : Soluble in water
23 D. Cilastatin sodium
Structure:
Molecular formula : C16H25N2NaO5S
Molecular weight : 358.454
IUPAC Name : (Sodium 7-(2-amino-2-carboxy-ethyl)sulfanyl-2-(2,2
-dimethylcyclopropyl)carbonylamino-hept-2-enoate;
Description : Off white solid.
Solubility : Soluble in water and dimethyl sulfoxide
Therapeutic use : It inhibits human enzyme dehydro peptidase which is
24 E. Naproxen
Structure:
Molecular formula : C14 H14O3
Molecular weight : 230.259
IUPAC Name : (+)-(S)-2-(6-methoxy naphthalene- 2-yl) propanoic acid
Description : White powder.
Solubility : Soluble in methanol, dimethyl sulfoxide
25 F. Esomeprazole magnesium
Structure:
Molecular formula : C34H36MgN6O6S2
Molecular weight : 713.12
IUPAC Name :
(T-4)-Bis[5-methoxy-2-[(S)-[(4-methoxy-3,5-dimethyl-2-pyridinyl)methyl]sulfinyl]-1H-benzimidazolato]magnesium
Description : White to slightly coloured powder
Solubility : Soluble in methanol, slightly soluble in water
26 G. Alprazolam
Structure:
Molecular formula : C17 H13ClN4
Molecular weight : 308.76
IUPAC Name : 8- Chloro-1-methyl-6-phenyl- 4H - s-triazolo
[4,3-α] [1,4] benzodiazepine.
Description : White crystalline powder
Solubility : Soluble in methanol and ethanol
Therapeutic use : Anxiolytic, Sedative, Hypnotic, Skeletal muscle
27 H. Propranolol hydrochloride
Structure:
Molecular formula : C16H21NO2•HCl
Molecular weight : 259.34
IUPAC Name : 1-(1-naphthyloxy) -2- hydroxy -3-isopropyl amino propane
hydrochloride
Description : White powder
Solubility : Soluble in water
28 I. Aspirin
Structure:
Molecular formula : C9 H8O4
Molecular weight : 180.157
IUPAC Name : 2-acetoxy benzoic acid
Description : White crystalline powder
Solubility : Soluble in ethanol, dimethyl sulfoxide and dimethyl
formamide
Therapeutic use : Anti-pyretic, inflammatory, analgesic and
29 J. Isosorbide Mononitrate
Structure:
Molecular formula : C6 H9NO6
Molecular weight : 191.14
IUPAC Name : 8-nitrooxy-2,6-dioxabicyclo[3.3.0] octan-4-ol
Description : White crystalline powder
Solubility : Soluble in alcohol, water and Chloroform
30
II.
AIM AND OBJECTIVE OF THE STUDY
Analytical techniques play a crucial role in new drug development. New drugs or
combinations are often developed for eliciting better clinical response. An appropriate
analytical method is required to study the pharmacokinetic, therapeutic and
toxicological effects of such new entities.
The present work is focused on developing analytical techniques for multi-component
dosage forms without prior separation.
The aim of the study is to develop rapid, sensitive, simple and accurate methods like
UV, HPLC, and HPTLC techniques for the following formulations.
1. Cilastatin sodium and Imipenem
2. Cilnidipine and Telmisartan
3. Naproxen and Esomeprazole magnesium
4. Alprazolam and Propranolol hydrochloride
5. Aspirin and Isosorbide Mononitrate
THE AIM AND SCOPE OF THE PROPOSED WORK ARE AS UNDER
To develop a simple, rapid and reliable methods by UV, HPLC and HPTLC
for simultaneous determination of selected formulations.
To validate the developed methods
The scope is the application of the validated methods for routine analysis
31
III.
LITERATURE REVIEW
1. Parra A et al., (1993) performed first and second derivative
spectrophotometry for the quantitation of mixture of Imipenem and Cilastatin
sodium compound that have closely overlapping spectral band. Beers law was
obeyed at concentration up to 100 mg/ml for Imipenem in both the first and
second derivative model and up to 75 mg/ml for Cilastatin in the first
derivative mode. Detection limits at the p=0.05 level of significance were
calculated to be 0.4 and 0.52 mg/ml of Imipenem and Cilastatin sodium
respectively in the first derivative mode and in a range of from 0.45 to
0.68mgm/ml for Imipenem in the second derivative mode. The method which
is rapid, simple and does not require a separation step has been successfully
applied to the assay of commercial injections.
2. Forsyth et al., (1994) described a UV spectrophotometric assay to measure
the concentration of the active drug components (Imipenem & Cilastatin) or
primaxin for routine release testing. The assay is based on the use of first order
derivative spectrophotometry. The trough amplitude in the first derivative
spectrophotometric spectra at 243 nm and 318 nm were selected to determine
Cilastatin and Imipenem respectively. A linear relationship (R>0.99) between
the trough amplitude and concentration were demonstrated over the range
14-42 mg/ml for both drug components.
3. L Garcia-Capdevila et al., (1997) developed a rapid and simple HPLC
method for the determination of Imipenem in human plasma. After blood
collection, plasma was separated by centrifugation and immediately stabilized
with 3-morpholino propane sulfonic acid (MOPS) and ethylene glycol (1:1).
32
ultrafiltration. The mobile phase was boric acid buffer. The Imipenem was
detected at 300nm and Cilastatin co-administered did not interfere. Calibration
curve in human plasma was linear from 0.1 to 100 mcg/ml. The limit of
detection was 0.03mcg/ml. Inter-day precision at 0.1mcg/ml. Only 250 of
plasma were required in our assay. Due to the limited stability of Imipenem,
stability studies in plasma were done to established storage conditions. The
assay was applied to pharmacokinetic studies in patients.
4. Gandhimathi M et al., (2003) developed simple and accurate method for
simultaneous determination of Aspirin and IsosorbideMononitrate in
formulation by reverse phase high pressure liquid chromatography. The
method was carried out on a Thermo quest C-18 Column using a mixture of
water – methanol (water pH Adjusted to 3.4 using dilute phosphoric acid) and
detection was carried out at 215 nm using chlorzoxazone as internal standard.
5. Aparicio I et al., (2006) developed and validated an analytical method for the
simultaneous determination of Imipenem and Sulbactum in mouse plasma.
Analytical determination was carried out by high performance liquid
chromatography with diode array detection. Chromatographic separation was
achieved within 11 min on a C18 column by gradient elution with borate buffer
[0.1mM pH 7.2] and methanol. Imipenem and Sulbactum were monitored at
295 nm and 230 nm respectively.
6. Wankhede SB et al., (2007) described a validated reverse phase high
performance liquid chromatographic method for simultaneous estimation of
Telmisartan and Hydrochlorothiazide in tablet formulation. Chromatography
was performed on a ODS hypersil C- 18 (25 cm x 4.6 mm ID) column from
thermo isocratic mode with mobile phase containing acetonitrile: 0.05 M
33
monitored at 271 nm. The selected chromatographic conditions were found to
be effectively separate Telmisartan (RT – 5.19 min) and hydrochlorothiazide
( RT - 2.97 min) .
7. GirijaBhavar, VA chatpalliwar (2008) devised a simple, accurate and
precise HPTLC method for estimation of propanol hydrochloride from bulk
drug and tablet formulations. The separation was achieved on TLC plates
using Isopropanol: ethyl acetate: ammonia (1:8.5:0.5, V/V/V) or mobile phase.
The spots so developed were densitometrically scanned at 290nm. The
linearity of the method was found to be within the concentration range of
200-2000 ng/spot. The validation parameters tested in accordance with the
requirements of ICH guidelines, prove the suitability of this method. The
method was successively applied for determination of drug in tablets, wherein
no interference from tablet excipients was observed.
8. Lee et al., (2008) developed a LC-MS /MS method for the analysis of
Cilnidipine in human plasma. A water 2795 liquid chromatography was used.
The stationary phase was capeellpak UG 120 CN column (50X 2 mm, 5 µm
particle sizes). The column temperature was maintained at 40οC. The mobile
phase consist of 10 mM ammonium acetate buffer and methanol (70:30, v/v)
adjusted to pH 5 with acetic acid and was isocratically delivered at 0.2 ml/
min. The injection volume was 10 µl. The total run time was 3 min.
Calibration curves for Cilnidipine were constructed over the range from 0.1 to
30 ng/ml. Correlation coefficient was 0.9999. The limit of quantification was
0.1g/ml.
9. PrabhatAgarwal et al., (2008) developed a accurate, precise and economical
bio analytical method for the simultaneous determination of Imipenem and
34
10.Shah N N et al., (2009) described a simple, rapid, sensitive and accurate UV
spectrophotometric method for simultaneous estimation of esomeprazole
magnesium and naproxen in dosage form. In (40%v/v) methanol, naproxen
and esomeprazole magnesium showed absorbance maxima at 262 nm and
302nm respectively.
11.Sujana K et al., (2010) explained a simple, selective, precise and stability
indicating RP-HPLC method for analysis for Telmisartan in pure and
pharmaceutical dosage form. The chromatographic conditions comprised of a
reverse phase C-18 column (4.6mm x 150 mm x 3.5 µm) with a mobile phase
composed of buffer and methanol (40:60 % v/v, adjusted the pH to 3 with
ortho-phosphoric acid). Flow rate was 0.5ml/min. Detection was carried out at
230 nm. The retention time of Telmisartan was 2.6 min.
12.Patel VA et al., (2010) described a HPTLC method and validated for the
simultaneous estimation of Telmisartan and Ramipril in a combined dosage
form. The method was carried out in TLC pre-coated silica gel on aluminum
plate 60 F 254 (10 cm x 10 cm, pre-washed by methanol and activated at 60º C
for 5 min. prior to chromatography). The solvent system was Acetone:
Benzene: Ethyl Acetate: Glacial Acetic acid in the proportion of 5: 3: 2: 0.03
(v/v/v/v) with Rf value of Telmisartan and Ramipril was 0.673 and 0.353
respectively.
13.Madhuri et al., (2010) recorded a simple, accurate and precise
spectrophotometric method for simultaneous estimation of Aspirin and
Clopidogrel bisulphate by employing second order derivative zero crossing
method. The second order derivative absorption spectra at 254 nm (zero cross
point of Aspirin) were used for Clopidogrel bisulphate and 216 nm (zero cross
35
individual constituents under stabilized conditions is very high and ranges
from 99.68% to 100.18%. A good accuracy and precision of simultaneous
determination of Clopidogrel bisulphate and Aspirin were confirmed by
statistical analysis.
14.Chaudhary AK et al., (2010) devised a simple, rapid, accurate and economic
reverse phase HPLC method for the determination of DEHP [di (2-ethyl
hexyl) phthalate] in reconstituting diluents and reconstituted solutions of
Imipenem and Cilastatin for injection. As per requirements of various
regulatory authorities of different countries, DEHP contents need to be
monitored in reconstitution. The method utilizes C18 column (250 x 4.6 nm,
5µ) and a mixture of methanol, propan-2-ol and water as mobile phase. DEHP
was detected at 225nm.
15.Shubhangi M Pawar et al., (2010) described a new, simple, precise and
accurate HPTLC method for simultaneous quantitation of Domperidone
maleate and Naproxen sodium as the bulk drug and in tablet dosage form.
Chromatographic separation of the drugs was performed on aluminum plated
pre-coated with silica gel 60 F254 as the stationary phase and the solvent
consisted of Toluene: Methanol: Acetone (8:2:2, v/v/v). Densitometric
evaluation of the separated zones was performed at 266nm. The two drugs
were satisfactorily resolved with RF values 0.44±0.02 and 0.56±0.02 for
Domperidone and Naproxen respectively. The method was linear in the
concentration range of 20-140 ng/spot for Domperidone and 500-3500
ng/spot for Naproxen
16.Sunil Jawla et al., (2010) developed and validated a simple isocratic HPLC
method for simultaneous determination of Telmisartan and Ramipril in
36
column, 5m, 250 mm v 4.60mm id with flow rate of 1.5ml/mm using PDA
detection at 210nm. The separation was carried out using a mobile phase
consisting of potassium dihydrogen phosphate buffer having pH 2.8 and
Acetonitrile in the ratio of 60:40 respectively. The retention time for
Telmisartan and Ramipril was found to be 5.7min and 10.8min respectively. A
linear response was observed over the concentration range of 2.5-25.5 ppm
and 3.0-7.25 ppm for the assay of Telmisartan and Ramipril respectively. The
limit of detection and the limit of quantitation for Ramipril were found to be
0.75ppm and 2.5ppm respectively and for Telmisartan were found to be
1.25ppm and 3ppm respectively. The result of analysis was validated
statistically and by recovery studies.
17.RekhaGangola et al., (2011) developed a simple, sensitive, specific and
economic spectrophotometric method for simultaneous estimation of
Hydrochlorothiazide and Telmisartan in tablet dosage form. In dual
wavelength method, Hydrochlorothiazide and Telmisartan were quantified
based on the absorption difference between two points on mixture spectra is
directly proportional to concentration of components of interest. The accuracy
and reproducibility of the proposed method was statistically validated by
recovery studies.
18.Tulja Rani G et al., (2011) developed a new, simple precise and accurate RP-
HPLC method for simultaneous estimation of Propranolol hydrochloride and
Alprazolam in bulk and formulation. Chromatographic separation was
achieved on a waters C-18 column using acetonitrile: water (adjusted to pH
2.3 with ortho phosphoric acid) in the ratio of 60: 40 v/v as mobile phase.
37
drugs were satisfactorily resolved with retention time values 1.737 min and
3.810 min for Propranolol hydrochloride and Alprazolam respectively.
19.Deepak Kumar Jain et al., (2011) devised a simple, precise, reliable, rapid,
sensitive RP-HPLC method to determine Esomeprazole magnesium and
naproxen in synthetic mixture form. Chromatographic separation was
achieved isocratically on Phenomenex, Luna C-18 column (5µm,
150mmX4.6mm) and acetonitrile: Phosphate buffer (pH7.0) in the ratio of
50:50 (v/v) as the mobile phase, at a flow rate of 0.5ml/min. Detection was
carried out at 300nm. The retention time for naproxen and Esomeprazole
magnesium was found to be 2.67± 0.014 and 5.65±0.09 min respectively.
Parameters such as linearity, precision, accuracy, recovery specificity and
ruggedness are studied as reported in the ICH guidelines. The method was
linear in the concentration range of 5--250µg/ml for Esomeprazole with
correlation coefficient of 0.9999 and 0.998 respectively.
20.Suresh Kumar et al., (2011) described a sensitive, accurate and rapid reverse
phase chromatography coupled tandem mass spectroscopy (LCMS/MS)
method to estimate Telmisartan in human plasma. Detection was made at m/z
513.2/ 469.3 for Telmisartan and 344/193.8 for internal standard using ESI
negative ion spray ionization mode. Analyst 1.51 software was used for the
quantification. The stationary phase was high purity advanced C-18, 50x4.6
mm, 5 µm. The separation method developed produced recovery of 84.67%.
the retention time of analyte and internal standard were 1.38 and 1.41 minutes
21.Vani P et al., (2011) developed and validated a simple, sensitive and precise
high performance liquid chromatographic method for estimating the contents
of Naproxen and Esomeprazole simultaneously in commercial pharmaceutical
reversed-38
phase column by use of mobile phase consisting of 0.05M potassium
dihydrogem phosphate (pH 7.0) and Acetonitrile (70:30 v/v) at a flow rate of
1.0ml/ min with detection wavelength at 286nm. The linearity range was
100-200 mcg/L for Naproxen and 4-8 mcg/L for Esomeprazole. The recovery
found was more than 99% for both the compound.
22.Vijayakumar G et al., (2011) published a simple, selective, linear, precise
and accurate RP-HPLC method for rapid assay of Telmisartan in serum
samples. Isocratic elution at a flow rate of 1 ml/min was employed on an
Equasil, 250X4.6 mm, 5µ at ambient temperature. The mobile phase consists
of Buffer: Acetonitrile (35:65v/v). The UV detection wavelength was 282 nm
and 20µl sample was injected. The retention time of Telmisartan was 3.32
min.
23.RakeshPrajapati et al., (2011) documented a stability indicating HPLC
method for Alprazolam and Propranolol hydrochloride in combined dosage
form. The method was validated by subjecting the drugs to forced
decomposition under hydrolysis, oxidation, photolysis and thermal stress
conditions prescribed in ICH guidelines. The drugs were successfully
separated from major and minor degradation products on a RP C18 column by
using phosphate buffer (pH 4) acetonitrile: methanol (55: 35: 10 % v/v) as the
mobile phase with detection at 254 nm. The flow rate was 1ml/min.
24.Demetriades JL et al., (2011) reported a procedure for quantification of
Cilastatin in human plasma and urine. The assay involved sample purification
on a C18 extraction cartridge, reversed phase high performance liquid
chromatography with post column derivatization and fluorescence detection.
39
200 µg/ml in urine. The limits of reliable detection were 0.75 and 2.5µg/ml in
plasma and urine respectively.
25.Neha A Jain et al., (2011) described an accurate and specific and précised
UV Spectrophotometric method for the simultaneous determination Naproxen
and Esomeprazole in a laboratory mixture of these two components. The
method involved the area under the curve (AUC) method in the range 227-237
nm and 296.5- 306.5 nm, formation of simultaneous equation at 232 nm and
301.5 nm respectively, absorption correction method at 232 nm max of
naproxen, 239.2 nm isoabsorptive point of Naproxen & Esomeprazole and
301.5nm for absorption ratio method by using methanol as a solvent.
26.PalavaiSripal Reddy et al., (2011) reported a simple, precise cost effective
and stability indicating RP- HPLC method for Naproxen and Esomeprazole in
pharmaceutical formulations by RP-HPLC separation of naproxen and
esomeprazole achieved on a X terra RP-18 Colum (150X4.6mm, 5 µ) using a
mobile phase consisting of buffer prepared with 0.005 mole of sodium
perchlorate, 5 ml of n- butyl amine in milli-Q grade water with a pH of 8.7
which was mixed with acetonitrile and methanol at a flow rate of 1.5ml / min.
Wave length chosen for detection is 305 nm. The retention times of Naproxen
and Esomeprazole peaks were around 3 and 6 minutes respectively.
27.ChandrakantSojitra et al., (2012) published a rapid, specific, sensitive and
simple high performance liquid chromatography for simultaneous estimation
of Naproxen and Esomeprazole in combined pharmaceutical formulations.
The separation was achieved by SUPELCO 516 C18 column (250 x 4.6 µm,
particle size 5 µm) with mobile phase consisting of 0.01M phosphate buffer
pH 4.5: acetonitrile: Methanol (40: 50: 10 v/v/v, addition of 0.1% triethyl
40
Retention time of Esomeprazole and naproxen was found to be 4.6 and 3.2
min respectively.
28.Mitul Patel et al., (2012) studied novel, simple, sensitive and rapid
spectrometric method for simultaneous estimation of Naproxen and
Esomeprazole magnesium trisilicate in tablet dosage form. The method
involved solving simultaneous equations based on measurement of absorbance
at two wavelengths 276nm and 302 nm respectively.
29.DeshpandePadmanabbh et al., (2012) devised a new simple high
performance thin layer chromatography (HPTLC) method for determination of
Cilnidipine and Telmisartan in combined dosage form and validated. The
separation was carried out on Merck aluminum plates pre coated with silica
gel 60 F254 using toluene : methanol : ethyl acetate (8:2:1 v/v)as the mobile
phase and the detection was carried out at 260 nm. Results were linear in the
range of 200-1200 ng/band for Cilnidipine and 800-4800 ng/ band for
Telmisartan.
30.Devanand B Shinde, Kiran R Patil et al., (2012) developed a simple, rapid
and precise method for the quantitative simultaneous estimation of
Telmisartan and hydrochloride-thiazide in combined pharmaceutical dosage
form. A chromatographic separation of the two drugs was achieved with an
ACE 5 C18 (250x4.6 mm) analytical column using buffer acetonitrile 55:45
v/v. the buffer used in mobile phase contains 0.1 M sodium perchlorate
monohydrate in double distilled water pH adjusted 3 with trifluro acetic acid.
The detection was carried out at the wavelength of 215 nm using a photodiode
array detector. The correlation coefficient for Telmisartan and
41
31. Yogeshwari S Bhangale et al., (2012) devised a simple, accurate and precise
densitometry method for the simultaneous estimation of Metoprolol succinate
and Isosorbide Mononitrate in combined capsule dosage form and validated
separation of drug was carried out using methanol. Ethyl acctate: triethylamnie
(6:4:0.1, v/v/v) as mobile phase on precoated silica gel 60 F254 plates. The
densitometric evaluation of band was carried out at 215nm. The retention
factor for Metoprolol succinate and Isosorbide Mononitrate were found to be
0.58 + 0.012 and 0.080 + 0.011 respectively. The method was validated with
respect to linearity, accuracy, precision and robustness as per ICH guidelines.
Results were found to be linear in the concentration range of 1000-7000 ng/
band for Metoprolol succinate and 3000-9000 ng/band for Isosorbide
mononitrate respectively. The method has been successfully applied for the
42
IV.
MATERIALS AND METHODS
4.1 REFERENCE STANDARDS
The following drug samples were obtained from Lupin Ltd., J.B Chemicals &
Pharmaceutical Ltd, Mumbai, Orchid Pharmaceuticals and Malladi Pharmaceuticals
Chennai. They certified the purity of the drugs.
s.no Sample name Gift sample from
1. Naproxen Lupin Limited, Pune
2. Esomeprazole Lupin Limited, Pune
3. Propranolol hydrochloride Lupin Limited, Pune
4. Alprazolam Malladi Drugs and Pharmaceuticals Ltd. Chennai
5. Aspirin Lupin Limited, Pune
6. Iso-sorbide mono nitrate Lupin Limited, Pune
7. Cilnidipine J.B Chemicals & Pharmaceutical Ltd, Mumbai
8. Imipenem Orchid chemicals and pharmaceuticals Ltd,
Chennai
9. Cilastatin sodium Orchid chemicals and pharmaceuticals Ltd,
Chennai
43
4.2 REAGENTS AND INSTRUMENTS
REAGENTS
All the solvents used in spectrophotometric analysis were of analytical reagent grade
Potassium di-hydrogen phosphate, methanol, toluene, ortho-phosphoric acid, sodium
hydroxide, formic acid, n- Hexane, ammonium acetate, isopropyl alcohol used in
HPTLC and HPLC were of analytical grade.
Methanol and water used in HPLC were of HPLC grade.
INSTRUMENTATION
The following instruments were used for the purpose of Research work.
UV Spectroscopy:
A Schimadzu spectrophotometer, Model no.1700 with 1 cm matched quartz
cells were used for the experimental work. The absorption spectra of the reference and
test solution were carried out in a 1cm quartz cell over the range of 200-400 mm. A
Schimadzu electronic analytical balance (AUX-220) was used for weighing the
samples. An ultrasonic cleaner was used for sonicating the tablet sample solution.
High Performance Liquid Chromatography:
The analysis of the drugs were carried out on a SCHIMADZU HPLC system
equipped with a reverse phase C18 column (250 x 4.6 mm, 5µm in particle size) a
LC-20 AT prominence liquid chromatography, a 20µl injection loop and SPD-20A
44
High Performance Thin Layer Chromatography:
Camag HPTLC systems with Camag linomat IV automatic sample applicator
were used for HPTLC methods. Saturation was done on Camag Twin-through
chamber (10x10cm). Camag TLC scanner 3 and Camag Wincats software and Merck
HPTLC plates coated with silicagel 60 F 254 (0.2 mm thickness) on aluminum sheets
were used.
METHODS
UV, HPLC & HPTLC methods were developed and validated for the following
combination of formulations.
i. Cilnidipine and Telmisartan
ii. Cilastatin sodium and Imipenem
iii. Naproxen and Esomeprazole magnesium
iv. Alprazolam and Propranolol hydrochloride
45
4.3 PHARMACEUTICAL FORMULATION USED
The following drug samples were procured from the local market for the purpose of
developing analytical methods.
1. Cilacart-T
Each tablet contains
Telmisartan - 40mg
Cilnidipine - 10mg
2. Naproxen and Esomeprazole magnesium tablets
(generic tablets obtained from Lupin)
Each tablet contains
Naproxen - 500mg
Esomeprazole magnesium -20mg
3. Cilanem injection
Powder for intravenous injection
Cilastatin sodium - 250mg
Imipenem - 250mg
4. Nitren
Each tablet contains
Aspirin - 50mg
Isosorbide mononitrate - 10mg
5. Alprine
Each tablet contain
Propranolol hydrochloride - 10mg
46
4.4
DEVELOPMENT AND VALIDATION OF ANALYTICAL
TECHNIQUES
4.4.1 DEVELOPMENT AND VALIDATION OF ANALYTICAL
TECHNIQUES FOR SIMULTANEOUS ESTIMATION OF NAPROXEN AND ESOMEPRAZOLE MAGNESIUM
4.4.1.1 Development of UV Spectrophotometry (Simultaneous Equation Method) for Simultaneous Estimation of Naproxen and Esomeprazole magnesium.
Preparation of standard stock solution
A stock solution 1000µg/ml each of Naproxen and Esomeprazole magnesium
were prepared by dissolving separately 100mg of drugs in methanol.
For simultaneous estimation of Naproxen [NAP] and Esomeprazole
magnesium [EOZ], 10µg/ml each of Naproxen and Esomeprazole magnesium were
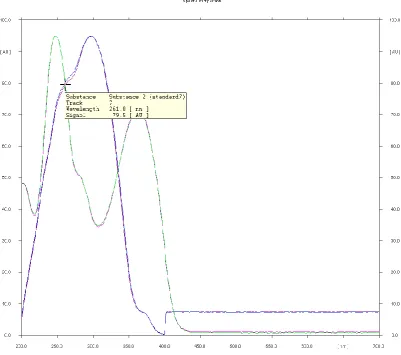
prepared by diluting appropriate volume of standard stock solutions. The scanning of
the solution NAP and EOZ were carried out in the range of 400-200nm to obtain the
overlain spectrum. Absorbance were measured and absorptivities of standard solution
were calculated at selected wavelength λ,(262nm) and λ2 (304nm) for Naproxen and
Esomeprazole magnesium respectively.
Preparation and analysis of Formulations
Twenty tablets were weighed and crushed to a fine powder. An accurately
weighed powder equivalent to 100mg of Naproxen and 4 mg of Esomeprazole
magnesium was transferred to 100ml volumetric flask and dissolved in about 25ml of
methanol. After the immediate dissolution, the volume was made up to the mark with
47
Whatmann filter paper No.41 and was diluted to prepare the concentration of
100µg/ml Naproxen and 4µg/ml of Esomeprazole magnesium. Absorbance of this
solution were measured at 262nm (λ max of Naproxen) and 304nm respectively (λ
max of Esomeprazole magnesium) and the amount of drugs present in the average
weight of tablet were obtained by substituting the values in respective simultaneous
equation.
A2 ay1 – A1 ay2
CNAP =
---X2 ay1 – ax1 ay2
A1 ax2 – A2 ax1
CEOZ =
---X2 ay1 – ax1 ay2
Where
i. ax1 and ax2 are absorptivities of NAP at λ1 and λ2 respectively
ii. ay1 and ay2 are absorptivities of EOZ at λ1 and λ2 respectively
iii. A1 and A2 are absorbance of mixtures at λ1 and λ2 respectively
iv. CNAP and CEOZ are concentration of Naproxen and Esomeprazole
magnesium respectively.
Validation of the proposed method
The proposed method was validated for the parameters like linearity, accuracy,
precision and robustness as per ICH guidelines.
48
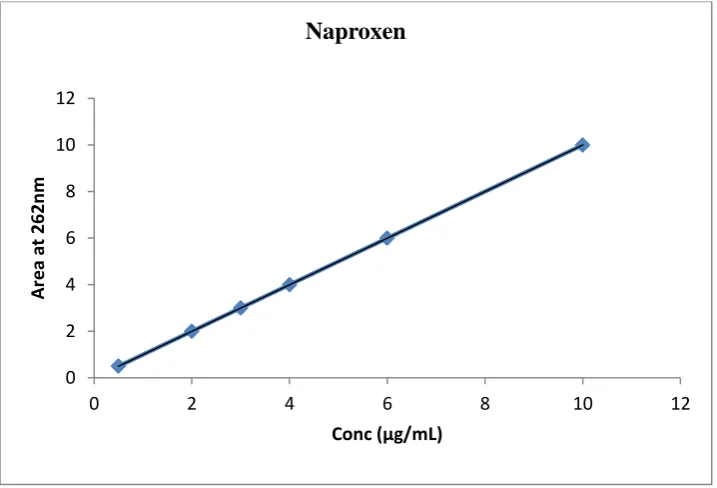
Linearity graph was plotted over a concentration range of 5 to 25 µg/ml of
Naproxen and 5-15 µg/ml of Esomeprazole magnesium. The absorbance of the
solutions were measured at 262nm and 304nm against methanol as blank. The
calibration curve was constructed by plotting absorbance versus concentration.
The regression analysis was carried out for the calibration graph to find out
correlation coefficient, y-intercept and slope of the regression line which estimates the
degree of linearity. The correlation coefficient was found to be 0.9984 for Naproxen
and 0.9981 for Esomeprazole magnesium.
Precision
Precision expresses the repeatability of the method under same operating
condition. The repeatability of the analytical method was established by estimating
the assay for six different sample preparation of the same batch and the %RSD were
determined.
Robustness
The robustness of the method was determined by subjecting the method to
slight changes in the spectrophotometric conditions. It was observed that there was no
marked change in the spectrum which demonstrated that the method developed is
robust.
Recovery studies. (Accuracy)
To check the accuracy of the developed method and to study the interference
of formulation additives, analytical recovery experiments were carried out by standard
addition method at 80,100 and 120% level. From the total amount of drug found, the
49
4.4.1.2 DEVELOPMENT OF RP-HPLC METHOD FOR THE
SIMULTANEOUS ESTIMATION OF NAPROXEN AND
ESOMEPRAZOLE MAGNESIUM
Initial chromatographic conditions were selected based on absorption,
solubilit