Versatile Optical Coherence Tomography system applied for imaging
of teeth
Bennett T. Amaechi*l, Adrian
Gh.Podoleanua2, J0 A. Rogers2, Susan M. Higham3,
ShaneDunne4, David A. Jackson2
'Dept. ofCommunity Dentistry, Univ. ofTexas Health Science Center, San Antonio, TX 78229,
USA; 2Applied Optics Group, School ofPhysical Sciences, Univ. ofKent at Canterbury, UK;
3Cariology Group, Dept. of Clinical Dental Sciences, Univ. of Liverpool, Liverpool, UK;
4Ophthalmic Technologies, Inc., Toronto, Canada.
ABSTRACT
The utility of a versatile multifunctional standalone Optical Coherence Tomography (OCT)/confocal system for imaging dental tissue was investigated. The system can collect A-scan (reflectivity versus depth graph), longitudinal (B-scan) and en-face (C-scan) OCT images, simultaneously with a confocal image. The power to the sample was 250 jiW, wavelength x= 850 am and the depth resolution in air was 16 jm. The OCT images showed caries lesions as volumes of reduced reflectivity. Transversal images (C-scan) showed the en-face slices of the tooth tissue like in confocal microscopy. Longitudinal images showed the depth ofthe lesion into the tooth tissue as well as the different structural layers of sound
tooth in the same way as seen in ultrasound images. A-scans preformed in locations selected in the en-face images
provided quantitative data about the reflectivity versus depth. The confocal channel was extremely useful for guidance and it has also shown the integral of the intensity over depth at transversal locations. We concluded that OCT proved capable to detect an early caries lesion, to show the depth of the lesion into the tissue, and quantitatively assess the
degree of demineralisation.
Key words: Optical coherence tomography, low coherence mterferometry, dental imaging, caries diagnosis, demineralisation, confocal imaging, enamel, dental caries, optical methods
1. INTRODUCTION
For many years ragra2 has been used for caries diagnosis and restorative decision-making in dentistry. In addition to subjecting patients to ionising radiation, it is neither quantitative nor sensitive enough to detect very early lesions. Early dental caries can be remineralised with therapeutic agents if detected at an incipient stage. The effectiveness of these
therapies can only be determined with a method that can quantitatively monitor the change in the mineral status ofthe caries on a longitudinal basis. Other currently available diagnostic methods such as visual inspection and tactile examination with a probe3 and fibre-optic transillumination2' 'I,stillhave limitations in their ability to achieve this goal in that they can only
detect caries at a relatively advanced stage and cannot quantitatively assess the mineral status of the lesion. So it seems
appropriate to develop a method, which can effectively achieve the above objective without limitations.
Optical Coherence Tomography (OCT) is a new imaging modality, which may be seen as the optical analogue of ultrasound as long as longitudinal images are concerned (images which contain the optical axis, or in ultrasound
terminology, B-scan images). It is based on confocal microscopy and low coherence interferometry. The latter is an
absolute measurement technique, which allows high-resolution ranging5 and characterisation of optoelectromc
components6' '.The first application in the biomedical optics field was for the measurement of the eye length8. The potential of the technique for high resolution imaging of the tissue is often referred to as optical coherence tomography
(OCT)9. When applied to medical imaging, OCT is non-invasive, as low powers are used for wavelengths in the
therapeutic window 600-1300 urn.
*
Correspondence:[email protected]; phone: +1 210 567 3200; fax: +1 210 567 4587; www.uthscsa.edu; Dept. of Community
OCT could non-invasively, image the internal microstructures of biological tissues such as tooth'°'4, eye'5' 16,8, 17 and
scin17. Numerous reports proved the ability of OCT to provide high resolution images of dental tissues1°14. However, all previous reports refer to longitudinal OCT imaging only. The information which can be collected cutting the object axially is obviously limited. It would be more natural to see en-face slices in the tooth in the way we are used to see them when looking through a microscope. Therefore, we are taking advantage ofen-face OCT'5andofcombination ofthe
en-face OCT technology with confocal microscopy'6, both technologies developed initially for retina imaging, to further the application ofthe OCT into dental tissue imaging. We investigated the utility ofpresenting longitudinal (B-scan) as well as en-face images (C-scans) from the teeth to detect dental caries.
2. SYSTEM
Any OCT is built around a confocal microscope. However, in the system used in the present study'6' 18 aseparate confocal channel is provided.
STANDALONE
OCT/CONICAL INSTRUMENT
Figure1. Basicset up ofthe standalone OCT/CONFOCAL system where a separate confocal receiver diverts parts ofthe light returned from the tooth. SLD: Superluminescent diode; MX, MY: orthogonal galvanometer mirrors.
The apparatus (Figure 1) comprises an interferometer excited by a pigtailed superlumimscent diode (SLD), central wavelength X 0.85 j.tm, bandwidth & 20 nm, which sends 250 iW power to the tooth. The OCT system used was
reported elsewhere'6' 18 a configuration ofdirectional single mode couplers. In the sensing arm ofthe OCT, a splitting device redirects a part ofthe returned light from the tooth towards a photodetector, behind a lens and a pinhole, used in the confocal receiver. The design is such that the two images, OCT and confocal are in pixel to pixel
correspondence.
The OCT and confocal signals carrying the information about reflectivity are applied to a dual input frame grabber, which can display one or both ofthese signals under the computer control. The frame grabber is synchronised with TTL signals delivered by the two ramps generators controlling the galvanometer pair. For an image size of 3 mm x 3 mm in the transversal section ofthe object, the pixel size is 10 m, determined by the numerical aperture ofthe interface optics. In depth however, the depth resolution in the two channels is different. In the OCT channel, the depth resolution is governed by the spectral properties ofthe low coherence source, and is halfofthe coherence length ofthe source, i.e.
16 tm. The depth resolution in the confocal channel is 1 mm, dictated by the interface optic and the optics of the confocal receiver (the numerical aperture ofthe focusing lens and the pinhole diameter). Both resolutions are the Full Width HalfMaximum ofthe signal profile measured by moving axially a mirror as object, through the focus of the interface optics. The depth resolution ofthe confocal channel can in principle be improved to a few microns by using a high NA interface optics and a sufficiently small pinhole. However, as long as the OCT channel provides the depth
t
VARIABLE SCAN JI
FRAME GRABBER}'FOCAL
E4_-_4Conputrr-SIGNAL
Ramp
resolution, the depth resolution in the confocal channel is conceived to be poorer than in the OCT channel. In this way, a very small percentage ofthe signal reflected by the tooth is sufficient for the confocal channel and the majority of the signal is used in the OCT channel. A large depth of focus allows collection ofthe OCT signal without the need of dynamic focus'9. Ifthe depth offocus becomes similar to the coherence length, then the focus needs to be moved in synchronism with the translation stage in the OCT channel which determines the position in depth ofthe scatterer contributing to the OCT signal. This would complicate the system.
In the OCT channel, the signal is proportional to the square of the reflectivity and in the confocal channel to the
reflectivity encountered by the scanned beam in the corresponding (x,y) point, integrated over the coherence length in the OCT channel and over the depth of focus in the confocal channel.
The system can operate in different regimes. In the longitudinal OCT regime, only one scanner of the galvo-scanner pair is driven with a ramp at 700 Hz and the translation stage is moved for the depth range required in 0.5s.In
this case, an OCT B-scan image is produced either in the plane (x,z) or (y,z). The depth range was 1 mm in air for the images presented in this paper. The generation ofB-scan images differ from other reports on longitudinal OCT imaging6
9
wherethe B-scan image is constructed out ofA-scans (depth profiles ofthe reflectivity in depth).
In the transversal regime, one galvo-scanner is driven with a ramp at 700 Hz and the other galvo-scanner with a ramp at
2 Hz. In this way, a C-scan image, in the plane (x,y) is generated, at constant depth. Then the depth is changed by
moving the translation stage and a new C-scan image is collected. The en-face images of caries lesions in the present study were obtained in this way.
Ideally, to collect the reflectivity distribution from the volume of the tooth, the depth interval between successive scans should be much smaller than the system resolution in depth and the depth change applied only after the entire C-scan image collected. However, in practice, to speed up the acquisition, the translation stage was moved continuously at a low speed, of 50.tni/s.For the 2Hz frame rate this means 25p.tmbetween the frames, a slightly larger value than the depth resolution. In this way, 40 pair-frames from a volume in depth of 1 mm in air are acquired in 20 s.
The confocal image was useful for identifying the lesions, aligning the tooth and evaluating the overall map of
reflectivity along X or Y axis in the longitudinal regime or in the plane (x,y) in the transversal regime. In the longitudinal regime, the confocal image shows little variation in depth due to the large depth of focus used. However, the confocal channel may be very useful in vivo, when lateral movement of the patient in the scanning direction X or Y respectively picked up from the confocal image can be used to correct the OCT image.
3. METHODOLOGY
Fifteen freshly extracted bovine incisor teeth free from caries, cracks or enamel malformations were selected and
polished with pumice slurry to remove organic contaminants from the labial surface. The teeth were then painted with two coats of a non-fluorescent acid-resistant colourless nail varnish, except for an exposed window (2 mm x 2 mm) on the labial surface of the teeth. Caries-like lesions were then produced on each window by demineralisation of the teeth in acidic buffer solutions containing 2.2mM KH2PO4, 50mM acetic acid, 2.2mM of 1M CaCI2 and O.5ppm fluoride, at a
pH of 4520• Priorto demineralisation (bd) and following 3-day demineralisation (ad), A-, B-, and C-scan OCT images
of each tooth involving the window area were recorded. The OCT images were acquired as described in previous publications'5' 16 TheA-scan shows the depth (mm) resolved reflectivity (dB) ofthe tooth tissue and therefore was used to calculate the degree ofreflectivity, R (dB.mm) ofthe tissue at any depth, as described by Amaechi et al.21.
3. RESULTS
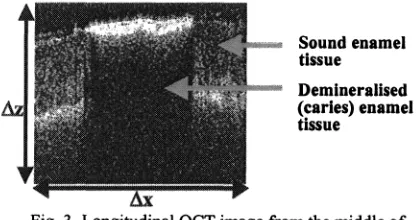
A pair of en-face OCT image and confocal image is displayed in Figure 2. Longitudinal OCT images, hardware
me
ofc*dsk Soundenamel
tissue
•:::.:.: Demineralised (caries) enamel tissue
—.——.OcT of
odes
Fig.2. Single frame ofOCT and confocal images. Fig. 3. Longitudinal OCT image from the middle of Lateral size: 5mmx 5mm. the transversal image in figure 2 showing a caries
lesion. =5 mm,
z =
0.6mm.f
-'.';
Ih. -.onu
I
;i:
I
::::
Fig.4. Longitudinal OCT image from the sound part
ofthe tooth in figure 2. This corresponds to a cut at . .
. . . Fig.5.Stackof42 pairs ofOCT and confocal images the beginning of exploration of the stack along Y . . .
viewedat different depths as indicated below each stopped at LY =0.1 mm .z =0.6mm.
frame. Lateral size: 5mmx 5mm.
42 frames containing both the OCT and confocal images were collected at 2 Hz. Then a stack of images (Figure 5and6) was constructed. Using a specialised software program, the stack can be explored in any directions, X, Y or Z. Figure 6
shows sections in the stack at different depths. Here the confocal image was used more for guidance, as the depth
information is in the OCT image. The 3D display shows the transversal appearance as well as longitudinal OCT images. Clicking on any of the faces of the stack, an exploration perpendicular on that face could be displayed. The transversal images show the en-face slices of the tooth tissue (including both sound and canons areas) from the tooth surface up to the maximum penetration depth (Figures 5and6). Due to the inclination of the object in relation to the optic axis, the transversal images display sections similar to the longitudinal images. The superior guidance allowed by the confocal channel as well as the views offered by the 3D display of stack of images allows precise selection of the (X,Y) point where an A-scan should be performed. Such A-scans could be either inferred from the stack of images or collected
hardware. Demineralisation of the tooth tissue is seen on the images as a decrease in reflectivity. An A-scan graph
(Figure 7) showed the levels of reflectivity (dB) versus depth (mm) of penetration into the tooth tissue. The decrease in reflectivity of the tooth tissue following demineralisation manifested in A-scan as reduction in the area under the graph (Figure 8). Quantitative analysis from the A-scans21 also confirmed the reflectivity loss following demineralisation.
Statistical analysis (paired t-test, w=O.05)showedthat the mean value of degree of reflectivity, R (dB.mm), after 3 days
[image:4.612.100.255.107.226.2] [image:4.612.299.508.122.232.2]The same internal structure as seen in the longitudinal images in Figures 3 and 4 could be noticed in the OCT images in Figure 5,6 and7. The layers identified in Figures 3 and 4 are clearly displayed in these images, although the OCT cuts (C-scans) are oriented perpendicular to the Z direction.
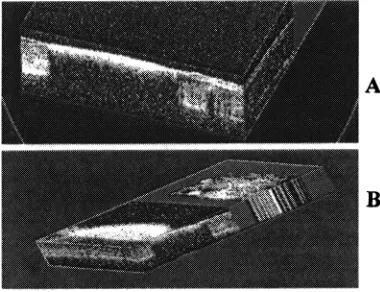
Fig. 6.Lateral views ofthe stack in figure 5.White
means higher reflectance and comes from the sound parts ofthe tooth. A: Stack in figure 5after
exploration along Y, stopped at Y =2.5 mm(middle ofthe tooth), showing a longitudinal slice in the plane (X,Z), which displays the X extension ofthe cavity;
B:Stackin figure 5exploredalong X and Y, stopped at X =3mm, Y =0.2mm, which shows the Y extension ofcavity in the plane (Y,Z) and longitudinal OCT image in the plane (X,Z) in the sound tissue.
.
Tooth surface.10
iVe.T2
LhIptktk()
Fig.7.A-scan graph demonstrating the different structural layers Fig. 8. A-scan graph demonstrating the decrease in m a sound tooth tissue lUthemiddle of the image m figure 5. . . .
reflectivityofthe tooth tissue followrngdemineralisation This manifested in A-scan as reduction in the area under the curve.
4. DISCUSION
The present study demonstrated that OCT can perform high resolution cross sectional imaging ofthe internal structure of the tooth in vitro and in real time, and it is believed that it can do same in vivo and in situ.
When in transversal regime, en-face images collected at different depths are subsequently used to reconstruct 3D
volumes of the tissue. The reconstruction allows software inferred OCT longitudinal images at any transversal position in the stack. The position in depth in the stack before creating longitudinal OCT images is also adjustable, offering a valuable guidance tool for exploring the 3D volume of the tissue. This is illustrated by movies showing either depth or lateral exploration along one of two possible different directions in the stack of transversal OCT images. The system,
equipped with the 3D rendering feature, acts as a valuable diagnostic tool allowing "peeling off' of transversal and longitudinal biologic material to investigate different internal features. The confocal image can also be displayed
sideways, along with the en-face OCT image at each depth. The software allows the reconstruction of the 3D profile to be seen from different angles. The longitudinal image (Figures 3) showed the depth of the dem.ineralisation (caries) inside the tooth tissue, thereby proving OCT to be a potential tool for decision-making in restorative dentistry, since the decision to remineralise or restore a caries lesion depends on the depth of the lesion into the tooth.
[image:5.612.290.393.326.394.2]reflectivity, polarisation and birefringence to discriminate between sound and demineralised tissue. The result of the present study demonstrated that OCT would be a suitable tool for routine examination in the dental clinic. It would also be applicable in an in vivo, in situ or in vitro testing of the efficacy of products formulated to inhibit demineralisation and/or promote remineralisation. Amaechi et have demonstrated the use of Ascan from OCT imaging to produce a quantitative data relating to the degree of change in reflectivity, and hence the degree of change in mineral level, of the tooth tissue following development of caries. The provision of quantitative data as well as giving information regarding depth, all without dangerous iomsing radiation, gives OCT superiority over the conventional x-ray technology which has been the tool for caries diagnosis for many years.
5. CONCLUSIONS
The present investigation demonstrated the utility of an OCT system which can show C-, B-, and A-scan images of the tooth tissue. Such an instrument can be a useful tool to both dentists and dental researchers. On examination of a tooth, the compounding information in rectangular directions, transversal and axial, allows better diagnosis than when using longitudinal OCT imaging only. Successive displays of transversal and longitudinal cuts at different positions in the 3D stack of en-face OCT images give a direct view of the caries volume. A-scan remains the best mode for quantitative
analysis of the activity (demineralisation or remineralisation) of the caries lesion over time, and therefore could be
exploited in the determination of the effect of caries therapeutic agents (e.g. fluoride mouthrinse, fluoride dentifrice) or laboratory testing of a new oral healthcare product. However, the 3D imaging mode demonstrated here helps in choosing the position ofthe A-scan in transversal section.
It is concluded that OCT could detect an early caries lesion, show the depth of the lesion into the tissue, and
quantitatively demonstrate the degree of demineralisation. Hence, it has the potential of detecting obscured caries such as canes underneath dental plaques, dental restorations and gum, and may possibly replace the conventional dental radiograph to eliminate the danger ofhazardous ionising radiation.
ACKNOWLEDGEMENT
The authors acknowledge the support of the Engineering Physical Sciences Research Council of the UK and Ophthalmic Technologies Inc., Canada.
REFERENCES
1 . A.Wenzel, M. J. Larsen, and 0. Fejerskov, "Detection of occlusal caries without cavitations by visual inspection,
film radiographs, xeroradiographs, and digitized radiographs". Caries Res 25, pp. 365-371, 1991.
2. A. Wenzel, E. H. Verdonschot, G. J. Truin, and K. G. Konig, "Accuracy of visual inspection, fibre-optic
transillumination, and various radiographic image modalities for the detection of occlusal caries in extracted non-cavited teeth". J. Dent. Res. 71, pp. 1934-1937, 19923. K. R. Ekstrand, I. Kuzmina, L. Bj4rndal, and A. Thylstrup, "Relationship between external and histologic features ofprogressive stages ofcaries in the occlusal fossa". Caries Res 29, pp. 243-250, 1995.
4. A. Schneiderman, M. Elbaum, T. Shulz, S. Keem and M. Greenebaum, "Assessment of dental caries with digital
imaging fibre-optic transillumination (DIFOTVM): In vitro study". Caries Res 31, pp. 103-1 10, 1997.
5. S. A. Al-Chalabi, B. Culshaw and D. E. N. Davies, "Partially coherent sources in interferometric sensors", First
International Conference on Optical Fibre sensors, 26-28 April 1983, I.E.E. London, pp. 132-135, 1983.
6. R. C. Youngquist, S. Can, and D. E. N. Davies, "Optical coherence-domain reflectometry: A new optical evaluation technique," Opt. Lett. 12, pp. 158-160, 1987.
7. H.H. Gilgen, R. P. Novak, R. P. Salathe, W. Hodel, P. Beaud, Submillimeter optical reflectometry", Lightwave Technol.17,pp.l225-l233, 1989.
8. A.F.Fercher and E.Roth, "Ophthalmic laser interferometry", Proc. SPIE 658, pp. 48-51, 1986
9. D. Huang, E.A. Swanson, C. P. Lin, J. S. Schuman, W. G. Stinson, W. Chang, M. R. Hee, T. Flotte, K. Gregory, C. A. Puliafito and J. G. Fujimoto, 'Optical coherence tomography', Science 254, pp. 1 178-1 181, 1991.
(ssid
UI) IOOZ 'SZqvq
po
r
11mpooidAii2Uflb
:sugo
piwssssi
ioj
i(qdvowoj
3U1tjO3
j3dO
JO Sfl11 UOS)IOf.v
•u
pu
'sio)j
•y
•f'nUjopod
IO
V'
W!H
J4J S'!T°"V
L
H TZ 8661 '8Z9-619dd',
joig
•ipj
o.qt
in uiAoq U! SUO!S! SflOU3 JO*uudopAp
&I!33JJ S1OOJ,,'ip
JAJjU
'UJtjH
N
S'N°'V
J. H 0Z 16Z18Z dd'ioj
'nIuo
'6661 '91-ZItudy
'siosu
!gdo
uo •JU03 Ui3UJ
'IISdO
'P
OH
)I
'U!(
AI
'9iiL
JJ'
OJJ
'I3O
&IISfl pinbijjoiojoiq
jo
ojj
pds
Jo
UOUWU
3OJ1OO IOJpijdd
snooj 'UoS)j3fy
a
pU
'sioj
r
j
'tlUjopOd
q0V
6T 6661 'LZIZ9I IZ dd'g
'ide
/ddV'doosowjmnjdo
&TUU3S !OOJUO3pu
(qdiotuo
Uitjoo
joIdo
puiqwoo
jo
SISXjUys!oN,,
'uos,pEfy
j
pu
'110 iT 81 .000z86Z6Z
dd 'L ssaidxgjd
UDjspu
vupi
moij
smrn
ico
juomp
UUflQ •Spu
'UOS)3f V U 'S1O).Jy
f
'flU12jopOdIO
'V L1 8661 '06011801 dd'
•;ip7 •uoJJ3a/q'doosowjipqdo
isj
&inius
pu
qdiowoi
OUoitjoO jgoido prnqwo3,,'uos)pf
11 QpU
flUjOO
qtYV 9T 866! 'OZ-ZI dd'
'soidcjptuo
j
iiuioojpi
ouiqoo
&I!Sfl U!A!IflJO
mII
tj
wag
s2vuii
!U!P4!UOIPU
jS1ASU1J,,)jZP
J
pU
UOS)fOfy
'qqM
i
'ci'iqo
jsj'1s
'nuiopod
v
•ci 8661'8ZOZ
dd'
'1f
11 S'I2'S
1
HAjSQ
'2IO1AffJAJd
'AO13g's
i*ua,,
'jo
øo
ssaidxg'UOSjO37
jj
Aqdiowo
jUpJO
1snuoiuis
aoj
aidggjc
dd '9J-Øj 8661uiqoo
j3d0
dV1'1°'d
P
'11dS M 'ZU0}J V 'UUU1US H'qoic
s
'iiquzpj-
)13 VI
jgoido OUOJIjOOtjd1owo
jupjo
sm3otus
sauv
saj
dd '69-6c 000Zpur