Contents iii
Preface iv
Abstract v
Abbreviations vii
List of Figures ix
List of Tables xviii
1 Introduction 1
2 Literature Review 7
2.1 Introduction . . . 7
2.2 Modelling methods . . . 15
2.3 Radiation damage/hardening mechanisms . . . 17
2.4 Displacement cascades . . . 19
2.5 Dislocation-obstacle interactions . . . 22
2.5.1 Dislocations . . . 22
2.5.2 Point defects . . . 25
2.5.3 Voids . . . 27
2.5.4 Solute atom precipitates . . . 31
2.5.5 Dislocation loops . . . 34
2.6 Summary . . . 41
3 Methodology 43 3.1 Introduction . . . 43
3.2 Molecular Dynamics . . . 44
3.3 Interatomic Potentials . . . 48
3.4 Computational Model . . . 49
3.4.1 Specifics of interatomic potentials . . . 55
3.5 Visualisation . . . 59
3.6 Hardware Specifics . . . 60
3.7 Summary . . . 61
4 Single Straight Dislocations 62 4.1 Introduction . . . 62
4.2 Edge dislocations . . . 63
4.2.1 Dislocation core structures . . . 63
4.2.2 Peierls stress . . . 69
4.2.3 Stress-strain dependence forT>0 K . . . 73
4.3 Screw dislocations . . . 74
4.4 Summary . . . 78
5 Edge dislocation-void/Cu precipitate interaction 80 5.1 Introduction . . . 80
5.2 Edge dislocation-void interaction . . . 82
5.2.1 Results . . . 82
5.2.2 Discussion . . . 87
5.3 Edge dislocation-Cu precipitate interaction . . . 90
5.3.1 Results . . . 90
5.3.2 Discussion . . . 94
5.4 Comparison of void and precipitate effects . . . 97
5.5 Summary . . . 100
6 Edge dislocation-SIA loop interactions 120 6.1 Introduction . . . 120
6.2 111 dislocation loops . . . 121
6.2.1 Methodology . . . 121
6.2.2 Results . . . 122
6.2.3 Reactions at T=1 K . . . 125
6.2.5 Reaction at T=300 K and under high strain rate . . . 127
6.2.6 Discussion . . . 127
6.3 100 dislocation loops . . . 128
6.3.1 Methodology . . . 128
6.3.2 Results . . . 132
6.3.3 Reaction with highτc: C6, bL=[001] . . . 134
6.3.4 Reaction with moderate τc C5: bL=[010] . . . 135
6.3.5 Reaction with moderate τc. C4U: bL=[100] . . . 136
6.3.6 Reaction with low τc. C2: bL=[100] . . . 137
6.3.7 Effects of the interatomic potential: C4 . . . 138
6.3.8 Discussion . . . 141
6.4 Summary . . . 144
7 Discussion and conclusions 156 7.1 Introduction . . . 156
7.2 Comparison of results . . . 157
7.3 Future work . . . 160
7.4 Epilogue . . . 161
Before starting the discussion about the research conducted and results obtained within the framework of this Ph.D. project, I wish to thank my supervisor, Prof.
D. J. Bacon for his support, both personal and academic, throughout the whole
period of my study. Having worked under his guidance and supervision, I have
learnt a lot not only about my subject field, but also about professionalism,
management, presentation and academic ethos. His passion about science and
the enjoyment he gets out of his job are inspirational for a student just beginning
his career.
My gratitude also goes to Dr. Y. N. Osetsky, whose help, guidance and advice
has been invaluable. Practically all of the work presented in this thesis is based
on his simulation codes; his contribution to knowledge in the field of radiation damage is outstanding, and it has been a privilege working with him.
I would also like to thank Dr. A. F. Calder for his support and technical
guidance. When serious technical problems occurred, he saved the day (and,
arguably, my thesis). Special reference has to be made about Dr. A. V. Barashev
for his advice, academic and otherwise. I consider myself honoured to call him
not only a colleague but also a friend. I have also had valuable help by other
members of the Materials Modelling Group of the Department of Engineering of
the University of Liverpool. My thanks goes to Dr A. C. Arokiam, Dr. H. Khatter and Dr. K. Tapasa and to Dr. D. Terentyev of SCK-CEN, Mol, Belgium.
On a more personal note, I would be ungrateful to forget the support I have
had from my friends and family, who helped me maintain my balance throughout
this four-year roller-coaster ride.
Finally, I wish to thank the UK Engineering and Physical Sciences Research
Council for its financial support, which made this Ph.D. project possible.
Assessment of candidate materials for fusion power plants provides one of the major structural materials challenges of the next decades. Computer
simula-tion provides a useful alternative to experiments on real-life irradiated materials.
Within the framework of a multi-scale modelling approach, atomic scale
stud-ies by molecular dynamics (MD) and statics (MS) are of importance, since they
enable understanding of atomic interaction mechanisms invisible at coarser scales.
Nano-scale defect clusters, such as voids, solute-atom precipitates and
dislo-cation loops can form in metals irradiated by high-energy atomic particles. Since
they are obstacles to dislocation glide, they can affect plasticity, substantially
changing the yield and flow stresses and ductility. In this study, a model
devel-oped by Osetsky and Bacon [26] has been used, that enables dislocation motion under applied shear strain at various temperatures and strain rates. Three main
results were obtained.
First, the two interatomic potentials used (A97 [79] and A04 [31]) were
as-sessed with respect to reproducing dislocation properties. Both were in good
agreement but for one fact: an unexpected and not previously reported
displace-ment of core atoms along the direction of the dislocation line of a 1/2[111](1¯10)
edge dislocation was observed for the A97 potential. A connection of this
phe-nomenon with differences in Peierls stress values for the two potentials was pro-posed.
Second, the interaction of a 1/2[111](1¯10) edge dislocation with a number
of different configurations of spherical voids and Cu-precipitates 2 and 4 nm
in diameter was investigated. The defects were centred on, above and below
the dislocation glide plane. The mechanisms governing the interactions were
analysed. For the first time it was observed that by interacting with a void, the
dislocation can undergo both positive and negative climb, depending on the void
position. A bcc to fcc phase transition was observed for the larger precipitates,
in agreement with literature findings.
Third, the obstacle strength of 1/2111and 100 loops was obtained under various conditions and geometries for both potentials. Reactions are sometimes
complex, but could be described in terms of conventional dislocation reactions in which Burgers vector is conserved. The critical resolved shear stress for
disloca-tion breakaway and the fracdisloca-tion of interstitials left behind are wide-ranging.
Finally, a mapping of all obstacle strengths was created for the purpose of
comparison. 100 loops with Burgers vector parallel to the dislocation glide plane and 1/2111 loops proved to be strong obstacles. Small size voids are stronger than Cu-precipitates of the same size. The complexity of some reactions
and the variety of obstacle strengths poses a challenge for the development of
1-D– 1 dimensional 2-D– 2 dimensional
3-D– 3 dimensional
bcc– body-centred cubic
dpa– displacements per atom
fcc– face-centred cubic
ppt– precipitate
BOP– bond-order potentials
CFR– commercial fusion reactor
CISH– cascade-induced source hardening
CM– conventional model COW– cluster of workstations
CPU– central prossessing unit
D– deuterium
DD– dislocation dynamics
DEMO– demonstration power plant
DFT– density functional theory
EAM– embedded atom method
FE– finite element
FPMD– first-principles molecular dynamics
FR– fixed region
FS– Finnis-Sinclair
GFR– Green’s function region
GFBC– Green’s function boundary conditions
HREM– high-resolution electron microscopy
IAP– interatomic potential
IFMIF– international fusion material irradiation facility
ITER– international thermonuclear experimental reactor
JET– joint european torus
LDA– local density approximation
MARS– mirror advanced reactor study MD– molecular dynamics
MGPT– model-generalised pseudopotential theory
MR– mobile region
MS– molecular statics
NRT– Norgett-Robinson-Torrens
PAD– periodic array of dislocations
PBC– periodic boundary conditions
PBM– production bias model PKA– primary knock-on atom
QC– quantum chemistry
QMC– quantum Monte-Carlo
RAFM– reduced activation ferritic/martensitic
RBC– rigid boundary conditions
SIA– self-interstitial atom
T– tritium
TEM– transmission electron microscopy
1.1 Growth in the rate of energy use and in the sources of energy since 1860 in gigatonnes of oil equivalent per year [1]. . . 2
1.2 (a) Global mean surface temperature anomaly relative to
1961-1990 [4]. (b) Per capita annual energy use in tonnes of oil
equiva-lent in 1990 in different regions of the world [1]. . . 3
1.3 Layers of multiscale modelling [12]. . . 5
2.1 Binding energy per nucleon. [15] . . . 8
2.2 (a) Deuterium-tritium reaction [16]. (b) Fusion reaction rate [13]. 10
2.3 Tokamak fields [18]. . . 12 2.4 Schematic diagram of tokamak reactor [8]. . . 14
2.5 Temporal scales [25]. . . 16
2.6 Potential energy and applied stress versus applied strain in an Fe
crystal at T=0 K containing an edge dislocation gliding through
a 2 nm void [27]. . . 29
2.7 Summary of reactions between 1/2[111](1¯10) edge dislocations and
SIA loops in bcc crystals. . . 41
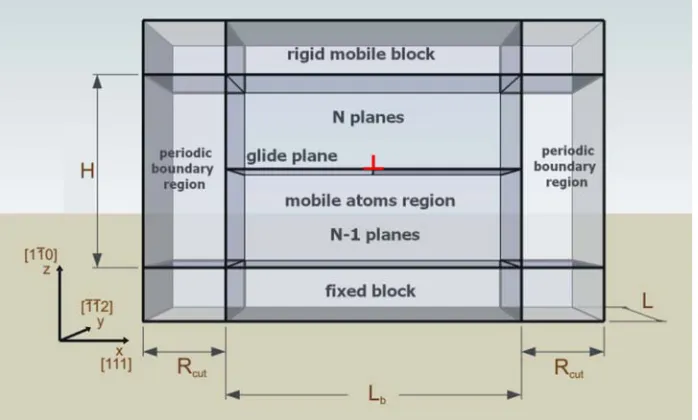
3.1 Schematic presentation of simulated crystallite. 1/2111 {110} edge dislocation (represented by red⊥) is constructed by removing one y-z half-plane from the bottom half of the crystallite. . . 51
3.2 (a) An edge dislocation in an unstrained bent crystal and (b) in a
strained crystal after the unbending into a rectangular shape [26]. 52
3.3 α0 vs. temperature for A97 potential. . . 56
3.4 Perfect crystal stress-strain plots for [111](1¯10) shear for different
temperatures, using A97 potential. . . 57
3.5 Shear modulus dependence on temperature for α-Fe, using both
A97 and A04. Symbol ×denotes the value at T=0 K obtained by MS using A97. . . 58
4.1 Relaxed core of edge dislocation for (a) A97 and (b) A04 potentials,
respectively. Arrow length represents differential displacement of
atoms along [111]. . . 64
4.2 (a) Differential displacements and (b) Burgers vector distributions
for edge dislocations for both potentials. . . 65
4.3 Elastic distortion of a cylinder produced by an edge dislocation. . 66
4.4 Displacements of atoms in a sphere around centre of crystal for
A97, viewed along (a) [111] and (b) [¯1¯12] axes. Twisting of atomic
planes near core is obvious from both perspectives. (Images cour-tesy of Suneel Motru) . . . 66
4.5 Twisting of atomic rows along [¯1¯12] for the edge dislocation in the
A97 model. (a) depicts four 1¯10 planes. Plane (III) is directly
above the slip plane, and presents the biggest deviation of atoms
along [¯1¯12]. (b) shows the [111] projection of all atoms initially in
two (¯1¯12) planes, before and after relaxation. Initially, atoms are
aligned in the two planes. When relaxed, some deviate along [¯1¯12],
especially near and above the slip plane. . . 67
4.6 Representations of one atomic row for edge dislocation created with A97 (notice that units are not equal in two axes, for better
presentation purposes). (a) shows row viewed along [¯1¯12] axis, and
(b) along [111]. In (b) point (A) is ‘close’ to the viewer, (B) on the
plane of the paper and (C) ‘inside’ the paper plane. The atoms of
the row, instead of lying on one (¯1¯12) plane, seem to form some
sort of a spiral. . . 68
4.7 Representations of one atomic row of edge dislocations created with
A97 (a) and A04 (b) potentials. Units are not equal for different
axes, but are the same for figures (a) and (b). It is obvious that
4.8 Comparison of Peierls stress of edge dislocation obtained by MS
with both A97 and A04 potentials. . . 71
4.9 Schematic illustration of the equipotential interaction energy
sur-faces for two rows of atoms directly above and below slip plane. Top row of atoms represents the bottom of the extra half-plane.
When no twisting has occured, (a), top atomic row has to ‘climb’
the whole Peierls barrier for the dislocation line to move, but when
all atoms are slightly displaced, (b), only partial climb over the
Peierls barrier is required. . . 72
4.10 MD results of shearing a crystal containing a perfect edge
disloca-tion using the A04 potential, for different strain rates and different
temperatures. . . 74 4.11 Differential displacement of atoms in [111] projection for screw
dislocation core (hard configuration) reproduced with A97, before
(a) and after (b) relaxation. Atoms in three adjacent (111) planes
are identified by the three different circle symbols. . . 75
4.12 Differential displacement of atoms in [111] projection for screw
dislocation core (easy configuration) reproduced with A97, before
(a) and after (b) relaxation. Atoms in three adjacent (111) planes
are identified by the three different circle symbols. . . 76
4.13 Comparison of relaxed screw dislocation cores for A04 (a) and
A97 (b) potentials. Dissociation in fractionals occuring for A97 disappears for A04. . . 77
5.1 Schematic illustration of the edge dislocation and spherical
ob-stacle (void or Cu-precipitate) in one periodic cell. The sense of
positive applied resolved shear stress, τ, is indicated by the block
arrows. . . 81
5.2 Schematic represntation of the configurations studied for both voids
and Cu-precipitates of diameters D=2 and 4 nm. . . 82
5.3 Strain energy and applied stress as functions of the applied strain,
5.4 (a) Dislocation line viewed in [111] projection perpendicular to b after intersecting voids of different sizes. The void diameters and
numbers of vacancies removed are indicated. (b) Position of atoms
in six consecutive (¯1¯12) planes through the centre of a 3 nm void after dislocation breakaway. The horizontal line indicates the trace
of the dislocation glide plane and the arrow indicates the exit step
on the void surface. Owing to dislocation climb, the exit step is two
(1¯10) planes above the glide plane. Both figures are reproduced
from Osetskyet al. [108]. . . 89
5.5 Strain energy and resultant stress as functions of the applied strain,
for the 4 nm Cu-precipitate configuration 0, at T=0 K. Regions
are denoted as in section 2.5.3. . . 90 5.6 (a) Depiction of three consecutive (1¯10) planes for configuration
-R/2, at 100 K and strain rate 1×10⁶ s−1, after dislocation break-away. The middle plane coincides with the dislocation glide plane.
On the left, the shear step at the entry surface can be seen. (b)
Two jogs are visible on the dislocation line, after breakaway. Their
position coincides with the strings of fcc arrangements, seen in
(a) and indicated by the arrows, and correspond to the positions
on the exit surface that the dislocation arms left the precipitate
surface at breakaway. . . 96
5.7 Temperature dependence of critical resolved shear stress for voids and Cu-precipitates in Fe strained at a rate 5×10⁶s−1. Reproduced from Bacon and Osetsky [35]. . . 97
5.8 Dislocation line shown by core atoms in the (1¯10) slip plane at
the critical stress for all configurations studied for defects 2 nm in
diameter at 0 K. Black and orange dislocation lines correspond to
reaction with void and precipitate, respectively. Numbers written
on the top of figure are critical stress values in MPa. . . 98
5.9 Dislocation line shown by core atoms in the (1¯10) slip plane at the critical stress for all configurations studied for defects 4 nm in
diameter at 0 K. Black and orange dislocation lines correspond to
reaction with void and precipitate, respectively. Numbers written
5.10 Critical resolved shear stress obtained for each configuration of
both defect sizes at temperatures (a) 0 K, (b) 100 K, (c) 300 K
and (d) 450 K. Shear strain rate was 5×10⁶ s−1. . . 100 5.11 Schematic representation of simulated configurations, stress-strain
curves for all temperatures and critical stress-temperature
depen-dence for voids 2 nm in diameter. . . 102
5.12 Schematic representation of simulated configurations, stress-strain
curves for all temperatures and critical stress-temperature
depen-dence for voids 4 nm in diameter. . . 103
5.13 Critical configurations for all reactions at all temperatures just
before breakaway for voids 2 nm in diameter. Order of obstacle
strength is noted by numbers 1 (highest) to 5 (lowest). Viewed along [1¯10]. . . 104
5.14 Critical configurations for all reactions at all temperatures just
before breakaway for voids 4 nm in diameter. Order of obstacle
strength is noted by numbers 1 (highest) to 5 (lowest). Viewed
along [1¯10]. . . 105
5.15 Shear step created for all configurations at all temperatures for
voids 2 nm in diameter. Order of obstacle strength is noted.
Dou-ble line represents dislocation glide plane. Dislocation glide
direc-tion from left to right. Viewed along [¯1¯12]. . . 106
5.16 Shear step created for all configurations at all temperatures for voids 4 nm in diameter. Order of obstacle strength is noted.
Dou-ble line represents dislocation glide plane. Dislocation glide
direc-tion from left to right. Viewed along [¯1¯12]. . . 107
5.17 Final configurations after dislocation breakaway at all
tempera-tures, for 2 nm voids, viewed along [111]. Pairs of superjogs are
created on dislocation line. Critical stress in MPa is noted above
each configuration. Order of obstacle strength is noted by numbers
5.18 Final configurations after dislocation breakaway at all
tempera-tures, for 4 nm voids, viewed along [111]. Pairs of superjogs are
created on dislocation line. Critical stress in MPa is noted above
each configuration. Order of obstacle strength is noted by numbers 1 (highest) to 5 (lowest). . . 109
5.19 Schematic representation of simulated configurations, stress-strain
curves for all temperatures and strain rates and critical
stress-temperature dependence for precipitates 2 nm in diameter. . . 110
5.20 Schematic representation of simulated configurations, stress-strain
curves for all temperatures and strain rates and critical
stress-temperature dependence for precipitates 4 nm in diameter. . . 111
5.21 Critical configurations for all reactions at all temperatures and strain rates just before breakaway for precipitates 2 nm in
diame-ter. Order of obstacle strength is noted by numbers 1 (highest) to
5 (lowest), when available. Viewed along [1¯10]. . . 112
5.22 Critical configurations for all reactions at all temperatures and
strain rates just before breakaway for precipitates 4 nm in
diame-ter. Order of obstacle strength is noted by numbers 1 (highest) to
5 (lowest), when available. Viewed along [1¯10]. . . 113
5.23 Shear step created for all configurations at all temperatures and
strain rates for precipitates 2 nm in diameter. Order of obstacle
strength is noted, when available. Double line represents dislo-cation glide plane. Dislodislo-cation glide direction from left to right.
Viewed along [¯1¯12]. Arrows connect equivalent configurations for
the same temperature but different strain rate. They point towards
the reaction of higher critical stress and their length illustrates the
5.24 Shear step created for all configurations at all temperatures and
strain rates for precipitates 4 nm in diameter. Order of obstacle
strength is noted, when available. Double line represents
dislo-cation glide plane. Dislodislo-cation glide direction from left to right. Viewed along [¯1¯12]. Arrows connect equivalent configurations for
the same temperature but different strain rate. They point towards
the reaction of higher critical stress and their length illustrates the
critical stress difference between the reactions. . . 115
5.25 Final configurations after dislocation breakaway at all
tempera-tures, for 2 nm precipitates, viewed along [111]. No superjogs are
created on dislocation line. Critical stress in MPa is noted above
each configuration. Order of obstacle strength is noted by numbers 1 (highest) to 5 (lowest), when available. . . 116
5.26 Final configurations after dislocation breakaway at all
tempera-tures, for 4 nm precipitates, viewed along [111]. Pairs of
super-jogs are created on some dislocation lines. Critical stress in MPa
is noted above each configuration. Order of obstacle strength is
noted by numbers 1 (highest) to 5 (lowest), when available. Also
visible are areas in precipitates of atoms which do not belong to
the original bcc structure. . . 117
5.27 Fraction of Cu atoms transformed into fcc-like structure for all
configurations studied, and the corresponding percentage. Order of obstacle strength is noted by numbers 1 (highest) to 5 (lowest),
when available. . . 118
5.28 Position of Cu atoms in three consecutive (1¯10) planes through the
centre of the precipitates of all configurations studied. Written on
the top right-hand side corner is the critical stress in MPa, and on
the bottom right-hand side corner is the order of obstacle strength,
when available. . . 119
6.1 Schematic illustration of the edge dislocation and SIA loop in one
periodic cell. The sense of positive applied resolved shear stress,
6.2 Projections of the initial configuration along the directions of the
three axes: (a) [111], (b) [¯1¯12] and (c) [1¯10]. . . 122
6.3 (a) Initial configuration, (b) final position of loop with its upper side on the glide plane and (c) dislocation bowing forwards, at-tracted by the loop, just before contact. . . 123
6.4 Summary of all shear stress vs. shear strain graphs. . . 124
6.5 Schematic illustration of the edge dislocation and SIA loop in one periodic cell. The sense of positive applied resolved shear stress, τ, is indicated by the block arrows. . . 129
6.6 Geometry of interactions considered and projections of the config-urations on the plane perpendicular to the dislocation line. Note that the loop Burgers vector, bL, does not lie in the (¯1¯12) plane of the paper. Reproduced from [99]. . . 130
6.7 Visualisation of different stages of reaction C6 (A04 potential) [99]. 134 6.8 Visualisation of different stages of reaction C5 (A04 potential) [99]. 135 6.9 Visualisation of different stages of reaction C4U (A04 potential) [99].136 6.10 Visualisation of different stages of reaction C2 (A04 potential) [99]. 137 6.11 Visualisation of different stages of reaction C4 (A97 potential) [99]. 138 6.12 Visualisation of different stages of reaction C4 (A04 potential) [99]. 139 6.13 Stress vs. strain plots for reactions C2, C4U, C5 and C6 (A04 potential) [99]. . . 140
6.14 Summary of mechanisms describing the three type of reactions for 1/2[1¯11] loops. (a) T=1 K, (b) T=300 K, low strain rate and (c) T=300 K, high strain rate. . . 145
6.15 Configuration C1. . . 146
6.16 Configuration C2. . . 147
6.17 Configuration C3. . . 148
6.18 Configuration C4. . . 149
6.19 Configuration C5. . . 150
6.20 Configuration C6. . . 151
6.21 Configuration C4U. . . 152
6.22 Configuration C5U. . . 153
6.23 Configuration C6U. . . 154
7.1 Comparison of τc for the 100 loops, 1/2111 loops and voids
obtained with the A04 potential under the same simulation
condi-tions. The number of SIAs in the 1/2111 loops and vacancies in the voids are indicated against the data points. Also depicted are continuum modelling results. Reproduced from Terentyevet al. [99].158
7.2 Comparison of τc for the 100 loops, 1/2111 loop, voids and
Cu-precipitates obtained with the A97 potential under the same
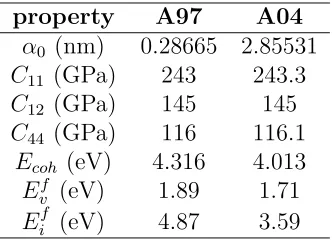
3.1 Comparison of values of elastic constants and defect formation en-ergies given by A97 and A04 potentials (by private communication
with Dr. A. V. Barashev). . . 59
5.1 Numerical data of simulations . . . 83
6.1 Numerical data of simulations . . . 123
6.2 Numerical data of simulations . . . 131
6.3 Summary of results [99]. . . 133
Introduction
It is a well established fact that since the industrial revolution, energy demands
around the globe have been multiplied significantly (by a factor of 30, see Fig. 1.1
[1]). Today, the world relies mainly on fossil fuels and nuclear fission to satisfy these demands, with alternative sources such as wind or solar power contributing
insubstantially. With all future energy projections assuming a further increase
in energy demands, little doubt remains that large scale energy sources should
be developed over the coming decades. Up until this point, the only promising
options seem to be (1) solar energy, (2) nuclear fission and (3) nuclear fusion [2].
With global warming (Fig. 1.2 (a)) being one of the key issues in current
worldwide energy policies, it is essential that these options are sustainable: ‘living
on the Earth’s income rather than eroding its capital’and ‘keeping the
consump-tion of renewable natural resources within the limits of their replenishment’ [1].
Unlike other energy sources (hydro-power, biomass, wind, geothermal and solar energy), nuclear energy is not strictly renewable. Still, since it produces
negli-gible greenhouse gas emissions and uses resources at a very low rate, it can be
considered sustainable [1]. This is especially true about fusion; for example, one
of its main fuels, deuterium, exists in abundance (1 in 6500 H atoms in seawater),
making it a potential energy source for centuries [3].
But global warming is not the only large-scale challenge humanity faces today.
Of great importance are shortages of food and fresh water supplies, especially in
the developping world, posing a threat of potential turmoil [3]. In fact, all these
problems can be ascribed to ones of energy supply. Fig. 1.2 (b) shows the 1990 energy use in different regions of the world [1]. Recently, growing industrialisation
of non-industrial nations has strained this figure, offsetting the energy gain from
Figure 1.1: Growth in the rate of energy use and in the sources of energy since 1860 in gigatonnes of oil equivalent per year [1].
conservation efforts in the industrialised world and making the need for drastic
solutions even more imperative [2].
On a national scale, a healthy society needs a multitude of energy sources.
Stability demands that no nation is dependent on just a single source [2]. The
free market economy also imposes a danger to existing nuclear powers such as the UK of ‘being left behind’ in the nuclear power business [5].
In the last 10 years, the percentage of power supplied from nuclear plants in
the UK has dropped from 30% to 18% and with old stations being pensioned off,
this number is likely to decrease even further. Therefore, it is no big surprise that
on 10th January 2008, the British government announced its support for building
a new generation of nuclear power plants as the centrepiece of the energy policy.
The next decade will see the largest investment in nuclear energy since the 1960s;
a decision agreed on by both main political parties [5, 6]. A great deal of research is being undertaken in both fission and fusion, despite the fact that
economically-generated fusion power is still decades away.
For commercial fusion reactors to be achieved, a number of experimental
ambi-Figure 1.2: (a) Global mean surface temperature anomaly relative to 1961-1990 [4]. (b) Per capita annual energy use in tonnes of oil equivalent in 1990 in different regions of the world [1].
tious projects worldwide is ITER, the acronym formerly standing for
Interna-tional Thermonuclear Experimental Reactor. ITER is now being constructed in
Cadarache, France, by an international consortium consisting of the European
Union (represented by EURATOM), Japan, the People’s Republic of China,
In-dia, the Republic of Korea, the Russian Federation and the USA, and is expected
to start plasma operation in 2018 [7]. Its purpose is to‘demonstrate the plasma physics, materials and engineering necessary to validate the broad technical
fea-sibility of fusion power by operating well above energy breakeven and based on a
sufficiently long duty cycle to confirm a dependable energy source’[8].
One of the major challenges the ITER consortium will face is the development
of materials of adequate strength, toughness, and swelling and creep resistance,
which will be able to operate in a commercial fusion reactor (CFR). Temperatures
up to 600◦C, stresses up to 300 MPa and fast neutron radiation damage of the order of 100 displacements per atom (dpa) will be typical for first wall operation.
A number of materials have been proposed so far that might withstand such
extreme conditions, based on experience from previous fusion plant projects. Such materials are mainly ferritic-martensitic steels, vanadium alloys and tungsten [9],
while recently considered ones include carbon fibre/carbon composites, SiC/SiC
composites, dispersion-hardened copper and graphite doped with boron [10].
MW and sustained for up to 1000 s. Nevertheless, once it is finished and before
the operation of a CFR, another demonstration reactor, DEMO, is proposed. Its
objectives extend those of ITER, including sustained burn and tritium breeding
[8]. A CFR is projected to commence operation in about 2050.
The research presented in this thesis is part of the ‘Predictive modelling of
mechanical properties of materials for fusion power plants’ consortium project,
funded by the EPSRC. Participating members were the University of Oxford,
the University of Edinburgh, Queen’s University Belfast, UKAEA, and the
Uni-versity of Liverpool [9]. The goal of the project was ‘to predict the performance
and behaviour of materials across all relevant lengths and timescales balancing
accuracy, efficiency and realistic description’ [9].
The consortium’s approach was a multi-scale one; a concept that has been used in the past, but with limited success for technical reasons. In this case,
multi-scale translates into multi-layered, with each layer corresponding to a different
size and time scale [11, 12]. Each participant dealt with a different scale, with the
potential to produce results that could be passed as input parameters for the next,
coarser-scale, layer. Methods used were ab initio modelling, molecular statics
and dynamics, kinetic Monte-Carlo, microstructural modelling and dislocation
dynamics, thus covering a spectrum from the atomic to the mesoscopic scale (fig.
1.3) [9].
More specifically, research conducted within the framework of this Ph.D.
project consisted of atomic-scale computer modelling (molecular dynamics, MD, and molecular statics, MS) of interactions between edge dislocations and
radiation-induced defects, such as self-interstitial atom (SIA) dislocation loops, voids and
copper precipitates in bcc α-Fe. The goal was to study irradiation hardening
both qualitatively and quantitatively. The aim of the qualitative study was to
describe the mechanisms that control hardening and shed light into the physics
behind them. Quantitative study aimed to produce an obstacle-strength
map-ping of defects, in order to enable comparison of their respective significance in
the plasticity of irradiated α-Fe. Furthermore, an ultimate aim of this type of research is to supply continuum-scale modelling (such as dislocation dynamics,
DD) with numerical values of properties to be used as input parameters according
to the multi-layered scheme of multi-scale materials modelling described above.
previ-Figure 1.3: Layers of multiscale modelling [12].
ous research are presented in this thesis as follows. Chapter 2 contains a review
of literature related to nuclear fusion, radiation damage and hardening
mecha-nisms inα-Fe. An introduction to molecular dynamics as well as the methodology
adopted for the conduct of research presented here is the subject of chapter 3.
Emphasis is given on the model and interatomic potentials used and the
tech-nique of the introduction of an edge dislocation in this model. Chapter 4 deals
with single straight dislocations. Properties such as dislocation core structure
and critical resolved shear stress both at T=0 K and higher temperatures are
analysed for edge dislocations, and there is also a brief discussion on screw cores.
An unexpected pattern was found for the edge dislocation core reproduced with one of the potentials used; a possible connection with another previously
unex-pected phenomenon is speculated. Voids and Cu-precipitates and their
interac-tions with a gliding edge dislocation are analysed in parallel in chapter 5. Both
are common defects in irradiated α-Fe, and have been studied before; however,
new phenomena were observed, stemming from the fact that new geometries were
studied. Chapter 6 presents results on edge dislocation-SIA loop interactions of
both orientations frequently observed inα-Fe. A number of reaction mechanisms
[image:23.595.172.467.119.337.2]aforementioned obstacle-strength mapping obtained, followed by a comparative
analysis. As a result of this analysis, fields of potential future research emerge
and are briefly discussed. The thesis closes on a slightly more personal note, with
Literature Review
2.1
Introduction
Nuclear fusion is defined as the exothermal process that occurs when light nuclei
come together forming stable particles different from the original colliding nuclei [2, 13]. This can be readily explained considering the curve of figure 2.1. It has
been found that nucleons have a bigger mass when free. When bound within
nuclei, part of their mass disappears. It becomes binding energy, according to
Einstein’s formula: E=mc2. Fig. 2.1 depicts this binding energy per nucleon
as a function of the number of nucleons that comprise a nucleus. It is evident
that elements such as Fe, Ni and Kr are the most stable, since their binding
energy is the highest. Breaking up heavy nuclei into lighter ones or combining
light nuclei to form heavier ones can release energy, as long as the products have
higher binding energy than the reactants. The former process is nuclear fission,
the latter nuclear fusion [2].
Fusion power, when obtained, will be a far superior alternative to fission (or
other power sources for that matter). Advantages are numerous and significant:
• Deuterium, the main reactant in the most common reactions, is cheap and exists in abundance, making fusion a sustainable energy resource [8, 14].
• Fusion reactor operation is inherently safe, making ‘china syndrome’-type accidents virtually impossible. Since fusion, unlike fission, requires precise
conditions of temperature, pressure and magnetic field parameters,
reac-tor operation would cease promptly in the event of a malfunction, thus
practically eliminating the ‘human error’ factor [14].
Figure 2.1: Binding energy per nucleon. [15]
• Compared to fission, danger of radiation exposure is insignificant since there is no risk of a runaway reaction in a fusion reactor. Not only does the plasma
need optimal conditions, but it is also of extremely low density, containing
a very small amount of fuel (a few grams). It would take no more than a
few seconds for the reaction to be stopped, as soon as the fuel supply is closed. With fission, this time could be measured even in years [3, 8].
• Failure of other compartments of the reactor (e.g. magnetic confinement structure) would not be dissimilar to any other kind of industrial accident
and could be effectively prevented [3].
• The main radioactive remnant of the deuterium-tritium (D-T) cycle is tri-tium. Even though most of it will be burnt inside the reactor, some will
require proper handling. Still, its half-life is only 12.3 years, unlike
radioiso-topes produced in fission. Moreover, if appropriate materials are used, other radioisotopes produced mainly in the reactor core are limited in number
compared to ones in fission, biologically less active and will only be
be used both for tritium production and as a coolant. Lithium is highly
flammable and in the event of a fire would release tritium and other
ra-dioactive gases into the atmosphere. However, their amount would be so
small that, when dilluted into the air, their concentrations would fall to legally acceptable levels before even leaving the plant perimeter. All these
considerations only increase the appeal of fusion compared to fission [3, 8].
• Finally, the risk of potential theft of nuclear fuels to be used for weapon production is practically non-existent. In general, the overlap of technology
used in fusion and that used for nuclear weapons is small [3, 14].
Depending on how the reaction is initiated, fusion is described as beam-target
(when one nucleus is accelerated), beam-beam (if both nuclei are accelerated)
or thermonuclear (if nuclei are part of plasma near equilibrium) [13]. In the
latter case, it is mainly the particles in the high energy tail of the Maxwellian
distribution that have enough energy to react. This means that the depleted part
of the velocity distribution becomes repopulated by thermal collisions, justifying
the term ‘thermonuclear’ [2].
Due to the extremely high binding energies that hold nuclei together, fusion
reactions release energy many orders of magnitude higher than chemical reactions
(e.g. 17 MeV inD-T reaction, compared to only 13.6 eV for the ionisation ofH). There are numerous possible fusion reactions, but few comply with criteria that
make them potential energy sources [13]. Of them, the most important are [2]:
• deuterium-tritium reaction
2D+3T −→4 He(3.5MeV) +1n(14.1MeV) (2.1)
• deuterium-deuterium reactions
2D+2D−→3 He(0.82MeV) +1n(2.45MeV) (2.2)
2D+2D−→3 T(1.01MeV) +1H(3.02MeV) (2.3)
• neutron free reactions
1H+7 Li−→24He (2.5)
1H+11B −→34He (2.6)
2D+3He−→4 He+1H (2.7)
3He+3He−→4 He+ 21H (2.8)
Deuterium-tritium reaction (figure 2.2 (a)) is the most immediately promising
for fusion power generation, mainly due to the fact that it is the easiest to realise
the conditions needed for a fusion reactor to reach ignition [3]. This is why it is
chosen for first-generation fusion-power plants [2]. As can be seen in Fig. 2.2 (b),
the reaction rate forD-T is the highest of the three categories. Reactions falling
into the other two are perceived to be used for second and third-generation plants [2]. Discussion on fusion from now on will be about the D-T cycle, unless stated
otherwise.
Figure 2.2: (a) Deuterium-tritium reaction [16]. (b) Fusion reaction rate [13].
Despite the existence of different designs, a typical nuclear fusion power plant
will consist mainly of two parts, the balance of plant and the nuclear island. The
former is the conventional part that converts heat into electricity using steam
turbines, like in fission or coal power plants. The latter consists of (1) a plasma chamber (with the associated vacuum system), (2) the first wall and divertor,
which face the plasma and absorb its thermal radiation, (3) the blanket, where
the neutrons are absorbed and tritium is bred and which heats a working fluid
the plasma is magnetically confined [3].
The main conditions for the operation of a thermonuclear fusion reactor are
[14]:
• Plasma temperature must be very high (around 4.5×10⁷ K for the D-T
reaction).
• Ion density,n, must be high, so that the nuclei collision rate is sufficient.
• Plasma confinement time must be big.
Confinement refers to all conditions necessary to keep the plasma dense and
hot long enough to undergo fusion [3]. For the plasma not to disassemble, no net forces should exist in it. Even in case a small deviation occurs, the plasma
must be constructed in such a way that the system returns to its initial state,
maintaining its stability. Particle or heat loss needs to be low enough. Retaining
heat is called energy confinement and can be accomplished in different ways.
These ways determine the nature of the fusion reactor itself.
As mentioned before, the most common mechanism is that of magnetic
con-finement. Since plasma is ionised gas, its particles can follow the lines of an
imposed magnetic field. Confinement can be achieved in two ways: either by
bending these lines back on themselves, forming, for example, toroidal surfaces,
or by using a magnetic mirror effect, with some particles being reflected when encountering a region of higher field strength [3]. These mechanisms gave birth
to different concepts for fusion reactors.
The best known of these concepts is TOKAMAK, since many important fusion
reactors such as Starfire, JET, ITER and DEMO are, or will be, based on it.
It was first proposed by Sakharov and Tamm [17], and the name is a Russian
acronym standing for TOroid KAmera (chamber) MAgnit (magnet) Katushka
(coil) [2]. Plasma confinement is achieved by a strong applied magnetic field
together with a poloidal field created by a toroidal current (Fig. 2.3) [18]. As shown in the figure, under the combined influence of these two fields, plasma
particles are confined in a helical path, thus making sustained fusion burn feasible.
Another important concept is that of magnetic mirror confinement [3, 14]
(MARS tandem-mirror fusion commercial power plant, being an example [2]).
Figure 2.3: Tokamak fields [18].
the two ends. This way, the field becomes so inhomogenous that the coils act
as magnetic mirrors, reflecting the plasma particles and forcing them to a helical path back and forth, thus increasing their density.
Other concepts have also been suggested, namely spherical tokamaks,
stellara-tors, heliotrons, torsatrons, reversed field pinch, θ pinch, Z pinch etc [8].
Advo-cates for each one of them claim potential advantages compared to TOKAMAKs.
However, none of them has received as much attention and their development is
well behind the TOKAMAK approach. Nevertheless, some might eventually
sur-vive the tests of experiment and be used for future CFRs [2].
Of the energy produced in the D-T cycle, only 20% is available to heat the
neutronicity [13]. These high energy neutrons (14 MeV) are beneficial, as they
are reactants in one of the reactions
1n+6Li−→3 T +4He (2.9)
1n+7Li−→3 T +4He+1n (2.10)
that supply the tritium to theD-T cycle [13]. On the other hand, they pose one
of the biggest problems for materials design of the reactor, since they cannot be
confined and they escape the plasma, thus activating the structure and damaging
the first wall [3]. It is expected that neutronicity in a commercial D-T reactor
will be approximately 100 times that of current fission power reactors. Therefore, the design of materials suitable for fusion reactor cores focuses mainly on finding
materials able to withstand damages produced by such an extreme neutron flux
[3].
Other than that, the choice of materials for a fusion power plant is limited by
demands in availability, good mechanical and fabrication properties, reliability
(long service life) and no extremely long-lived isotopes (waste-storage problem)
[2]. It is self-evident that separation of functionality of different particular
compo-nents has to be taken into account. ‘Function’ here refers to mechanical durability,
tritium recycling, ablation protection, thermal conduction, cooling and structural barriers etc [10]. The research presented in this thesis is concerned with properties
for candidate materials for first wall/blanket operation.
Figure 2.4 illustrates major engineering components of a fusion reactor. First
wall and blanket (which could be integrated) are coloured green and red,
re-spectively. The primary functions of these components are to provide the first
physical barrier for the plasma, to convert energy into sensible heat and provide
for the heat removal, to breed tritium and provide for tritium recovery, and to
provide some shielding for the magnet system [2, 19]. They must withstand high
particle and energy fluxes from the plasma, high thermal and mechanical stresses,
and elevated-temperature operation. Also, the first wall must not be a source of excessive plasma contamination and the blanket must be compatible with the
chemical environment, the plasma and the vacuum. Typical materials currently
proposed for such applications are ferritic-martensitic steels based on Fe with
materials, such as SiC composites have also been proposed, but their stability
[image:32.595.260.392.178.356.2]under heavy irradiation is yet to be proven [9].
Figure 2.4: Schematic diagram of tokamak reactor [8].
For such properties of candidate materials to be optimised for plasma-facing operation, further understanding of the mechanisms responsible for hardening
under irradiation is necessary. A brief introduction to computer modelling as a
method of investigation follows in subsection 2.2. In the following parts of this
chapter there is a summary of research analysing such mechanisms. First, there
is a brief description of radiation damage and hardening mechanisms in general.
Subsection 2.4 focuses on displacement cascades as a method of introduction of
defects in irradiated metals. Dislocations and their interactions with other defects
play a dominant role in the mechanical behaviour of metals and are discussed in
subsection 2.5. Subsection 2.5.1 introduces dislocations themselves; the remaining
subsections deal respectively with interactions between dislocations and point defects, voids, solute atom precipitates and dislocation loops. Where results
presented here are related to research conducted in this work, more details will
2.2
Modelling methods
During the last few decades, the value of computer modelling as a method of
investigating materials properties has increased significantly mainly due to the
constantly increasing computing power available. Along came the development of
different methods to this end, stochastic or deterministic, in a wide range of time
and space scales. Increasing sophistication of these methods has enabled scientists
not only to realistically simulate complex experiments or test complex theory but
also to allow thought experiments, i.e. simulate situations which are impossible to have in reality, but whose analysis sheds light to phenomena improbable to
comprehend otherwise [23].
It is noteworthy that the molecular dynamics method was invented in the late
fifties by George Vineyard and his group in Brookhaven National Laboratory
specifically for research on radiation damage [23, 24]. Since then, it has played
an important role in analysing atomic and microscopic scale phenomena, and in
coupling between different scales of materials modelling. This last function of
MD is of great interest, as the scale problem in materials properties is intrinsic,
in the sense that the cause for a property observed at some scale usually lies in a different one [25].
As mentioned in the introduction, multi-scale materials modelling follows a
multi-layered approach [26]. In the finer size and time scale (∼ 10−9 m or a few nanometers and femtoseconds), where the electrons are the key players and
inter-actions between atoms are dictated by quantum-mechanics through Schr¨odinger’s
equation [27], first-principles (or ab initio) molecular dynamics (FPMD) [23],
quantum Monte Carlo (QMC) and quantum chemistry (QC) are employed. If
extreme accuracy is not of essence, density-functional theory (DFT) and local
density approximation (LDA) can be useful alternatives [11]. In the atomic scale (up to a few micrometers and picoseconds), classical interatomic potentials
gov-ern the interactions between atoms: molecular dynamics and statics, and Monte
Carlo simulations are performed. In the mesoscopic scale (∼10−4 m or hundreds of micrometers and nanoseconds) it is phenomenological theories that
encom-pass the interactions between atoms. Continuum techniques, such as dislocation
dynamics (DD), determine the behaviour of lattice defects (dislocations, grain
physical system is again viewed as a continuous medium, and its behaviour is
determined by continuum fields, such as density, velocity, temperature, stress
fields etc. For this macroscopic scale, finite-element (FE) methods are usually
[image:34.595.179.457.229.435.2]employed [11]. A time-scale mapping of modelling techniques is depicted in Fig. 2.5 [25].
Figure 2.5: Temporal scales [25].
Both techniques employed in the research reported in this thesis, MD and MS, will be discussed in more detail in chapters about methodology and results.
However, a brief introduction of them here is deemed expedient, in order to assist
in the discussion on research conducted on radiation-induced defect interactions.
Molecular dynamics is ‘a computer simulation technique where the time
evo-lution of a set of interacting atoms is followed by integrating their equations of
motion’ [23]. In the limiting case where the temperature is 0 K, the technique
is called molecular statics and its objective is to identify the atomic
configura-tion with a minimum potential energy. This enables static results to be directly compared with elasticity theory and for parameters needed in continuum level
simulations to be readily obtained [28]. However, molecular statics does not
re-veal information about the atomic mechanisms occurring in real metals, for it
excludes thermal effects [29]. This explains why, in order to compare with values
2.3
Radiation damage/hardening mechanisms
Radiation damage can be defined as the displacement of many atoms from their
lattice sites by collisions with energetic atomic particles from a nuclear source,
thereby creating supersaturations of vacancies and SIAs [30]. First, primary
re-coil atoms or primary knock-on atoms (PKAs) are generated in less than 10−15 s, either by scattering of the incident radiation, or by injection of accelerated ions.
Subsequently, PKAs impact on other atoms in the metal generating their
displace-ment if the available kinetic energy originally imparted to the PKAs exceeds the displacement threshold energy plus the energy lost as electron excitation. This
way, vacancy-SIA pairs (Frenkel pairs) are created [25]. The most crucial aspects
for radiation damage are the geometry and mobility of the produced defects and
the energy differences between them [31].
It takes only a few tens of electron-volts to knock an atom out of its lattice
position. The total disarray thus imparted in the bulk of the crystal is anisotropic
and is measured in ‘displacements per atom’ (dpa), which are defined as the
number of times each atom is dislodged from its place in the crystal by radiation
[19]. If all atoms are displaced once on average, this is equivalent to 1 dpa. This volumetric damage results in the formation of vacancies and interstitials,
dislocations, voids and possibly precipitates.
The production of such defects has macroscopic effects on the crystal [10]:
swelling and the resultant hardening and embrittlement (less important at
ele-vated temperatures, due to annealing [19]), irradiation-induced creep and growth
[10], increase of ductile-to-brittle transition temperature [6] and decreases in
ther-mal and electrical conductivity [19] being amongst them. All these effects came
to be known as the ‘Wigner disease’ [25].
From a microscopic perspective, atomic-scale degradation includes matrix damage [6], phase development and segregation [6], and the generation of helium
and hydrogen via nuclear reactions [25]. Irradiation hardening and
embrittle-ment, defined as an increase in the yield strength of the material and reduction
in ductility [30, 32, 33, 34], occur when a metal is irradiated at temperatures
below about one third of its melting temperature (in degrees K) and can be
anal-ysed based on the cascade-induced source hardening (CISH) model [25]. Specific
now it suffices to say that according to CISH, displacement cascainduced
de-fects (SIA clusters, loops or voids) pin and may also decorate Frank-Read sources
(grown-in dislocations, which are omnipresent anyway) thereby impeding their
glide during deformation (even creating flow localisation by dislocation channel-ing at high levels of cluster density) [35, 36]. This is what causes the yield stress
to be usually increased and the tensile ductility, work-hardening rate and
frac-ture toughness of the metal to be drastically decreased, posing a failure risk and
potentially rendering the material unsuitable for first wall operation [25].
It has to be emphasised that this increase in yield strength does not happen
in the same manner as for cold-worked unirradiated hardening. Materials
irra-diated to doses beyond a certain dose level are unable to deform plastically in a
homogeneous manner [25]. They undergo a yield drop, negative work hardening and plastic instability, which is what renders the materials unsuitable for service.
Qualitatively, this is explained as follows. Plastic deformation is triggered by
dislocation motion. When the density of dislocation decoration is high, due to
relatively high radiation doses, the generation of dislocations is prevented, since
dislocations cannot be unlocked from their atmosphere. When, eventually, this
does happen, at a high stress level, this stress corresponds to the upper yield
stress. For high decoration densities, this is most likely to occur either at points
of singularities in the crystal (such as grain boundaries, inclusions, surfaces etc),
where there is a high stress-concentration factor, or for some dislocations in the
crystal which may, statistically, be less heavilly decorated. In either case, this sudden release of dislocations must account for the occurence of the yield drop,
plastic instability and plastic flow localisation in narrow bands (∼100 nm wide), known as ‘cleared channels’. These virtually obstacle-free channels act as soft and
easy paths for further transport of dislocations still being generated at sources,
further reinforcing plastic flow localisation. When these channels intercept grain
boundaries, surfaces or other channels, they can cause crack nucleation at the
points of interception. It is exactly this loss of material ability to deform
homo-geneously that poses the real technological challenge. Potential solutions to this problems can be either controlling the decoration of dislocations or their
trans-port through ‘cleared channels’ during deformation [25]. From an engineering
point of view, at least in principle, both solutions are achievable.
either (i) by testing samples machined from failed or spent components or test
pieces placed close to the cores of materials test reactors, or (ii) by simulating
neutron irradiation damage processes with high energy ion beams in accelerators
or cyclotrons [8]. The latter process possesses the advantage of producing damage at highly accelerated dose rates, similar to that produced by many years of reactor
operation. A number of testing facilities are available already, such as materials
testing and mixed spectrum reactors, fast reactors (Phenix, EBR-2), accelerator
D-T reaction sources (RTNS-II), spallation sources (ESS), ion irradiation facilities
etc [10]. Nevertheless, there still exists a need for a facility for testing materials
in relevant neutron irradiation environment [10]. The effort to accelerate the
development of fusion power (the so-called ‘fast-track’ option [10]) requires the
construction of another facility, before ITER, for proper material testing. Such a facility, called IFMIF (International Fusion Material Irradiation Facility), is
scheduled for about 2017, and is based on the concept of a stripping source: a
beam of energetic deuterons producing a beam of energetic neutrons when the
proton is stripped from the deuteron [37].
Experimental detection of radiation-induced defects is difficult, because of
their size. Originally, the transmission electron microscopy method used was
two-beam bright field imaging. More recently it has been replaced by the weak two-beam
technique which provides better spatial resolution and signal-to-background ratio
[33, 32, 38]. Moreover, weak beam TEM results are ready for direct comparison
with ones derived from molecular dynamics. Lately, 3-D atom-probe studies and high-resolution electron microscopy (HREM) are providing new insights into
damage development [6].
2.4
Displacement cascades
In the previous subsection, the atomic displacements that constitute radiation
damage were discussed, and reference was made to the displacement cascades
mechanism that produces these displacements. In this subsection, there will be
a more detailed analysis on this mechanism and the defects it produces.
Following a nuclear reaction, a flux of fast neutrons or heavy-ions bombard the
core components of nuclear reactors, producing PKAs [39]. These atoms, when
neighbours from their host lattice sites, by avalanches of elastic collisions. These
are called displacement cascades and are the primary source of radiation damage
of metals under fast-neutron irradiation [25, 39]. Recoil energy spectra of PKAs
can range up to tens of keVs in components of a nuclear plant [28]. The primary and secondary collisions cause the temporary displacement of many (typically
thousands) of atoms. Following this collision phase, some of these atoms fail to
return to lattice sites (or sub-lattice, in case of ordered alloys). This generates
a localised high supersaturation of point defects; vacancies are in abundance
near the centre of a cascade zone and SIAs emerge towards the periphery (even
resulting in potential local chemistry changes in alloys) [28].
It is the subsequent evolution of these defects that gives rise to the
afore-mentioned changes of physical properties that affect the performance of metals [28]. A substantial fraction of these defects form clusters with their own kind,
either during the cascade process itself, or after diffusion in the material [27].
This means that SIAs cluster as tightly-packed planar arrays of crowdions, thus
forming dislocation loops with perfect Burgers vectors parallel to the crowdion
axes (for bcc metals, such asα-Fe, these would be 1/2111 or100) and vacan-cies cluster either in the form of voids or, more rarely, of vacancy loops. In the
presence of He or H, voids can transform into He or H-filled bubbles [27]. More
details on specific defect formation will be given in later sub-chapters.
Due to their nanometre and picosecond scales of length and time, cascades are
not susceptible to direct experimental study [39, 40]. However, these scales make them ideal for atomistic computer simulation by means of MD, using models
typ-ically containing up to a few million atoms interacting via empirical short-range,
isotropic, many-body interatomic potentials of the embedded atom or
Finnis-Sinclair type [28]. Despite their physical limitations [10, 41], such simulations
shed more light into the cascade process, describing it in fine detail.
Therefore, more analytically, a cascade process can be divided into three
phases [39]:
• Avalanche of collisions (∼1 ps) [39]: it occurs with PKA energies of ∼0.5 keV and above [25], with the creation of a large damage zone. At the
• ‘Thermal spike’ (several ps) [42]: A large fraction of the displaced atoms in the outer regions quickly return to their lattice sites by athermal
relax-ation. Vacancies and SIAs recombining and annihilating each other cause
a decrease in the number of surviving defects, known as the ‘damage ef-ficiency’ [25]. Liquid-like disorder persists in the core that prevents some
atoms from regaining their sites, turning them into SIAs at the periphery of
the core. For high radiation doses, ‘cascade overlap’ might occur, producing
higher defect density and prolonging the thermal spike lifetime [42].
• Recrystallisation [42]: As the cascade core cools down, it recrystallises. When there is sufficient energy density and cascade lifetime to permit the
motion of defects, vacant sites are finally formed within the core, producing
a high concentration of defects, many of which are clustered in voids or dislocation loops. Inα-Fe, at recoil energies up to 40 keV, clusters contain
about 10% of vacancies and 60% of SIAs [25].
According to the process described above, it is of interest to obtain the
depen-dence of the number of point defects created on the kinetic energy of the PKAs that create them in the first place [39]. Such an attempt led Norgett, Robinson
and Torrens to derive the NRT formula [43, 44];
NN RT = 0.8(Edam)/2Ed (2.11)
whereEdamis the damage energy available for elastic collisions andEdis the value
of the threshold displacement energy averaged over all crystallographic directions. If all inelastic losses are neglected Edam ≡ Ep, where Ep is the kinetic energy of
the PKA.
However, when results obtained by MD simulations are compared to NRT
predictions, it turns out that the NRT formula overestimates the production
of defects by cascades by a factor of 60-80% [10, 39]. This happens because the
binary collision model that NRT is based on does not describe atomic interactions
during the thermal spike phase, when intra-cascade SIA-vacancy recombinations
significantly reduce the number of remaining defects [39].
following empirical relationship;
NF =A(Ep)m (2.12)
where NF is the final number of point defects found in simulation cascades, and
A and m are constants, weakly dependent on material and temperature. Bacon
et al. [45] and Bacon and Osetsky [39] have found that for α-Fe, when Ep is
expressed in keV, the values for A and m are approximately 5.6-5.7 and
0.78-0.83, respectively.
Another point of interest is the fact that the vacancy and SIA clusters created present different thermal stability and, potentially, contain a different fraction of
their respective defects. This means that during the cascade process, aproduction
bias exists: a fraction of SIA clusters must be escaping to sinks other than voids
[25]. This is the main thesis of the production bias model (PBM), proposed by
Woo and Singh [46, 47]. To accurately describe the defect accumulation during
cascade damage conditions, considerations of kinetics of reactions of defects have
to be taken into account, especially the diffusion of SIA clusters and their changes
in directions of motion.
Finally, as far as irradiated alloys are concerned, it seems from MD studies
performed so far that solute atoms have little effect [28, 39]. The only differ-ence from single element crystals is the occurdiffer-ence of additional effects in ordered
alloys, either because individual sub-lattices become occupied by atoms of the
wrong type (anti-site defects) or because crystallne order is not restored and an
amorphous structure is formed. This damage zone corresponds largely to the
‘molten’ core region formed during the thermal spike phase.
2.5
Dislocation-obstacle interactions
2.5.1
Dislocations
Dislocations are line defects in crystals, generally categorised as edge and screw.
In the former, the dislocation line is defined along the edge of an extra half-plane of atoms, forming a localised lattice distortion. The latter results from a shear
of a spiral of atomic planes. There also exist, of course, dislocations of a mixed
nature, i.e. having both edge and screw components [48].
Dislocations are characterised by [48]:
• Their Burgers vector b, that defines the magnitude and direction of the lattice distortion associated with a dislocation in a crystal lattice. It
repre-sents the relative displacement of atoms that are neighbours across the slip
(or glide) plane as the dislocations glide by.
• Their line vector t(x,y,z), describing the direction of the dislocation line in the lattice.
• Their glide plane, which has to containb and t(x,y,z), and is thus defined by them.
Experimentally observed low yield stresses of most ductile solids dictate that
dislocations are either formed initially during the growing of crystals or they are
formed at points of high stress concentration. In the former case, dislocations are
either present in the ‘seed’ crystals or other surfaces used to initiate growth, or
they are nucleated ‘accidentally’ during the growth process [30]. In the latter case,
they are the product of multiplication of already existing dislocations, usually in
small-angle boundaries and networks. These sources of dislocations are known
as Frank-Read sources [30, 49]. Other mechanisms of dislocation multiplication include multiplication by multiple cross glide, by climb or at grain boundaries
[30].
Dislocations are inherently associated with slip. The line of demarkation
between a slipped and an unslipped area along a glide surface of a crystal is a
dislocation line by definition. Mechanical properties of materials depend strongly
on dislocation ability to glide on these glide surfaces. The main controllers for
such dislocation glide are (i) the nature of the bonding between atoms, (ii) the
crystal structure of the metal and (iii) the dislocation core width [27]. It has been
found that atomic forces of a crystal offer practically no resistance to the motion
of awide dislocation [49].
In the case of bcc metals, such as α-Fe, MD simulations analysing the glide
of a single edge dislocation based on its core position in the crystal have revealed
![Figure 1.1: Growth in the rate of energy use and in the sources of energy since 1860 ingigatonnes of oil equivalent per year [1].](https://thumb-us.123doks.com/thumbv2/123dok_us/8062793.226247/20.595.121.516.126.343/figure-growth-rate-energy-sources-energy-ingigatonnes-equivalent.webp)
![Figure 1.3: Layers of multiscale modelling [12].](https://thumb-us.123doks.com/thumbv2/123dok_us/8062793.226247/23.595.172.467.119.337/figure-layers-of-multiscale-modelling.webp)
![Figure 2.1: Binding energy per nucleon. [15]](https://thumb-us.123doks.com/thumbv2/123dok_us/8062793.226247/26.595.181.462.124.367/figure-binding-energy-per-nucleon.webp)
![Figure 2.3: Tokamak fields [18].](https://thumb-us.123doks.com/thumbv2/123dok_us/8062793.226247/30.595.235.418.119.482/figure-tokamak-elds.webp)
![Figure 2.4: Schematic diagram of tokamak reactor [8].](https://thumb-us.123doks.com/thumbv2/123dok_us/8062793.226247/32.595.260.392.178.356/figure-schematic-diagram-of-tokamak-reactor.webp)
![Figure 2.5: Temporal scales [25].](https://thumb-us.123doks.com/thumbv2/123dok_us/8062793.226247/34.595.179.457.229.435/figure-temporal-scales.webp)
![Figure 2.6: Potential energy and applied stress versus applied strain in an Fe crystalat T=0 K containing an edge dislocation gliding through a 2 nm void [27].](https://thumb-us.123doks.com/thumbv2/123dok_us/8062793.226247/47.595.201.435.317.556/figure-potential-applied-applied-crystalat-containing-dislocation-gliding.webp)
 edge dislocations and SIAloops in bcc crystals.](https://thumb-us.123doks.com/thumbv2/123dok_us/8062793.226247/59.595.137.497.121.382/figure-summary-reactions-edge-dislocations-sialoops-bcc-crystals.webp)