Modelling particle residence times in agricultural
river basins using a sediment budget model and
fallout radionuclide tracers
Hugh G. Smith,1* William H. Blake2
and Alex Taylor2
1School of Environmental Sciences, University of Liverpool, Liverpool, L697ZT, UK
2School of Geography, Earth and Environmental Sciences, Plymouth University, Plymouth, PL48AA, UK
Received 3 September 2013; Revised 14 April 2014; Accepted 15 April 2014
*Correspondence to: Hugh G. Smith, School of Environmental Sciences, University of Liverpool, Liverpool, L697ZT, UK. E-mail: hugh.smith@liverpool.ac.uk
ABSTRACT: Contemporary patterns in river basin sediment dynamics have been widely investigated but the timescales associated with current sediment delivery processes have received much less attention. Furthermore, no studies have quantified the effect of recent land use change on the residence or travel times of sediment transported through river basins. Such information is crucial for understanding contemporary river basin function and responses to natural and anthropogenic disturbances or management interventions. To address this need, we adopt a process-based modelling approach to quantify changes in spatial patterns and residence times of suspended sediment in response to recent agricultural land cover change. The sediment budget model SedNet was coupled with a mass balance model of particle residence times based on atmospheric and fluvial fluxes of three fallout radionuclide tracers (7Be, excess210Pb and137Cs). Mean annual fluxes of suspended sediment were simulated in seven river basins (38–920 km2) in south-west England for three land cover surveys (1990, 2000 and 2007). Suspended sediment flux increased across the basins from 0.5–15 to 1.4–37 kt y-1in response to increasing arable land area between consecutive surveys. The residence time model divided basins into slow (upper surface soil) and rapid (river channel and connected hillslope sediment source area) transport compartments. Estimated theoretical residence times in the slow compartment decreased from 13–48 to 5.6–14 ky with the increase in basin sediment exports. In contrast, the short residence times for the rapid compartment increased from 185–256 to 260–368 d as the modelled connected source area expanded with increasing sediment supply from more arable land. The increase in sediment residence time was considered to correspond to longer sediment travel distances linked to larger connected source areas. This novel coupled modelling approach provides unique insight into river basin responses to recent environmental change not otherwise available from conventional measurement techniques. © 2014 The Authors. Earth Surface Processes and Landforms published by John Wiley & Sons Ltd.
KEYWORDS: sediment budgets; sediment residence time; connectivity; fallout radionuclides; river basins
Introduction
Quantifying the timescales of sediment transfer through river systems is fundamental for understanding river basin sediment and associated contaminant dynamics. This timescale is repre-sented by the period of sediment residence or transit within a river basin that may encompass soil formation from bedrock, hillslope erosion and delivery to streams, storage and remobilization in channels and floodplains, and export from the basin outlet. Alter-natively, sediment residence time may be determined for a subset of these components of the fluvial sediment cascade (Fryirs, 2013). Information on the residence time of sediment for different parts of a river basin is required to address research and river management questions of global importance. It has been used as a basis for interpreting the sedimentary response of river basins to changes in land cover and climate over the past 100 ky (Dosseto
et al., 2010). It can also be used to project timeframes for the re-moval of sediment-associated contaminants stored in river basins (Coulthard and Macklin, 2003; Malmonet al., 2005), thereby pro-viding valuable information to river managers.
Investigations of sediment residence time in river basins can be broadly divided into two categories, namely studies quanti-fying long-term weathering and denudation rates versus those focused on sediment dynamics in river channels and basins under recent environmental conditions. The first set of studies use cosmogenic or U-series isotopes to measure rates of sediment production from bedrock (Heimsath et al., 2001; Fifield et al., 2010) or sediment transit times through river basins over 1 to several 100 ky timescales (von Blanckenburg, 2005; Granet et al., 2010). Studies in the second category quantify sediment transit over short hydrological timescales of more relevance to management. Such studies have used the fallout radionuclides7Be and excess210Pb (210Pb
ex) to estimate fine sediment residence times or changes in sediment source in river channels spanning days to months (Bonniwellet al., 1999; Matisoffet al., 2005) and over decades (Wallbrinket al., 1998, 2002; Gartneret al., 2012). Fallout radionuclide tracers have also been used to estimate sediment residence times at the river basin scale (Dominik et al., 1987; Le Cloarec et al., 2007; Evrard et al., 2010). Alternatively, the residence times of
This is an open access article under the terms of the Creative Commons Attribution-NonCommercial-NoDerivs License, which permits use and distribution in any medium,
Earth Surf. Process. Landforms39, 1944–1959 (2014)
© 2014 The Authors. Earth Surface Processes and Landforms published by John Wiley & Sons Ltd. Published online 20 May 2014 in Wiley Online Library
sediment stored in floodplains have been estimated probabilis-tically from computations of sediment mass balances for reach-scale storage units (Dietrich and Dunne, 1978; Kelsey
et al., 1987; Malmonet al., 2003).
The present study focuses on quantifying fine sediment residence times in river basins under recent environmental conditions. The objective was to model changes in spatial patterns and residence times of suspended sediment in response to contemporary agricultural land cover change. No studies have examined the effect of changes in land use on sediment residence time. While many previous studies have quantified the impact of land use change on the magnitude of sediment flux from catchments, changes to the timescales of sediment delivery in contemporary landscapes have been neglected. However, such information is crucial to the fundamental understanding of con-temporary river basin sediment dynamics and the longer-term benefits, or otherwise, or sediment management measures. In this context, it also has important implications for residence times of sediment-associated contaminants. For example, changes to the duration of sediment storage in particular landscape compart-ments could affect the level of contaminant mobility with negative environmental consequences. Therefore, a new research focus is required to address this important knowledge gap.
Changes in sediment residence times in response to land cover change were, for the first time, modelled by combining a sediment budget model, SedNet, with a mass balance model of particle residence times based on three fallout radionuclide tracers, namely7Be,210Pb
exand137Cs. SedNet is a spatially-distributed model that represents erosion, sediment transfer and storage in steady state over a multi-decadal timescale (Prosseret al., 2001a; Wilkinsonet al., 2004). It was developed in Australia and has been applied there to large river basins in tropical and temperate environments (McKergowet al., 2005; Wilkinsonet al., 2009; Hughes and Croke, 2011). There have been no previous applications of SedNet to river basins in Europe or the UK.
Particle residence times were modelled using a mass balance approach based on atmospheric and fluvial fluxes of the fallout radionuclide tracers. The model was first proposed by Dominik
et al. (1987) using only 7Be and 210Pb
ex. Subsequently, Le Cloarecet al. (2007) revised the model by including the137Cs soil inventory as an additional constraint. The model has been applied by Evrardet al. (2010) to investigate sediment dynam-ics in several small catchments in the tropical highlands of Mexico. In contrast, the present study differs from previous applications of the residence time model by employing multi-decadal estimates of fallout and fluvial export. Previous appli-cations were based on short-term monitoring (1–2 years) that is highly dependent on the specific hydroclimatic conditions during measurement periods. Furthermore, these studies did not address changes in residence times in response to land cover change, which requires a dedicated model-based approach. The present study focuses on simulating residence times in seven river basins (38–920 km2) situated in south-west England for land covers corresponding to three surveys produced from satellite imagery between 1990 and 2007.
Methods
River basins
[image:2.595.103.498.464.760.2]Modelling and field measurements were undertaken in seven agricultural river basins located in south-west England (Figure 1). Six of the basins are nested within the River Tamar basin upstream of the village of Gunnislake (920 km2) and include the Rivers Carey (67 km2), Inny (97 km2), Kensey (38 km2), Lyd (219 km2), Ottery (124 km2), and a second measurement site on the main channel of the Tamar in the upper basin (Tamar Upper; 238 km2). The River Tamar forms the main boundary be-tween the counties of Devon and Cornwall and drains south into the Tamar Estuary at Plymouth. All measurements and modelling
were undertaken upstream of the tidal limit. The topography is characterized by short, steep hillslopes in the lower and mid Tamar basin, with lower relief terrain in the upper basin. Maximum elevations (up to 581 m) occur in the small areas of granitic moorland to the east and west.
Most of the basins are underlain by fine sedimentary rocks (mudstones, shales and sandstones). Soils are predominantly loamy, with some peaty soils in upland areas. The extent of floodplain is limited and confined by narrow steep-sided valleys and shallow bedrock. The largest floodplain area is located in the middle of the main Tamar basin. The section of main channel between the Inny and the basin outlet at Gunnislake is extensively bedrock confined. Land cover is mostly agricultural (grassland and arable) with a small area of woodland (<16%). Surveys of land cover based on satellite imagery were completed in 1990, 2000 and 2007 (Mortonet al., 2011).
Precipitation across the study basins falls predominantly as rain and exhibits pronounced spatial variability with the highest annual totals occurring over the upland areas to the east and west. Across the Tamar basin, mean annual precipitation was 1284 mm based on 1 × 1 km gridded data for 1971 to 2000. The mean daily river flow measured at Gunnislake was 22.4 m3s-1 and ranged between 0.58 and 482 m3s-1for the period from 1956 to 2012. There is also pronounced seasonality in rainfall and river flows, with the highest discharge generally occurring from November to March in association with Atlantic cold fronts.
Field measurements and laboratory analysis
Suspended sediment samples were collected continuously at the outlets of each river basin over a 12 month period.In situ
time-integrated samplers based on the design by Phillipset al. (2000) were deployed in pairs at riffles. The samplers were made from polyvinylchloride (PVC) tubes 1 m in length and 0.11 m in diameter with sealed caps at both ends that contained 3 mm diameter inlet and outlet tubes. Water and suspended sediment pass through the narrow inlet tube and enter the PVC tube where the change in cross-sectional area promotes a reduction in flow velocity and sedimentation (Phillipset al., 2000). Under some conditions, these samplers may under-sample the very fine fraction (<2μm) of suspended material, although Phillipset al. (2000) noted that the transport of very fine particles as aggregates should reduce the level of under-sampling that was observed during laboratory experi-ments. Samples were collected at approximately monthly intervals from September 2011 to October 2012. During this time the mean daily flow for the River Tamar at Gunnislake was slightly above average at 23.9 m3s-1and ranged between 4.5 and 155 m3s-1.
All sediment samples were analysed for the three fallout ra-dionuclides following freeze-drying and gentle disaggregation. Samples were sealed for 21 days in either 50 mm Petri dishes or in 4 mm vials for some low mass samples to allow equilibration between214Pb and its parent226Ra. Activity concentrations of the radionuclides were measured using low background EGandG Ortec planar (GMX50-83-LB-C-SMN-S) and well (GWL-170-15-S) HPGe gamma spectrometers at the Plymouth University Consolidated Radio-isotope Facility within an ISO 9001:2008-certified framework. 210Pb
ex was determined by subtraction of 226Ra activity measured using 214Pb gamma emissions (295 and 352 keV) from total 210Pb (46.5 keV). 137Cs and7Be activities were determined from gamma emis-sions at 662 and 478 keV, respectively. Detector efficiency for 7Be was determined by interpolation between the efficiency values of 137Cs (662 keV) and113Sn (392 keV). Count times were typically 86 ks, although some low mass sediment
samples were counted for 172 ks. Sample calibration was carried out using standards of the same geometry and matrix as the experimental samples. Standards were prepared using a mixed standard solution (G E Healthcare, Amersham, UK) which was distributed in a sediment matrix. Sample counts were corrected for background emission, geometry efficiency and decay. All values were decay corrected to the time of sampling and reported as activity concentration (Bq kg-1). Analytical perfor-mance was assessed by inter-laboratory comparison tests using materials supplied by the International Atomic Energy Agency.
Sediment budget model
SedNet derives a river network from a Digital Elevation Model (DEM). This network is divided into river links that are formed between adjacent stream junctions and includes the internal contributing area draining into each link. The mean annual suspended sediment mass balance (t y-1) is computed for each river link from internal hillslope, gully and riverbank erosion and upstream tributary inputs less floodplain and reservoir deposition losses. The net flux of suspended sediment is passed to the next downstream link. Transient storage of suspended sediment within the channel network is neglected because this is considered small relative to total yields over multi-decadal timescales (Wilkinsonet al., 2009).
Hillslope soil erosion is modelled using a spatially-distributed version of the Revised Universal Soil Loss Equation (RUSLE, Renardet al., 1997). RUSLE is used to predict mean annual soil loss (A, t ha-1y-1) from rill and interrill erosion based on the product of six empirically-derived factors:
A¼RKLSCP (1)
These are rainfall erosivity (R), soil erodibility (K), slope length (L) and steepness (S), cover (C) and management practice (P). The procedures for calculating each RUSLE factor are outlined in Table I. In the absence of specific information about management practices across the study basins,Pwas not explicitly included in the computation ofA(i.e. it was set to 1). SedNet does not include representation of small-scale features such as roads, tracks or ditches that may either generate sediment or act as transport pathways. The RUSLE factors were produced as a set of raster grids with three grids forCfactors corresponding to the 1990, 2000 and 2007 land cover surveys.
The proportion of sediment from hillslope erosion delivered to the river network was represented using a hillslope sediment delivery ratio (HSDR). This is designed to account for the discrepancy between plot-scale erosion rates and small basin sediment yields, reflecting short sediment travel distances on hillslopes (Parsonset al., 2006) and storage opportunities (e.g. farm dams, contour banks) between slopes and the channel network (Prosseret al., 2001b; Slattery et al., 2002). At larger basin scales, it is not practical to capture the small scale variability in HSDR. Therefore, the HSDR was set to 0.15 in the present study in accordance with field measure-ments made by Wallinget al. (2002) in small agricultural basins (<4 km2) in central England. The mean annual supply of hillslope-derived sediment (HSx,t y-1) to the modelled channel
network in each river link is determined byHSx¼HSDR
Xj¼n
j¼1 Aj,
whereAjis the mean annual RUSLE erosion rate calculated for each grid celljin the internal drainage area containingncells for each river linkx.
Table I. Summa ry of data inp uts and pro cessin g for calcul ation of th e R U SLE fac tors for use in the Se dNet model RUSL E facto r D a ta input and sou rce Data pro cessin g Rainf all erosiv ity ( R ) Plymo uth Unive rsity , Princ etown and St Mawga n (1 2 – 15 year s) sub-ho urly rainfall re cords; Rai nfall er osivity ( R ,M Jm mh a -1 h -1 y -1 ) was ca lculate d using th e kinetic ener gy re lationship of Marshal l and Palmer (1948) re comme nded for th e U K b y Mor gan (20 01): Bri tish Atm ospher ic Data C entre, Pl ymouth Univ ersity and the UK Met O ffice KE = 0 .0895 + 0.0 844 log 10 ( I ) whe re KE is kine tic ene rg y per unit rainfall (M J h a -1 mm -1 ) and I is rain fall intens ity (mm h -1 ). EI30 was calcul ated for each event as the produ ct of total kine tic ene rg y ( E ,M J h a -1 ) and th e max imum 30-m in ra infall intens ity ( I30 ,m m h -1 ). The linear regres sion R = 1.3 723 A 551.27 ( R 2 = 0.9 5) betw een the annu al sum of EI30 ( R ) and annual rainfall ( A ,m my -1 ) for data from the th ree rain ga uges was used to ca lculate gr idded R values usin g the 1 × 1 k m g ri d o f 30-year mea n annual pre cipit ation (1971 – 2000) fo r the river basins. Soil er odibility ( K ) Digita l soil vector m a p and soil attribute data; Soil ero dibility (K, t h a h ha -1 MJ -1 mm -1 ) was calcul ated accor din g to W ischm eier and Smit h (1978) : Nation al Soil R esource s Institute, C ranfield Unive rsity a K ¼ 2 : 1 x 10 4 12 OM ðÞ M 1 : 14þ 3 : 25 S 2 ðÞ þ 2 : 5 P 3 ðÞ 7 : 59 x 100 whe re OM is soil or ganic matter con tent (%), M = (% silt + % v ery fine sand) x (100 -% c lay), S is th e soil structur e class and P is the perm eability cla ss. Slope leng th ( L ) 1 0 m DE M Slop e leng th ( L ) was calcul ated on the basi s o f con tributing area s accor din g to Desme t and Gov ers (1996) : UK O rdnance Surve y
Li;j
¼
Ai;
j ; in þ D 2 ðÞ m þ 1 A m þ 1 i ; j ; in D m þ 2x
m i;j
22 : 13 ðÞ m whe re
Ai,
j , in is the contrib uting area (m 2 ) to the grid cell with coordi nate s (i,j), D is the gr id cell siz e (10 m ),
xi,j
=
sin
αi,j
+
cos
αi,j
,whe
re
αi,j
[image:4.595.144.470.50.792.2]river link (BEx, t y-1) is modelled by relating link stream power (pgQbfSx) to bank erodibility (Wilkinsonet al., 2005), which is represented as a function of riparian vegetation and floodplain width, as in the following equation:
BEx¼cρgQbfSxð1PRxÞ 1e0:008Fx
Lxhρsps
ð Þ (2)
wherecis a coefficient that is set to limit the maximum bank retreat rate (c= 0.0001),ρis the density of water,gis accelera-tion due to gravity,Qbfis bankfull discharge (m3s-1),Sxis the energy slope approximated by channel gradient, PR is the proportion of intact riparian vegetation along a river link (defined here as forest or woodland cover in 1× 25 m cell either side of the modelled channel network ),Fxis floodplain width (calculated as floodplain area divided by river link length),Lx is the link length (m),his mean bank height (0.93 m),ρsis soil bulk density (1.5 t m-3for the full bank profile) andpsis the proportional bank contribution of fine sediment to suspended load (Table II). Bankfull discharge was defined as the flow with a recurrence interval of 1.5 years on the annual series based on a survey of UK rivers (Davidson and Hey, 2011). The increasing proportion of riparian forest or woodland along a river link was considered to reduce bank erodibility through the effect of tree root reinforcement increasing bank stability (Thorne, 1990; Abernethy and Rutherfurd, 2001). Floodplain width was used as a surrogate for exposure to bedrock such that there was an exponential decline in bank erodibility with decreasing floodplain width corresponding to increased bedrock exposure (Wilkinsonet al., 2005).
Floodplain deposition (FDx, t y-1) is computed as a function of floodplain area and the median value of daily overbank flow (Prosseret al., 2001b):
F Dx¼
Qf
Qð ÞIx 1e
vAf
Qf !
(3)
whereQfis the median of the set of daily overbank discharges determined from the amount by which total daily discharge (Q) exceeds bankfull discharge (Qbf), Ix is the total suspended sediment supply to the linkx,Afis the floodplain area andv is the particle settling velocity (1 × 10⁻⁶m s-1) based on Stokes Law for particles with diameters 1–4μm such that that larger particles can be expected to have settled during the period of overbank flow (Wilkinsonet al., 2009). It is assumed that the proportion of sediment delivered to the floodplain equates to the proportion of discharge that goes overbank relative to total discharge. The floodplain extent was defined by the Multi-Resolution Valley Bottom Flatness (MRVBF) terrain index developed by Gallant and Dowling (2003). Reservoir deposi-tion is calculated as a funcdeposi-tion of the mean annual reservoir inflow and its total storage capacity based on a revised version of the Brune Rule that is used to determine sediment trapping efficiency (Brune, 1953; Heinemann, 1981).
Hydrological regionalization is required to provide esti-mates of mean annual discharge (MAD), bankfull discharge (Qbf), and median overbank discharge (Qf) for each river link for use in erosion and deposition modelling. This is based on long-term gauge records of unregulated discharge (Table II) for which MAD, Qbf and Qf were calculated. The runoff coefficient (Rc) is estimated by combining a simplified water balance whereRc= (PE)/Pwith a rational function relating mean annual precipitation (P), evapotranspiration (E) and potential evaporation (E0) (Zhanget al., 2004), to give Equation
(4) (Wilkinsonet al., 2006): Table
[image:5.595.351.513.55.791.2]Rc¼ 1þ
E0 P
a Eð0=PÞþb
ð Þ
" #1=ða Eð0=PÞþbÞ
E0
P (4)
The parametersaandbare fitted by least squares regression for
E0/PversusRcfor the gauged river basins.Rcwas estimated for all river links based on the mean of the griddedE0/Pfor each link and then used to calculateMADfor all links, whereMAD=RcPAand
A is the internal drainage area for each link. Qbf and Qf are regionalized as a function ofMADusing gauge data whereQbf=
g(MAD)handQ
f=j(MAD)kandg,h,jandkare fitted parameters (Wilkinsonet al., 2004). Flow in the Tamar basin is affected by the operation of Roadford Reservoir (built 1989; capacity 34.5 GL) in the Lyd sub-basin and to a lesser extent the Upper Tamar Lake (built 1975; capacity 1.48 GL) in the north (Figure 1(a)). River gauge data available for the period following reservoir construction (Table II) was used to adjust the regionalizedMAD
for river links affected by reservoir diversions and this change was propagated to downstream links.
Radionuclide residence time model
The residence time model computes radionuclide mass balances using basin inputs and fluvial export of7Be,210Pbexand137Cs for river basins divided into slow and rapid transport compartments. The compartments are defined according to transport velocity (Dominiket al., 1987). The slow compartment represents the up-per soil profile containing the fallout radionuclide inventories (<0.30 m soil depth). It is characterized by long residence times that correspond to the period of storage and transfer of radionu-clides from the upper soil profile to the rapid compartment. The rapid compartment represents river and reservoir surfaces as well as the immediate surroundings that have much shorter radionuclide residence times. This includes runoff and sedi-ment-generating areas on hillslopes that are connected to the river network. Rapid compartment residence times were consid-ered to represent the mobilization and transfer of radionuclides from connected source areas to the basin outlets over approxi-mately seasonal to annual timescales. Model estimates of resi-dence times should be interpreted as mean values under steady state conditions for each land cover.
The fallout radionuclides employed here have been widely used as soil erosion and sediment source tracers (see reviews by Wallbrink and Murray, 1993; Walling, 2003; Mabitet al., 2008; Taylor et al., 2013).7Be (t
1/2= 53 days) is a naturally occurring radionuclide produced by cosmic ray spallation of nitrogen and oxygen in the upper atmosphere. Fallout occurs predominantly in association with precipitation (Wallbrink and Murray, 1994).210Pb
ex(t1/2= 22 years) refers to the amount of 210Pb derived from atmospheric fallout that exceeds that supported by decay of its lithogenic parent 226Ra in situ. 137Cs (t
1/2= 30 years) was produced by atmospheric nuclear weapons testing during the 1950–1960s and dispersed globally, with subsequent less extensive releases from the Chernobyl and Fukushima nuclear power plant accidents. The main basis for use of these fallout radionuclides as sedi-ment tracers is their tendency to strongly adsorb to fine particles (Cremerset al., 1988; He and Walling, 1996). This is reflected in the high partition coefficients (Kd). In the present study,Kd values of 1.0 × 10⁵, 1.0 × 10⁶and 8.4 × 10⁴L kg-1for freshwater conditions were used for7Be,210Pb
exand137Cs, respectively, based on the summary of values presented by Le Cloarec
et al. (2007). Use of these values assumes that environmental conditions which may affect radionuclide mobility between the particulate and dissolved phases remain unchanged across the study basins (Tayloret al., 2012).
The model requires estimates for the atmospheric input of 7Be and 210Pb
ex, the soil inventory of 137Cs (since fallout is now negligible) and fluvial export of particulate and dissolved fractions. Atmospheric fallout was estimated using mean annual rainwater concentrations for 7Be and 210Pbex of 1.97 ± 0.3 Bq L-1(Taylor, 2012) and 0.1 ± 0.008 Bq L-1(Peirson et al., 1966), respectively.7Be in rainwater was measured south of the Tamar basin at Plymouth during 2009-2010, while 210Pb
ex was measured between 1962 and 1964 at Milford Haven in south Wales. Mean annual rainwater concentrations were combined with 1 × 1 km gridded data for 1971–2000 mean annual precipitation to compute mean annual fallout for each river basin (Table III). The 137Cs soil inventory (ICs, Bq m-2) was estimated using the regression relationship I
Cs= 4.16R+ 1400, whereRis mean annual rainfall. This was de-rived by Applebyet al. (2003) using soil inventory data (to 0.3 m depth) from locations across Great Britain that were sampled in 1977 (Cawse, 1983). This relationship was applied to the gridded mean annual precipitation data to estimate the 137Cs inventory for each river basin, which was corrected for radioactive decay to 2012. There was negligible fallout from the 1986 Chernobyl nuclear accident in south-west England (Wallinget al., 1989).
The proportional contribution of sediment from hillslope surface and channel bank erosion affects the activity concentra-tions of fallout radionuclides in suspended sediment (Wallbrink
et al., 2003; Smith et al., 2011). This reflects the soil profile distribution of the radionuclides, where maximum concentra-tions occur at or near the surface and decrease exponentially with depth to negligible levels (Wallbrinket al., 1999). Therefore, the effect of changes in modelled hillslope and channel bank sediment contributions on radionuclide activity concentrations required consideration. The measured activity concentrations (Table III) were considered closest to values for suspended sedi-ment exported under 2007 land cover because of a consistent trend of increasing arable land from 1990 to 2007 that increased modelled hillslope sediment contributions. Suspended sediment activity concentrations for the 1990 and 2000 simulations were scaled by the modelled proportion of hillslope sediment supply (HS) relative to total supply (TS) for each river basin. This ratio was then divided by the equivalent ratio for 2007 and multiplied by the measured activity concentrations for each radionuclide (Cm) to give the estimated concentrations (Cet) for survey years
t(1990, 2000):
Cet¼Cm ðHS=TSÞt=ðHS=TSÞ07
(5)
Fluvial export of radionuclides associated with suspended sediment was calculated by multiplying the estimated (1990, 2000) or measured (approximating 2007) concentrations with the respective modelled mean annual suspended sediment output for each river basin. The factor changes in estimated activity concentrations for 1990 and 2000 compared with measured values equated to 0.62–0.78 and 0.91–0.98, respec-tively. The effect of earlier radionuclide activity concentrations on subsequent estimates for suspended sediment were considered minimal because of the frequency of higher magnitude flows that could be expected to remove fine sediment from storage within the channel network over approximately seasonal to annual timescales. The dissolved radionuclide flux (Fd) was determined using the literature-based Kdvalues for fresh water with activity concentrations for suspended sediment (C) and regionalized mean annual discharge (MAD) for each river basin (whereFd=C(1/Kd)MAD).
by the slow (Ss) and rapid (Sr) transport compartments is used to partition atmospheric fallout (Equation (6)):
SsþSr¼1 (6)
The mass balance for the slow compartment is represented by input from atmospheric fallout (Fa) with losses from the soil radionuclide inventory (Is) dependent on the rate of transport out of the slow compartment (ks) and radioactive decay (λ):
FaSs¼IsðksþλÞ (7)
The transport rate out of the slow compartment is related to the residence time (τs) byks= 1/τs. For the rapid compartment, atmospheric input is added to the flux from the slow compart-ment which is balanced by losses due to fluvial export or radio-active decay:
FaSrþIsks¼IrðkrþλÞ (8)
whereIris the radionuclide inventory in the rapid compartment andkr is the rate of export from the rapid compartment. The fluvial export of radionuclides from the river basin (Fr) is calculated as
Fr¼Irkr (9)
Solutions to Equations (6–9) for the unknown variablesSr,ks,
kr, Is andIr can be obtained using estimates of atmospheric fallout, soil inventory (137Cs only) and fluvial export for all three fallout radionuclides (Dominiket al., 1987; Le Cloarecet al., 2007). However, these solutions require several assumptions. The first is that most7Be in the slow compartment will be lost to radioactive decay rather than be exported from this compart-ment given its short half-life of 53 d (i.e.ks≪λBe). Export from the slow to the rapid compartment is considered negligible compared to atmospheric fallout to the rapid compartment (i.e. ks(Is)Be≪Sr(Fa)Be). It is also assumed that the duration of sediment storage in the rapid compartment does not result in net decay of 7Be to levels below the limit of detection. Furthermore, the decay rate of210Pbexis considered negligible compared to the export rate from the rapid compartment (i.e.λPb≪kr).
The rapid compartment area (Sr) can be determined by combining Equations (8) and (9) based on the first assumption such thatSris a function of the ratioFr/Fa for7Be and the export rate (kr= 1/τr):
Sr¼
Fr
Fa Be λBe
kr þ 1
(10)
The slow compartment residence time (τs) is then computed by solving Equations (6)-(9) for210Pb
exwith the assumption that λPb≪krand combining this with Equation (10):
τs¼
1 λPb 1
Fa
Fr Pb
h i
Rr
Ra ð1þλBeτrÞ 1
(11)
whereRr= (Fr)Be/(Fr)PbandRa= (Fa)Be/(Fa)Pb.
Slow compartment residence time can also be calculated using the mass balance equations for 137Cs with basin-scale inventory (M) rather than fallout (Le Cloarecet al., 2007) to give:
τs¼ Mð ÞFr Csτr
Fr
ð ÞCsðλCsτrþ1Þ
(12)
whereM= (Is)Cs+ (Ir)Cs
The rapid compartment residence time (τr) may then be obtained by combining Equations (11) and (12) and finding a
Table III. Study basin characte ristics, estimated fall out and mea n activ ity concen trations obtaine d from time-integra ted susp ended sedimen t sam pling Estimated m ean fallout, Fa (M Bq y -1 ) Mean su spende d sedim ent ac tivity con centratio n ± SE (Bq kg -1 ) d Riv er basins
Basin area
(km 2 ) Mea n annual pre cipitation, MA P (mm) Mode lled mea n annual di schar ge , MA D (mm ) Rel ief ratio, RR a Norm alised MA D.RR b 7 Be (× 10 5 ) 210 Pb ex (× 10 5 ) 137 Cs, M (MBq, ×10
[image:7.595.63.280.56.791.2]solution to the equation:
að Þτr 2þbð Þ þτr c¼0 (13) where
a¼ ð ÞFr Cs
Rr
Ra λBeλPb
b¼M Rr
Ra λBeλPb
Fr
ð ÞCsλPb Rr
Ra 1
ð ÞFr CsAλCs
c¼λPbM Rr Ra
1
A Fð Þr Cs
in which
A¼1 Fa
Fr Pb
A sensitivity analysis similar to that employed by Le Cloarec
et al. (2007) was used to determine the effect of changes in input parameter values onτs,τrandSr. Factor changes of 0.5 and 1.5 were applied to suspended sediment flux (SS), Fa (210Pb
ex),Fa(7Be) andM(137Cs) for the Tamar basin upstream of Gunnislake under 2007 land cover. Changes in model outputs that resulted from effectively ignoringKd(set to 1 × 10¹²L kg-1) as well as varying radionuclide activity concentrations by ± 2 standard errors were also examined. Factor changes in model outputs were determined by the equation:
FC¼1þðOvOiÞ
Oi
(14)
whereFCis the factor change in model outputs (O) resulting from the relative difference between outputs based on varied parameter values (Ov) and initial parameter values (Oi).
Results and Discussion
Sediment budgets and land cover change
Suspended sediment budgets were modelled for the entire Tamar River basin for land covers corresponding to the 1990, 2000 and 2007 surveys. These basin-wide budgets show a large increase in hillslope sediment contributions between 1990 and 2007 in response to an increasing proportion of arable land (Table IV). The mean annual hillslope sediment contribution range for 1990–2007 was 8.8–32 kt y-1with an
[image:8.595.49.288.69.243.2]HSDR of 0.15. The bank erosion contribution to suspended sediment was between 7.7 and 8.4 kt y-1. Total sediment stor-age in reservoirs and floodplains was minor (1.3–3.6 kt y-1) resulting in mean annual basin suspended sediment exports of 15–37 kt y-1, which equated to a range in yields of 16–40 t km-2y-1 based on the HSDR of 0.15. The increase in river link (n= 92) suspended sediment flux between consecutive land cover surveys was distributed across the Tamar basin (Figure 2).
Table IV. Summary of suspended sediment budgets for the River Tamar basin upstream of Gunnislake for three land covers and twoHSDRvalues
Land cover survey
Arable land
area (%) HSDR
Inputs (kt y-1) Outputs (kt y-1)
Hillslope Channel banks Reservoir Floodplain Basin export Basin yield (t km-2y-1)
1990 6.3 0.05 2.9 7.7 0.15 0.6 9.9 11
2000 22 0.05 7.8 7.7 0.23 0.8 14 16
2007 36 0.05 11 8.4 0.40 1.1 18 19
1990 6.3 0.15 8.8 7.7 0.42 0.9 15 16
2000 22 0.15 23 7.7 0.67 1.7 29 31
[image:8.595.104.497.553.759.2]2007 36 0.15 32 8.4 1.2 2.4 37 40
The highest modelled fluxes occurred in the headwaters of the River Lyd sub-basin (Figure 1(a)), which was characterized by the highest rainfall erosivity, local slope gradients and basin relief ratio values.
Uncertainty in change detection between land cover surveys represents an important challenge in the use of remotely sensed datasets (Fulleret al., 2003). Accuracy in the detection of land cover changes is of less concern if the focus of modelling were to use only these data to characterize land cover scenarios for modelling. However, accurate detection of land cover changes during the survey period (1990–2007) is important if model outputs are to be interpreted as a meaningful representation of the effects of recent change. The large increase in arable land cover (6.3 to 36%) represented the main change during the survey period. It was mostly offset by a reduction in the areas classified as grassland. Other land uses such as forest/ woodland (11–16%), urban (1–3%) and shrub/heath/bog (all 1%) were reasonably consistent between surveys.
The trend of increasing arable land cover for the Tamar basin can be assessed by comparison with land use data from county-scale farm surveys for Devon and Cornwall (Department of Environment, Food and Rural Affairs (DEFRA), 2010). Between the 1995 and 2005 surveys, there was an 8% and 6% increase in cropped land area in Devon and Cornwall, respectively. In-terpolating between farm survey years suggests an increase of 13% and 24% for Devon and Cornwall from 1990 to 2007 compared with 30% for the Tamar basin. There was also a consistent trend of increasing arable land area between consec-utive farm surveys spanning the full land cover survey period (1985–2009). This provides increased confidence in the changes in arable land cover recorded in the Tamar basin by satellite imagery. It also indicates that model simulations are relevant for understanding the effect of recent land cover changes on erosion and sediment transfer.
Particle residence times
Modelled slow compartment residence times for the river basins were 13–48, 7.7–17 and 5.6–14 ky for the 1990, 2000 and 2007 land covers, respectively (Table V). The decline in the theoretical mean residence times of radionuclides in the upper soil profile was related to the increase in arable land area and associated increase in modelled suspended sediment exports with consecutive land cover surveys (Table V). Between 1990 and 2007, arable land cover in the river basins increased from 3.7–7.7 to 26–43% while modelled suspended sediment exports increased from 0.5–15 to 1.4–37 kt y-1. Slow compart-ment residence times decreased because there was negligible change to the modelled atmospheric flux (FaSs) or137Cs inven-tory (M) and increased fluvial export associated with increased suspended sediment output. This corresponds to an increase in the radionuclide transport rate out of the slow compartment (ks) that results in a decrease in the residence time (i.e.τs= 1/ks).
Slow compartment residence times cannot represent deeply eroded sediment from channel banks (i.e. sediment from below the depth of the137Cs inventory). This is because the model is unable to estimate the residence time of sediment that contains negligible levels of the fallout radionuclide tracers. Such sedi-ment may come from deep colluvial or floodplain deposits that have not been exposed to fallout for long periods and where initial radionuclide activity has decayed to negligible levels. Therefore, the residence time estimates do not apply to parti-cles stored in and subsequently eroded from these deposits.
Combining the modelled hillslope erosion rates with the slow compartment residence times produced an estimate of soil denudation depths. This was calculated using the mean
RUSLE-derived hillslope erosion rate for the entire Tamar basin with the estimatedHSDRof 0.15 to give net hillslope erosion rates for each land cover survey. The resulting range in mean denudation depths was 0.28–0.36 m, which equated to denudation rates of 11–39 mm ky-1. These values were determined using a mean area-weighted soil bulk density of 0.9 t m-3. This was calculated from spatially-distributed particle size and organic mat-ter data for upper surface soils (mean maximum depth 0.23 m) in the Tamar basin using the method of Rawls (1983). The range in denudation depths was consistent with the depth of the upper soil profile containing the137Cs inventory (~0.3 m).
The slow compartment residence times were related to a basin-scale index of sediment transport capacity to support a physical interpretation of model outputs. This index was based on the representation of sediment transport capacity (qs) as a function of discharge per unit slope width (q) and surface gradi-ent as an approximation for energy slope (S), whereqs=kqβSγ, andk,βandγare empirical or theoretically derived constants (Prosser and Rustomji, 2000). At the basin scale, modelled mean annual discharge per unit basin area was multiplied by the energy gradient approximated by basin slope using the relief ratio (RR), while the constants were set to 1.0. Both variables were normalized by their respective maximum values to produce a new index (MAD.RR) that varied between 0 and 1 (Table III).
Slow compartment residence time varied as a negative power function of MAD.RR for each land cover survey (Figure 3). The fitted power functions exhibited R2values rang-ing between 0.69 and 0.84 (P<0.05). As sediment transport capacity (MAD.RR) approaches zero the slow compartment residence time goes to infinity, whereas at MAD.RR = 1 the co-efficient equates to the minimum residence time associated with each land cover for the set of basins analysed. These min-imum values were 13044, 6162 and 5392 years for the 1990, 2000 and 2007 land cover surveys, respectively. The decrease in the value of the coefficient and increase in the exponent captured the increase in basin-scale erodibility with increasing arable land area. With the increase in sediment available for transport, the range in slow compartment residence times asso-ciated with each function declined from 35 000 to 8400 years as sediment supply approaches basin-scale transport capacity. A theoretical minimum slow compartment residence time for each river basin would occur when sediment supply reached transport capacity assuming steady state conditions.
Table V . Modelle d suspe nded sedi ment and fallo ut radion uclide (FR N) exp ort and ass ociate d reside nce time s fo r the slow (upper surfac e soils ) and ra pid (rive r and conn ected hillslope sou rce ar ea) compa rtmen ts for the seve n river basi ns and three land cov er survey s Mode lled FRN exp ort, Fr (MBq y -1 ) a Mode lled par ticle reside nce time s Rapid compa rtmen t area, Sr (%) Riv er basin/ survey year A rable land area (% ) Mode lled suspen ded sedi ment export (kt y -1 ) 7 Be (× 10 2 ) 210 Pb ex (× 10 2 ) 137 Cs (× 10 2 ) Slow , τs uppe r soil pr ofile (ky) Rap id, τr river and connect ed a rea (d )
1990 Tamar
Upp er 7.0 3.0 3.9 0.9 0 0.1 6 4 3 185 0. 2 O ttery 6.1 1.5 2.0 0.4 8 0.0 8 4 8 204 0. 2 C arey 6.6 0.9 1.0 0.3 0 0.0 6 3 3 256 0. 3 Kens ey 5.6 0.5 1.5 0.3 9 0.0 5 2 2 248 0. 6 Ly d 7.7 4.7 7.4 2. 3 0.5 2 1 3 241 0. 5 In ny 3.7 1.2 2.8 0.7 5 0.1 3 2 6 231 0. 4 T amar Gun nislake 6.3 15 25 5. 7 1.0 27 188 0. 4
2000 Tamar
Upp er 25 5.6 8.4 2. 2 0.3 3 2 1 244 0. 6 O ttery 27 3.9 6.0 1. 8 0.2 2 1 7 297 0. 9 C arey 21 1.5 2.0 0.6 7 0.1 1 1 7 322 0. 7 Kens ey 22 1.3 3.9 1. 3 0.1 3 8 .6 362 2. 3 Ly d 1 4 7.0 12 4. 1 0.8 6 7 .7 280 1. 0 In ny 17 2.7 7.3 2. 5 0.3 1 1 0 344 1. 4 T amar Gun nislake 22 29 56 15 2.3 12 243 1. 0
2007 Tamar
[image:10.595.139.476.50.792.2]output (Fr). This led to an increase in the7Be inventory (Ir) of the rapid compartment. Therefore, the rapid compartment trans-port rate (kr=Fr/Ir) decreased and the residence times (τr= 1/kr) increased with consecutive land cover surveys.
Model estimates of rapid compartment residence times assume that the duration of sediment storage will not result in net decay of7Be to levels below the limit of detection. In the Tamar basin, detectable levels of 7Be were measured in suspended sediment samples collected using the time-integrated samplers over monthly intervals. The duration of in-channel storage of fine sediment would be unlikely to reduce7Be activity concentrations to negligible levels due to the frequency of flushing flows. Also fine sediment stored in-channel should not accumulate significant amounts of unat-tached210Pb
ex. This has previously been used as a measure of in-channel residence time where storage times span a mini-mum of several years up to decades (Wallbrinket al., 2002). The monthly suspended sediment samples collected over a 12 month period were assumed to capture the variability asso-ciated with7Be accumulation and decay in surface soils. This variability was reflected in the coefficient of variation for7Be activity concentrations on suspended sediment, which ranged between 28 and 58%.
The increase inSrmay be considered to reflect the expansion of connected near-channel source areas with increasing sedi-ment supply. This is consistent with an increase in the area of arable land intersecting with the channel network that could supply more sediment. In the modelled scenarios for the Tamar basin, this equated to 0.6, 2.9 and 4.1 km2of riparian arable land within an arbitrarily defined 25 m buffer surrounding the modelled channel network for 1990, 2000 and 2007, respectively. The increase in rapid compartment residence times may also be interpreted in the context of the increase inSr. Larger source areas are likely to correspond to longer sediment travel distances and hence increased residence times.
Temporary sediment storage on-slope is important for under-standing timescales associated with hillslope sediment delivery processes. Particles move by a series of transport steps that may not scale with slope length (Parsonset al., 2006). Runoff ratios tend to decline with increasing slope length (Sheridan et al.,
2013), which also contributes to increased particle residence times on longer slopes. Owing to the frequency of higher magnitude flows in the river network, the storage duration for most fine sediment within channels is probably short. There-fore, rapid compartment residence times may be largely associ-ated with the number of runoff events required to deliver a particle to the channel network and the duration of particle storage between runoff events within connected slope source areas. The increase in rapid compartment residence times related to the expansion of connected source areas is conceptually linked to the increase in near-channel arable land that generates more sediment for transport.
Model evaluation and sensitivity
Sediment budgets
Modelled sediment budget components were examined in rela-tion to available regional datasets in the absence of basin-specific validation data. The components considered were divided according to budget inputs that included RUSLE hillslope erosion rates, the hillslope sediment delivery ratio (HSDR) and channel bank erosion, and budget outputs, namely floodplain storage and basin-scale suspended sediment exports.
Mean RUSLE hillslope erosion rates calculated at the grid scale for forest, arable areas and grassland were 0.05–0.07, 6.0–6.8 and 0.29–0.31 t ha-1y-1, respectively. These erosion rates represent the range in mean values for each land cover recorded at the basin-scale for the three cover simulations. Combined, the three land cover types equate to 95–98% of the Tamar basin area. Therefore, the mean erosion rates capture the spatial variation in rainfall erosivity, soil erodibility, slope contributing area and gradient for the three land cover types across the basin. Model performance was assessed against regional datasets as well as a large-scale compilation of European erosion plot data.
Modelled mean erosion rates were generally consistent with published data. At the local scale, monitoring (1 year) in a small first-order grassland basin (0.46 km2) located in Devon produced an estimated net erosion rate between 0.5 and1.2 t ha-1y-1for clayey soils (Bilottaet al., 2010). These rates exceed long-term (11 years) plot-scale measurements for sandy soils under grass cover in central England, which gave a mean of 0.23 and range 0.1–0.5 t ha-1 y-1 (Fullen, 1998). Measurements in cultivated and pasture fields with clay-loam soils in south Devon using 137Cs indicated erosion rates of 8.0 and 0.16 t ha-1y-1, respec-tively (Owenset al., 1997). Furthermore, erosion rates estimated using 137Cs for arable and pasture fields were 1.2–8.5 and 0.2–5.3 t ha-1 y-1, respectively, in two small lowland basins (Wallinget al., 2002). However, comparison between modelled erosion rates and those measured using137Cs was limited by (i) difficulty in directly relating field-scale erosion measured using 137Cs to soil loss estimates for slope segments based on RUSLE and (ii) untested assumptions in the use of137Cs to measure soil erosion that could produce erroneous results (Parsons and Foster, 2011). Analysis of a compilation of erosion plot data from across Europe that excluded the Mediterranean zone produced mean forest, cultivated and grassland erosion rates of 0.003, 6.3 and 0.29 t ha-1y-1, respectively (Cerdanet al., 2010). The modelled arable and grassland erosion rates are consistent with this plot data. The much lower forest erosion rate was based on only 60 plot-months of data compared with 6635 and 1535 plot-months for cultivated and grassland plots (Cerdanet al., 2010).
The modelled suspended sediment budgets were highly sen-sitive to change in theHSDR. An increase inHSDRfrom 0.05 to 0.15 corresponded to an approximately 3-fold increase in the basin-wide hillslope sediment contributions and a 1.5–
[image:11.595.45.287.42.288.2]fold increase in the basin suspended sediment exports (Table III). TheHSDRof 0.15 was selected on the basis of the detailed sediment budgets developed by Wallinget al. (2002) for two small basins in central England (<4 km2). These budgets measured in-field and field-to-channel deposition relative to gross erosion estimated using 137Cs. While subject to the aforementioned uncertainties in the use of 137Cs to measure soil erosion, these HSDR values provide the only available estimates of hillslope-to-channel sediment delivery in compa-rable agricultural basins and at a spatial scale equivalent to that of the individual river link drainage areas (mean ± SD = 9.96 ± 7.7 km2) used in SedNet modelling of the Tamar basin. The HSDRof 0.15 was also chosen with reference to the resulting basin suspended sediment yields, which were consistent with regional yield estimates, as shown below.
Modelled link-average bank erosion rates ranged between 0 and 0.19 m y-1(mean = 0.02 m y-1) based on a coefficient value set to 0.0001 (Equation (2)) to limit the maximum rate of bank retreat (Wilkinsonet al., 2004). These bank retreat rates are in the low range of mean rates (0.03–1.18 m y-1) from field measure-ments (1–3 y) for streams and rivers with basin areas ranging from 4.8–620 km2in south-west England (Hooke, 1980; Murgatroyd and Ternan, 1983). Longer-term (1840–1975) bank retreat rates measured from historic maps ranged from 0–1.79 m y-1(Hooke, 1980). However, the comparatively low modelled bank erosion rates may be reasonable for several reasons. First, bank monitor-ing locations in the study by Hooke (1980) were biased towards areas of likely maximum erosion, particularly open floodplain sites. In contrast, the modelled channels have mean riparian for-est cover ranging over 26–33% of the length of river links, thereby reducing bank retreat rates. Second, channel network confinement by bedrock and steep hillslopes occurs in many locations across the Tamar basin and limits lateral channel change. Third, low bank retreats rates are consistent with the preservation of small areas of floodplain in the Tamar basin. The modelled floodplain occupies 2.8% of the total basin area and has a mean width of only 70 ± 62 m. The largest area of floodplain occurs in the mid-basin where four tributaries join the main channel (Figure 1(b)). This represents productive agri-cultural land and hence bank stabilization measures have been adopted in some locations. It should be noted that modelled floodplain storage inputs do not offset channel bank losses (Table III). This should not be interpreted to imply a net loss from floodplain units. Channel bank erosion includes contributions from non-floodplain areas such as colluvial footslopes, while floodplains also receive inputs from adjacent hillslopes. No explicit calculation of hillslope-derived sediment inputs to floodplain storage units is made by the SedNet model.
Modelled floodplain deposition rates were low. Mean (and maximum) deposition rates for the 1990, 2000 and 2007 land covers were 0.04 (0.1), 0.08 (0.2) and 0.12 (0.3) mm y-1, respectively. Measurement of floodplain deposition rates using 137Cs in five river basins (276–3717 km2) in southern England yielded a range in mean reach-scale values of 0.7–1.6 mm y-1 since the mid-1950s (Walling and He, 1998). Inundation of these floodplain reaches was estimated to occur several times per year. In another study set in northern England, the mean sedimentation rates for floodplain transects extending from the channel margin to the outer floodplain were 0.07–3.7 and 0.1–1.5 mm y-1for the River Ouse and River Tweed, respec-tively (Wallinget al., 1999). These rates were converted from g cm-2 y-1 to mm y-1 using a sediment bulk density of 1.5 g cm-3. The lower modelled floodplain deposition rates prob-ably result in part from the effect of averaging annual overbank sediment deposition across the entire modelled floodplain area for each river link. Floodplain deposition is not spatially uniform, as shown by declining sedimentation rates with distance from
channels (Wallinget al., 1999). The comparison with mean rates for transects spanning most of the floodplain reduces this disparity. Floodplain inundation frequency is also an important factor distinguishing sedimentation rates. SedNet simulations used a basin-wide bankfull discharge frequency of 1.5 years on the annual series to determine the proportion of overbank flow. Inundation frequency will be higher in some near-channel locations, as was the case for floodplain reaches measured by Walling and He (1998).
Modelled suspended sediment yields for the Tamar basin at Gunnislake were 16–40 t km-2y-1using anHSDRof 0.15 for the three land covers. This range in yields is comparable with suspended sediment yields obtained from longer-term (1994–2003) monitoring of three agricultural river basins (226–601 km2) in Devon (Harlowet al., 2006). These measured yields range from 24 to 45 t km-2 y-1, and provide a good comparison with modelled yields on the basis of general similarities in basin land use and hydroclimatic conditions. Such longer-term measurements of yield are preferable for use in assessing model performance given that SedNet computes mean annual budgets over a timescale of several decades. The modelled yields were also consistent with an earlier regional compilation of river basin suspended sediment yields from south-west England (Walling and Webb, 1987). In this compilation, the range in suspended sediment yields was 16–58 t km-2 y-1 for basins with areas ranging between 46 and 422 km2, excluding the three basins with more recent data reported by Harlowet al. (2006) and those basins<10 km2. This is also consistent with the modelled suspended sediment yields for the Tamar sub-basins (38–238 km2) which ranged from 12–21, 22–34 and 31–44 t km-2y-1for the 1990, 2000 and 2007 land covers, respectively. Notably, the range in modelled yields spanning the three land cover surveys is consistent with the range in measured yields. This indicates that the effect of land use change on modelled yields in the Tamar basin does not exceed regional variability in mean annual suspended sediment yields.
Particle residence times
The performance of the particle residence time model cannot be examined directly due to (i) the absence of independent validation datasets and (ii) the difficulty in validating estimates of slow compartment residence times for specific land covers that do not change through time. Instead we use a sensitivity analysis to identify those parameters which exert greater influ-ence on model outputs and compare estimates of parameter values with available measurements.
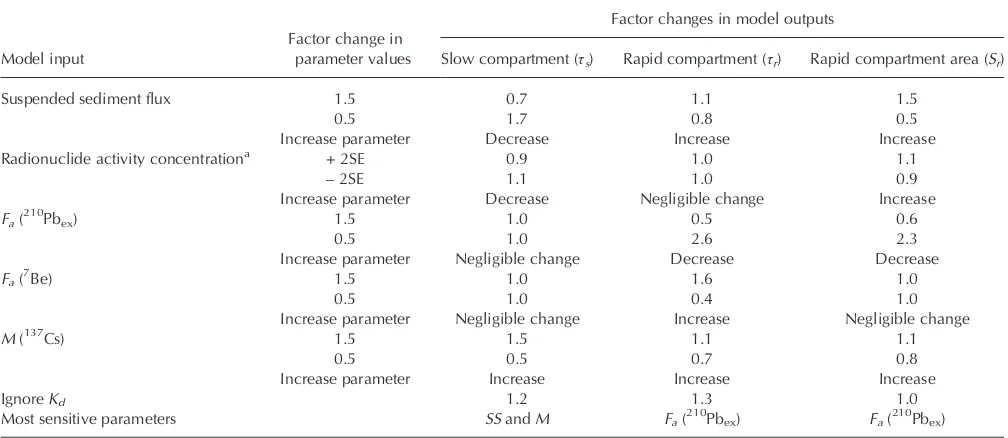
The sensitivity analysis showed that a factor change of 0.5 and 1.5 to individual model parameters could result in factor changes to slow and rapid compartment residence times ranging between 0.4 and 2.6 (Table VI). However, most changes in residence time estimates remained within the range 0.5–1.5. Slow compartment residence time was most sensitive to changes in suspended sediment flux and basin-scale137Cs inventory (M), whereas the rapid compartment residence time andSrwere most sensitive to changes inFa(210Pbex). Changes toFa(7Be) affected only the rapid compartment residence time. Slow compartment residence times were unaffected by changes inFafor7Be or210Pbex. Ignoring the partitioning of the radionu-clides between the dissolved and particulate forms (i.e.Kd→∞) increased model estimates ofSr, slow and rapid compartment res-idence times, by factors of 1.0–1.3 (Table VI). This was equivalent to the effect of increasingFa(7Be) orM, with a negligible effect for
suspended sediment yields were shown to be comparable with longer-term measurements from agricultural river basins in the region. Uncertainty in the measured mean radionuclide activity concentrations (Table III) used in calculatingFrwas constrained by the use of continuous time-integrated sampling that captured a range of flow conditions over a 12 month period. Varying these activity concentrations by ±2 standard errors had only a minor effect on model outputs (Table VI). However, the necessary scaling of activity concentrations to reflect changes in modelled hillslope and channel bank sediment contributions introduced additional uncertainty in residence time estimates. Decreasing the estimated suspended sediment activity concentrations for the 1990 and 2000 land cover simulations was consistent with lower modelled sediment contributions from hillslope surface erosion.Mwas estimated for each river basin using the relation-ship between soil 137Cs inventory and mean annual rainfall derived by Appleby et al. (2003) with the 1 × 1 km gridded 1971–2000 precipitation data. This produced a range in areal 137Cs inventories of 2820–3390 Bq m-2. This approach captured the spatial variability associated with precipitation patterns. Higher inventories occurred across elevated areas of the Tamar basin in the east and west compared with lower inventories in the centre and northern part of the basin.
Possibly the largest source of uncertainty in model inputs relates to the estimates ofFafor7Be and210Pbex. The range in areal fallout values used to deriveFafor7Be was 2330–2930 Bq m-2 y-1 (mean precipitation = 1180–1488 mm y-1). This was consistent with measurements of 2750 (Dominik et al., 1987) and 2670 Bq m-2y-1(Schuleret al., 1991) in Switzerland for precipitation of 1100–1200 mm y-1which is comparable with the study basins. However, it is higher than 1618 Bq m-2 y-1 (precipitation = 1328 mm y-1) at Milford Haven in south Wales (Peirson et al., 1966) and 1200 Bq m-2 y-1 (precipitation not reported) for the Seine River basin (Le Cloarecet al., 2007), but lower than 3912 ± 120 Bq m-2y-1(precipitation = 1884 mm y-1) in Cumbria, northern England (Shortet al., 2007). In addition to annual rainfall amount and latitude, solar activity is an important control of 7Be production, which varies by ~25% with the 11 year solar cycle (Kaste et al., 2002). Therefore, differences between studies may in part reflect solar variability. Variation in Fa (7Be) affects only the rapid compartment residence times (Table VI). The large range in reported annual
atmospheric fallout and the effect of solar variability indicates that rapid compartment residence times are probably subject to greater uncertainty than slow compartment residence times which are unaffected by variation inFa(7Be). However, it can be anticipated that this uncertainty was reduced to some extent by the use of 30 year mean annual precipitation data to compute7Be fallout.
The range in estimated mean areal fallout values used to deriveFa for 210Pbex was 118–149 Bq m-2 y-1. These values were less than 165 ± 8 Bq m-2y-1based on measurements of 210Pb
exconcentration in rainwater for 1997–1998 in Cumbria (Short et al., 2007). However, this is consistent with higher mean annual rainfall (1884 mm) for the Cumbrian site as well as the proximity of the Tamar study basin to the east coast of the Atlantic (i.e. air mass with reduced geogenic222Rn activity). The range in210Pbexatmospheric flux in the present study lies between the mean of 117 Bq m-2y-1estimated for the 30–60° N latitude zone based on a compilation of data (Preiss et al., 1996) and 161 Bq m-2 y-1 from soil inventories in Devon (Walling and He, 1999). These comparisons suggest that estimates ofFafor210Pbexwere reasonable.
Conclusions
[image:13.595.45.549.78.297.2]This is the first study to combine a sediment residence time model with multi-decadal estimates of mean annual discharge and suspended sediment export from river basins. In contrast, previous applications have been based on short-term monitor-ing (1–2 years) that is highly dependent on the specific hydroclimatic conditions during measurement periods. This may have an important effect on estimated residence times due to model sensitivity to suspended sediment exports. The novel combination of a river basin sediment budget model with a mass balance model of particle residence times that uses fall-out radionuclide tracers identified changes in spatial patterns and timescales of suspended sediment transfer in response to recent agricultural land cover change. With increased pressure on soil systems to meet global food security targets, such infor-mation is highly valuable to catchment managers and policy makers who need to balance food production against protec-tion of downstream water resources and aquatic ecosystems.
Table VI. Summary of factor changes inτs,τrandSrin response to changes in residence time model parameters for the Tamar basin upstream of
Gunnislake under the 2007 land cover
Model input
Factor change in parameter values
Factor changes in model outputs
Slow compartment (τs) Rapid compartment (τr) Rapid compartment area (Sr)
Suspended sediment flux 1.5 0.7 1.1 1.5
0.5 1.7 0.8 0.5
Increase parameter Decrease Increase Increase
Radionuclide activity concentrationa + 2SE 0.9 1.0 1.1
–2SE 1.1 1.0 0.9
Increase parameter Decrease Negligible change Increase
Fa(210Pbex) 1.5 1.0 0.5 0.6
0.5 1.0 2.6 2.3
Increase parameter Negligible change Decrease Decrease
Fa(7Be) 1.5 1.0 1.6 1.0
0.5 1.0 0.4 1.0
Increase parameter Negligible change Increase Negligible change
M(137Cs) 1.5 1.5 1.1 1.1
0.5 0.5 0.7 0.8
Increase parameter Increase Increase Increase
IgnoreKd 1.2 1.3 1.0
Most sensitive parameters SSandM Fa(210Pbex) Fa(210Pbex)
The SedNet model was used to simulate mean annual suspended sediment fluxes for three land cover surveys spanning a period of recent change in agricultural land use in the study basin. Modelled basin-scale suspended sediment yields ranged between 16 and 40 t km-2y-1and were consistent with longer-term measurements from the region. Likewise, hillslope and channel bank erosion rates were comparable to available data suggesting that the SedNet model provided a reasonable representation of suspended sediment transfer. Comparison of modelled sediment budgets between land cover surveys showed a pronounced increase in suspended sediment yields in response to an increase in the area of arable land from 6.3 to 36% between 1990 and 2007.
Modelled particle residence times were estimated for seven sub-basins that were divided into slow (upper surface soil) and rapid (river and connected hillslope source areas) transport compartments. Modelled slow compartment residence times for the river basins were 13–48, 7.7–17 and 5.6–14 ky for the 1990, 2000 and 2007 land cover surveys, respectively. The residence times decreased in response to the increase in modelled suspended sediment exports with increasing arable land area. It was also shown that slow compartment residence times were related to a basin-scale index of sediment transport capacity by a negative power function for each land cover. Both the residence times and estimated source areas of the rapid transport compartment increased with consecutive land cover surveys. Conceptually, this was considered to reflect the expansion of connected hillslope source areas with increas-ing sediment supply from more arable land situated near the channel network. Larger source areas correspond to longer sediment travel distances and hence increased residence times. The coupled sediment budget-residence time modelling approach provides unique insight into river basin responses to recent environmental change not otherwise available from conventional measurement techniques. Quantifying residence times of fine sediment and associated contaminants in degraded river basins may yield valuable information on potential recovery rates from pollution under current environ-mental conditions. Future environenviron-mental changes could also be modelled. For example, the use of a sediment budget model with hydrologic parameters such as SedNet would allow examination of the potential impact on sediment residence times of projected changes in precipitation and evaporation associated with future climate scenarios.
Acknowledgements—HGS acknowledges the support of a Marie Curie
Fellowship (PIIF-GA-2010-273069) within the 7th European Commu-nity Framework Programme. This paper also represents a contribution to the International Atomic Energy Agency Coordinated Research Programme D1.20.11 under Research Agreement IAEA contract UK/ 15538 (WB). We thank staff from the Westcountry Rivers Trust for help with site selection and arranging access for river monitoring. We also acknowledge the contribution of Professor Geoff Millward to gamma spectrometry analysis and for lively discussion. We thank two anony-mous reviewers whose comments helped improve the manuscript.
References
Abernethy B, Rutherfurd ID. 2001. The distribution and strength of ri-parian tree roots in relation to riverbank reinforcement.Hydrological
Processes15: 63–79.
Appleby PG, Haworth EY, Michel H, Short DB, Laptev G, Piliposian GT. 2003. The transport and mass balance of fallout radionuclides in Blelham Tarn, Cumbria (UK).Journal of Paleolimnology29: 459–473. Bilotta GS, Krueger T, Brazier RE, Butler P, Freer J, Hawkins JMB, Haygarth PM, Macleod CJA, Quinton JN. 2010. Assessing catchment-scale erosion and yields of suspended solids from
improved temperate grassland.Journal of Environmental Monitoring
12: 731–739.
Bonniwell EC, Matisoff G, Whioting PJ. 1999. Determining the times and distances of particle transit in a mountain stream using fallout ra-dionuclides.Geomorphology27: 75–92.
Brune GM. 1953. Trap efficiency of reservoirs. Transactions of the
American Geophysical Union34: 407–418
Cawse PA. 1983. The accumulation of137Cs and239+240Pu in soils of Great Britain, and transfer to vegetation. In Ecological Aspects of Ra-dionuclide Release, Coughtrey PJ (eds). Blackwell: Oxford; 47–62. Cerdan O, Govers G, Le Bissonnais Y, Van Oost K, Poesen J, Saby N,
Gobin A, Vacca A, Quinton J, Auerswald K, Klik A, Kwaad FJPM, Raclot D, Ionita I, Rejman J, Rousseva S, Muxart T, Roxo MJ, Dostal T. 2010. Rates and spatial variations of soil erosion in Europe: a study based on erosion plot data.Geomorphology122: 167–177. Coulthard TJ, Macklin MG. 2003. Modeling long-term contamination
in river systems from historical metal mining.Geology31: 451–454. Cremers A, Elson A, De Preter P, Maes A. 1988. Quantitative analysis of
radiocaesium retention in soils.Nature335: 247–249.
Davidson SK, Hey RD. 2011. Regime equations for natural meandering cobble- and gravel-bed rivers.Journal of Hydraulic Engineering137: 894–910.
Department of Environment, Food and Rural Affairs (DEFRA). 2010. Structure of the agricultural industry in England and the UK at June. https://www.gov.uk/government/statistical-data-sets/structure-of-the-agricultural-industry-in-england-and-the-uk-at-june
Desmet PJJ, Govers G. 1996. A GIS procedure for automatically calcu-lating the USLE LS factor of topographically complex landscape units.Journal of Soil and Water Conservation51: 427–433. Dietrich WE, Dunne T. 1978. Sediment budget for a small catchment in
mountainous terrain.Zeitschrift für Geomorphologie29: 191–206. Dominik J, Burrus D, Vernet J-P. 1987. Transport of environmental
ra-dionuclides in an alpine watershed.Earth and Planetary Science Let-ters84: 165–180.
Dosseto D, Hesse PP, Maher K, Fryirs K, Turner S. 2010. Climatic and vegetation control on sediment dynamics during the last glacial
cy-cle.Geology38: 395–398.
Evrard O, Némery J, Gratiot N, Duvert C, Ayrault S, Lefèvre I, Poulenard J, Prat C, Bonté P, Esteves M. 2010. Sediment dynamics during the rainy season in tropical highland catchments of central Mexico using fallout radionuclides.Geomorphology124: 42–54.
Fifield LK, Wasson RJ, Pillans B, Stone JOH. 2010. The longevity of hill-slope soil in SE and NW Australia.Catena81: 32–42.
Fryirs K. 2013. (Dis)Connectivity in catchment sediment cascades: a fresh look at the sediment delivery problem.Earth Surface Processes
and Landforms38: 30–46.
Fu G, Chen S, McCool DK. 2006. Modeling the impacts of no-till prac-tice on soil erosion and sediment yield with RUSLE, SEDD and ArcView GIS.Soil and Tillage Research85: 38–49.
Fullen MA. 1998. Effects of grass ley set-aside on runoff, erosion and or-ganic matter levels in sandy soils in east Shopshire, UK.Soil and
Till-age Research46: 41–49.
Fuller RM, Smith GM, Devereux BJ. 2003. The characterisation and measurement of land cover change through remote sensing: prob-lems in operational applications? International Journal of Applied
Earth Observation and Geoinformation4: 243–253.
Gallant JC, Dowling TI. 2003. A multiresolution index of valley bottom flatness for mapping depositional areas.Water Resources Research
39: 1347.
Gartner JD, Renshaw CE, Dade WB, Magilligan FJ. 2012. Time and depth scales of fine sediment delivery into gravel stream beds: con-straints from fallout radionuclides on fine sediment residence time and delivery.Geomorphology151–152: 39–49.
Granet M, Chabaux F, Stille P, Dosseto A, France-Lanord C, Blaes E. 2010. U-series disequilibria in suspended river sediments and implication for sediment transfer time in alluvial plains: the case of the Himalayam
riv-ers.Geochemica et Cosmochimica Acta74: 2851–2865.
Hancock GJ, Wilkinson SN, Hawdon AA, Keen RJ. 2013. Use of fallout tracers7Be,210Pb and137Cs to distinguish the form of sub-surface soil erosion delivering sediment to rivers in large catchments.
Hydro-logical Processes. DOI: 10.1002/hyp.9926