INTRODUCTION
R. B. Thompson
Ames Laboratory, USDOE Iowa State University Ames, IA 50011
The inverse Born approximation algorithm (IBA) for flaw s1z1ng was proposed theoretically by Rose and Krumhansl in 1977 (1,2). Since that time, it has been experimentally evaluated at a number of labora-tories, both in the U.S. and abroad. This paper summarizes the results of those evaluations and describes the status of efforts to develop a fully automatic version of the algorithm.
THEORY
The IBA was derived as a part of efforts to solve the inverse scattering problem, whereby the geometry of a flaw is deduced from experimental observations of its far field ultrasonic scattering. The initial derivation was made in the frequency domain, and was based on the assumption of a weakly scattering flaw (hence the name inverse Born approximation). The IBA is an integraJ algorithm which reduces to a single integral over frequency for a spherical flaw. It is this one-dimensional (I-D) form of the lBA which will be considered in this paper. At the time of initial reporting of the algorithm, it was tested on noisy synthetic data from a spherical cavity. Despite the violation of the weak scattering assumption, excellent estimates of radius were obtained (1,2). This early indication of robustness, coupled with the technologically important problem of sizing small inclusions in such components as aircraft engine parts, led to the active investigation of the properties of the IBA.
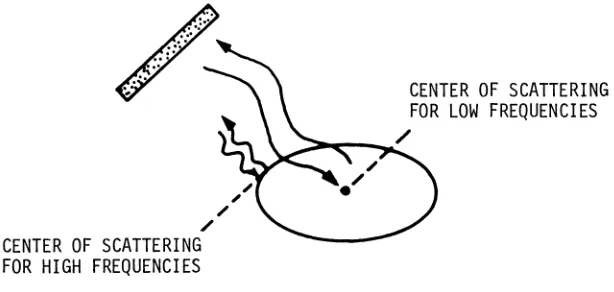
Subsequent analysis, particularly in the time domain (3,4), led to a better understanding of the nature of the IBA and its successes on strongly scattering flaws. The essence of this understanding is illustrated in Fig. 1. When a flaw is illuminated by a broad band pulse, the high frequency components will be reflected from its front surface. However, at low frequencies, the flaw will scatter as if it were a point defect located at its centroid. Consequently, a measure-ment of the relative positions of high and low frequency scattering gives a measure of the flaw radius. The importance of the relative roles of high and low frequency scattering for flaw sizing were
612 R. B. THOMPSON
"
/CENTER OF SCATTERING
FOR HIGH FREQUENCIES
~
,
CENTER OF SCATTERING
FOR LOW FREQUENCIES
~oor-_.!./
Fig. 1. Principles of Inverse Born sizing.
independently noted by Tittmann and E1s1ey (5) at the same conference in which the IBA was first reported.
An equivalent formal interpretation can be made in terms of the flaw impulse response, R(t). Consider a time coordinate system with an arbitrary origin. The theory of elastic wave scattering from finite flaws requires that the zeroth and first moments of the impulse response vanish. The second moment is finite, being proportional to the strength of Rayleigh scattering. The third moment need not vanish in general. However, for one particular choice of the time origin, corresponding
to the arrival time of a signal from a fictitious reflector at the flaw centroid (assuming inversion symmetry), the third moment must also vanish. If one has selected a trial guess of the time of this signal as the origin, the proper centroid position in the trial time system can be computed from the relationship
t c
3
r:""
t R(O3J~""t2R(t}
0)
where R(t) is the impulse response. Let the t' time system be shifted to have its origin and t=t c ' Then for a spherical flaw the characteristic function y, defined to be unity inside of the flaw and zero outside, is determined from the relationship
V
a:
-2r
J
2r/V
R(t')dt'
-2r/V (2)
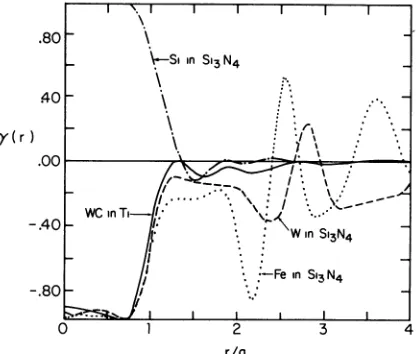
where V is the wave velocity. Figures 2 and 3 illustrate the robustness of this procedure by showing the impulse responses and reconstructed characteristic functions as computed from synthetic data for a number of inclusion-host combinations. Even when the impulse response deviates significantly from that of the Born scatterer, the characteristic
[image:2.482.86.393.56.202.2]/1\
!\
BORNIv--r-
~ VOID in Ti;;
-V
fF\r-
Si in SI,N,IL'
~/\
VV
if
Fe in Si,N.Fig. 2. Theoretical impulse responses of spherical inclusions.
.80
140
y( r)
-.40
\
\
\-5, ,n 5'3 N4
\
\
\
\.
2
ria
. i-Fe ,n 5'3 N4
:
..
3
,""
4
Fig. 3. Performance of IBA on synthetic data for spherical inclusions.
A simple extension of the one-dimensional IBA can be used to
size ellipsoidal inclusions. Recall that spherical symmetry was assumed in the derivation of the 1-D IBA. It was subsequently shown that, for an ellipsoidal flaw, the identical processing would yield a distance known as the front surface tangent plane distance (6). As illustrated in Fig. 1, this is the distance from the center of the flaw to that wavefront (defined as a plane perpendicular to the direction of observa-tion) which first strikes the flaw. For illumination along one of the ellipsoid axes, this distance is equal to a semi-axis. Otherwise, it is greater than the radius in the direction of observation.
[image:3.482.64.415.58.167.2] [image:3.482.138.347.242.419.2]614 R. B. THOMPSON
flaw from that of the measurement system and part geometry. This is accomplished by deconvolution techniques. The output is a band-limited scattering amplitude (frequency domain) or impulse response (time domain). The centroid time, t c ' characteristic function of the flaw, y(r), and flaw radius may then be determined as discussed above.
The bandlimiting caused by physical limitations on the transducer response causes a loss of low frequency information which introduces errors in the determination of the centroid by Eq. (1) or frequency domain equivalents. To overcome this information loss, one attempts to estimate the low frequency response by extrapolation techniques. It is this extrapolation which causes the greatest difficulty in the implementation of the IBA. Different procedures for making this extra-polation have been adopted by different experimental groups.
RESEARCH EVALUATIONS
A number of experimental groups have reported evaluations of the IBA or closely related techniques. Included are scientists at the Rockwell International Science Center, the Ames Laboratory, the University of Paris, Ohio State University, the Materials Laboratory of AFWAL, Southwest Research Institute, the University of London, and the PERME facility of the Gas Turbine Ministry in the U.K. Those results are summarized below.
Elsley and Addison made numerous early experimental and simulated inversions (7). Among their conclusions were the observations that a) the algorithm was very robust in the presence of random noise, and b) the algorithm required a bandwidth of O.S<ka<Z.S, where a is the flaw radius and k is the wave vector. Condition b) is at the edge of the capability of commercially available probes, as it requires a factor of 5 bandwidth. Since one does not know the flaw radius in advance, this requirement also implies the need for a protocol to ensure that a transducer has adequate sensitivity in a particular measurement band determined by the radius of the flaw under examination.
Thompson and Gray further evaluated the IBA, including possible causes of degradation (8). A number of successful inversions were reported. Irregular flaw surfaces, causing difficulty in detecting the high frequency front surface reflection, was identified as a possible problem.
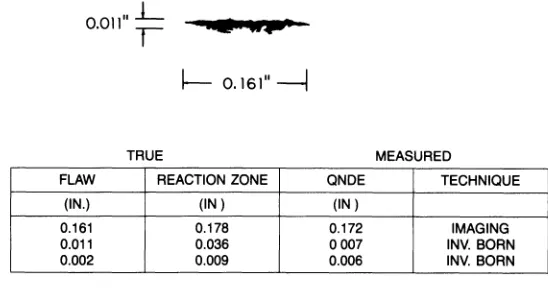
A major success was reported by Addison et a1. in 1981 (9). Blind sizing of an inclusion seeded in aNi-based superalloy engine material by Rolls Royce, was attempted. Using a combination of focussed beam imaging for the major dimensions, and IBA sizing for the minor dimension, the size, tilt, and high acoustic impedance of an elongated inclusion were determined. Figure 4 summarizes these results. In a second sample, good data could not be obtained because the part geometry precluded experimental observations from the appropriate angles.
0.011"
*=
...
I---
0.161"--lTRUE MEASURED
FLAW REACTION ZONE QNDE TECHNIQUE
(IN.) (IN) (IN)
0.161 0.178 0.172 IMAGING
0.011 0.036 0007 INV. BORN
0.002 0.009 0.006 INV. BORN
• TILT & HIGH ACOUSTIC IMPEDANCE ALSO PREDICTED
Fig. 4. Use of IBA to size Ca-A1-Ti inclusion in Ni-based supera11oy.
Hsu et a1. (12,13) made a detailed study of the ability to recon-struct the size and shape of ellipsoidal cavities and inclusions using limited aperture data. They were able to obtain excellent results for both volumetric, as shown in Fig. 5, and near-surface flaws. These reconstructions involved the experimental determination of the front-surface tangent plane distance using the IBA, followed by a geometrical transformation to fit those distances to an assumed ellip-soidal flaw shape.
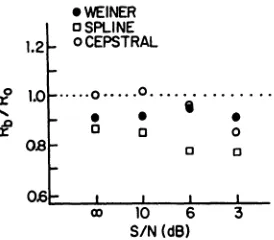
Stimulated by these successful demonstrations of feasibility, several programs were initiated to more completely test the algorithm. Bhagat et a1. studied the effects of different deconvolution procedures on size estimates (14). Particular attention was placed on the effects of deconvolution errors. Three deconvolution procedures, weiner, spline, and cepstra1, were evaluated by applying them to noisy, synthe-tic data. Figure 6 summarizes the results of that analysis, which revealed that cepstra1 processing had the best fidelity at high signa1-to-noise ratios, but the most ambi~uity at low signa1-to-noise ratios.
In that limit, wiener filtering had the best performance. In the experimental portion of their work, difficulties encountered on certain samples were attributed to clutter. It was concluded that artifacts due to clutter were the greatest impediment to implementation. The use of multiple beams was suggested as a possible solution.
[image:5.482.102.376.65.210.2]616
REFERENCE
SIGNAl
R. B. THOMPSON
z·
STEEL INCLUSION IN PLASTIC
MEASURED o 60
TRUE
-,{-+-++-+-+-+--+-+-+--+--+-+-+-f+--It--y'
ELLIPSOIDAL CAVITY IN TITANIUM
z·
MEASURED
-t-t-+--+-+--i-+-~--+-~~-+--y'
5OO"m
Fig. 5. Use of IBA from multiple angles to determine size and shape of ellipsoidal inclusion .
• WEINER o SPLINE 1.2 0 CEPSTRAL
r!.
1.0···0···· .0 .... " ... .
• •
•
r£
0 0 00.8 c o
os.~
__
~~~__
~__
~_CD 10 6 3
SIN (dB)
Fig. 6. Effects of different deconvolution techniques on size estimates as determined from synthetic data.
[image:6.482.58.385.61.256.2] [image:6.482.158.295.325.445.2]E
~
a: 1000
...
.-
...1
::E
~
a
00 1
...
ti
::E i=
fa
500 1000
TRUE DIAMETER (ILm)
a
Fig. 7. Result of blind test assuming correct transducer is selected by independent means.
An effort has also been initiated recently in the U.K. to develop a Born sizing capability. Green reports that, after preliminary tests, the Born is preferred over other techniques for sizing cavities and inclusions, with accuracies of 5 to 10% for simple shapes (16). The primary problems encountered are again those of the inadequate bandwidth of commercial probes and selection of the optimum procedure for estima-ting the flaw centroid from the low frequency scattering data. Special transducers have been developed to reduce the former problems (17) and a formal protocol for centroid determination is under evaluation. AUTOMATION EFFORTS
Two serious efforts have been made to automate the IBA. Marsh et al. have used statistical estimation techniques to estimate the flaw size (18). An attractive feature of their algorithm is the fact that one of the outputs is an evaluation of the correctness of the transducer selected. Table I presents the results on a series of simple flaws evaluated with three different transducers. In each case, the output is either a command to select a higher or lower fre-quency probe or an acceptable size estimate. However, the error esti-mates, which are provided by the technique, are less than the true errors. More recent tasks on a large set of waveforms have revealed cases where more serious breakdowns occur (19), which may also be attributed to limited transducer bandwidth.
[image:7.482.147.322.53.215.2]618 R. B. THOMPSON
Table I. Performance of automated IBA based on statistical estimation techniques.
Actual Flaw Radius
(~m)
200 200 200 400 400 400 600 600 600
Center Frequency of Transducer (*indicates ka~l)
Maximum Likelihood
Radius(~m)
Optimum Transducer
2.5 3l7±l8 Higher
5 283± 9 Higher
10* 243± 9 OK
2.25 567± 7 Higher
5* 444± 4 OK
10 Positive A4 Lower
2.25* 692± 5 OK
5 Positive A4 Lower
10 No Sig- Lower
nificant Minimum
'~
' I ~I.
I - .
I )
~~'
J .
.
~!! -
I
... .
:1·
III
t,.< ,
- I
I!I
II
-- l ..
P
-=
l'~
.
:ro
Manually Obtained Values, for Comparison
219
263
473
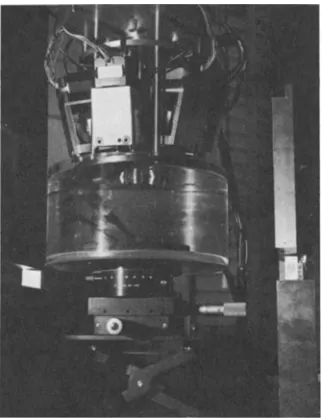
Fig . 8. Multielement transducer head for automatic implementation of IBA.
[image:8.482.57.425.72.346.2] [image:8.482.163.324.310.519.2]transducer frequency must have been selected manually before the automatic processing begins. However, the transducer bandwidths are sufficient that the same probes can be used at all seven positions, even though apparent flaw radii change. Figure 9 is an example of the reconstruction of a 2:1 oblate spheroidal void in titanium using the automated system.
}---,y'
x'L---'
Fig. 9. Reconstruction of a 2:1 ellipsoidal inclusion using automated, multielement system.
CONCLUSIONS AND FUTURE DIRECTIONS
The successful implementation of the IBA at a large number of laboratories indicates the potential utility of the approach, particu-larly in determining the size and shape of small flaws whose dimensions are on the order of a wavelength. This high performance is obtained through the use of low frequency scattering data to define the centroid position. Such measurements are not routine and have been attempted in different ways with varying success at various laboratories. Two experimental problems in making this centroid determination have not been fully resolved. These are the unknown influences of clutter and loss of low frequency information due to inadequate transducer bandwidth.
No systematic studies of the influences of clutter on the stability of the inversion have been made. It is an unfortunate situation that much of the data has been obtained on diffusion bonded samples which tend to have artifactual signals near the flaw signal due to the fabri-cation process. This may be a spurious problem not representative of naturally occurring flaws. Future research should consider this problem of the influence of clutter in greater detail.
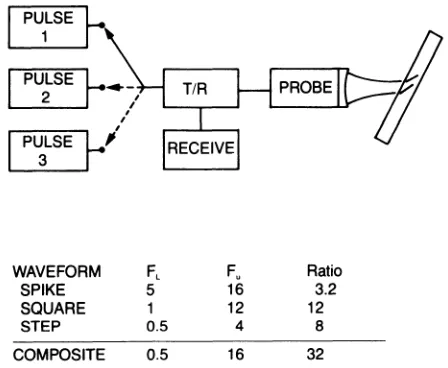
620 R. B. THOMPSON Figure 10 sketches a way in which this might be accomplished with modest modifications of available instrumentation. If one changes
the shape of the electrical excitation from half-sine to square to
step voltage, the low frequency components of a pulse will be progressively enhanced at the expense of the high frequency components. The table
at the bottom of the figure gives the upper and lower 3dB points for each of the waveforms applied to an ideally damped, 10 MHz transducer with a high input impedance receiver. In principle, one could construct a pulser whose complex voltage output would excite all of these components. However, a more readily implementable approach might use three separate pulser circuits, which individually produce the three aforementioned pulses. By sequentially exciting the transducer with each, and summing the received signals in a digital memory, one could synthesize the broad band response. Other approaches to increasing the bandwidth of measurement should also be vigorously pursued.
PULSE
2
PULSE
3
WAVEFORM SPIKE SQUARE STEP COMPOSITE
FL
5
1 0.5
0.5
F" Ratio
16 3.2
12 12
4 8
16 32
Fig. 10. Use of multiple pulse shape to broaden effective measurement bandwidth for a single probe.
ACKNOWLEDGEMENT
This work was sponsored by the Center for Advanced Nondestructive Evaluation, operated by the Ames Laboratory, USDOE, for the Air Force Wright Aeronautical Laboratories/Materials Laboratory under Contract No. W-7405-ENG-82 with Iowa State University.
REFERENCES
1. J. H. Rose and J. A. Krumhans1, ARPA/AFML Review of Progress in Quantitative NDE, Ithaca, NY, June 14-17, 1977.
2. J. H. Rose and J. A. Krumhans1, J. App1. Phys. 50, 2951 (1979). 3. J. H. Rose and J. M. Richardson, J. Nondestr. Eva1.
1,
45 (1982). 4. J. H. Rose and J. L. Opsal, Review of Progress in Quantitative [image:10.482.136.360.232.416.2]5. B. R. Tittmann and R. K. E1s1ey, Proceedings of the ARPA/AFML Review of Progress in Quantitative NDE, Technical Report AFML-TR-78-55 (Air Force Materials Laboratory, Wright Patterson Air Force Base, Dayton, OH, 1978), p. 26.
6. J. H. Rose, V. V. Varadan, V. K. Varadan, R. K. E1s1ey, in Acoustic, Electromagnetic, and Elastic Wave Scattering-Focus on the
T Matrix Approach, (Pergamon Press, NY, 1980), p. 571.
7. R. K. E1s1ey and R. C. Addison, Jr., Proceedings of the DARPA/AF Review of Progress in Quantitative NDE, Technical Report AFWAL-TR-81-4080 (Air Force Wright Aeronautical Laboratories, Dayton, OH, 1981), p. 389.
8. R. B. Thompson and T. A. Gray, Review of Progress in Quantitative NDE 1, D. O. Thompson and D. E. Chimenti, Eds. (Plenum Press, NY, 1982), p. 233.
9. R. C. Addison, R. K. E1s1ey and J. F. Martin, ibid, p. 251.
10. K. Lewis, D. Fitting, and L. Adler, Review of Progress in Quantitative NDE 2, D. O. Thompson and D. E. Chimenti, Eds. (Plenum Press, NY, 1983), p. 1127.
11. F. Cohen-Tenoudji, G. Quentin, and B. R. Tittmann, ibid, p. 961. 12. D. K. Hsu, T. A. Gray, and R. B. Thompson, ibid, p. 795.
13. D. K. Hsu, J. H. Rose, and D. O. Thompson, ibid, p. 995. 14. P. K. Bhagat, D. E. Chimenti, T. J. Moran, and K. D. Shimin,
Review of Progress in Quantitative NDE 3, D. O. Thompson and D. E. Chimenti, Eds. (Plenum Press, NY, 1984), p. 395. 15. G. J. Gruber, G. J. Hendrix, and T. A. Mueller, ibid, p. 309. 16. Dave Green, PERME, Westcott, U.K., private communication. 17. G. C. Low and R. V. Jones, Ultrasonics 22, 85 (1984).
18. K. A. Marsh, J. M. Richardson, R. C. Addison, and R. K. E1s1ey, Review of Progress in Quantitative NDE 2, D. O. Thompson and D. E. Chimenti, Eds. (Plenum Press, NY, 1983), p. 975. 19. K. A. Marsh, unpublished results.
20. D. O. Thompson and S. J. Wormley, "Long and intermediate wavelength flaw reconstruction", these proceedings.