Multiscale modeling and flow visualization
.
White Rose Research Online URL for this paper:
http://eprints.whiterose.ac.uk/1490/
Article:
Collis, M.W., Lele, A.K., Mackley, M.R. et al. (9 more authors) (2005) Constriction flows of
monodisperse linear entangled polymers: Multiscale modeling and flow visualization.
Journal of Rheology, 49 (2). pp. 501-522. ISSN 0148-6055
https://doi.org/10.1122/1.1849180
[email protected] http s ://eprints.whiterose.ac.uk/
Reuse See Attached
Takedown
If you consider content in White Rose Research Online to be in breach of UK law, please notify us by
polymers: Multiscale modeling and flow visualization
M. W. Collis, A. K. Lele, and M. R. Mackley
Department of Chemical Engineering, University of Cambridge, Pembroke Street, Cambridge CB2 3RA, United Kingdom
R. S. Graham, D. J. Groves, A. E. Likhtman, and T. M. Nicholsona) IRC in Polymer Science and Technology, Department of Physics and Astronomy,
University of Leeds, Leeds LS2 9JT, United Kingdom
O. G. Harlen
IRC in Polymer Science and Technology, Department of Applied Mathematics, University of Leeds, Leeds LS2 9JT, United Kingdom
T. C. B. McLeishb)
IRC in Polymer Science and Technology, Department of Physics and Astronomy, University of Leeds, Leeds LS2 9JT, United Kingdom
L. R. Hutchings
Department of Chemistry, University of Durham, Durham DH1 3LE, United Kingdom
C. M. Fernyhough and R. N. Young
Department of Chemistry, University of Sheffield, Sheffield S3 7HF, United Kingdom
(Received 29 July 2004; final revision received 1 November 2004d
Synopsis
We explore both the rheology and complex flow behavior of monodisperse polymer melts. Adequate quantities of monodisperse polymer were synthesized in order that both the materials rheology and microprocessing behavior could be established. In parallel, we employ a molecular theory for the polymer rheology that is suitable for comparison with experimental rheometric data and numerical simulation for microprocessing flows. The model is capable of matching both shear
adAlso at: Division of Chemical Engineering, University of Queensland, Queensland 4072, Australia.
bdAuthor to whom all corresponds should be addressed; electronic mail: [email protected]
© 2005 by The Society of Rheology, Inc.
and extensional data with minimal parameter fitting. Experimental data for the processing behavior of monodisperse polymers are presented for the first time as flow birefringence and pressure difference data obtained using a Multipass Rheometer with an 11:1 constriction entry and exit flow. Matching of experimental processing data was obtained using the constitutive equation with the Lagrangian numerical solver,FLOWSOLVE. The results show the direct coupling between molecular constitutive response and macroscopic processing behavior, and differentiate flow effects that arise separately from orientation and stretch. © 2005 The Society of
Rheology.fDOI: 10.1122/1.1849180g
I. INTRODUCTION
A central goal of the polymer rheological community for a number of years has been the connection of polymer melt dynamics at different length scales. The interplay of entropic elasticity and entanglement constraints at the molecular levelfDoi and Edwards s1986d; McLeish s2002dgled to the subtle and emergent non-Newtonian fluid properties at length scales that average over many molecular interactions. Furthermore, these local fluid properties determine, in principle, the stress and velocity fields in a polymer melt constrained by the complex geometries of processlike flows. Until now, however, there have been few attempts to link molecularly based model calculations across these length scales in the context of experimental data.
Classically, polymer melts have been rheologically characterized, then modeled by parameter fitting one of a family of phenomenological differential or integral constitutive equationsfRajagopalan et al.s1993d; Baaijens et al.s1997dg. This approach suffers from the drawback that models created without reference to molecular physics may fail to represent even qualitative features of the material behavior. This is especially true of long chain branched melts fMcLeish and Larson s1999dg. In this case, the recognition that branch points enormously increase the stretch relaxation times of polymer chains within their “tubes” produced a new constitutive equation. This approach has been very success-ful in accounting for the rheology of both model H-shaped monodisperse materials fMcLeish and Larsons1999dg and polydisperse melts of low density polyethylenef Ver-beeten et al.s2001dg. It successfully predicted a qualitatively new feature in the outflow of highly branched melts when coupled to a flow solverfLee et al.s2001dg.
Other “micro-macro” approaches have attempted to couple stochastic simulations of the coarse-grained molecular dynamics within the finite elements of a flow simulation fLaso and Öttingers1993d; Peters et al.s2000dg. This is, of course, the ideal multilevel approach, but with current levels of computing power, it is not possible to achieve sufficient noise reduction by local ensemble averaging while also addressing the demands of a complex flow field calculation.
Both the molecular constitutive equation and molecular simulation approaches to the problem of multiscale modeling of polymer melts have been constrained by a further problem. The most natural subjects of the model in either case are monodisperse chains that do not require the addressing of complications that arise from the mutual interactions of high and low molecular weight fractions in the distribution. However, although it is possible to synthesize such materials by anionic methods in sufficient quantities for rheological measurements in viscometric flows, the large amounts usually required for complex flow studies have not before been accessible. This is true even for monodisperse linear melts, let alone the more exacting architectures of star, H, and comb molecules fMcLeishs2002dg.
order of tens of grams, rather than grams. The latter, based on the “Multipass Rheometer” of the Cambridge group fMackley et al. s1995dg permits an effectively 4 / 1 or 11/ 1 constriction flow. The complex flow, including two sets of re-entrant corners, reversing extensional profile, and transient flow structure, may be analyzed by stress birefringence and pressure difference, but requires only material quantities of this order.
At the same time, we will seek to model the nonlinear rheology and flow properties of this melt by calling on the most recent advances in molecular modeling of entangled polymers. The first versions of the “tube model” dealt restrictively with the two processes of reptation, which diffuses molecules within their entanglement field of tubelike con-straints, and retraction, which maintains a constant topological path length for the chains fDoi and Edwardss1986dg. Since then, additional molecular processes have been identi-fied that are essential to a quantitative account of the dynamics of linear entangled chains as probed by both rheology fLikhtman and McLeish s2002adg and neutron scattering fWischnewski et al.s2002dg. Contour length fluctuationsCLFdpermits the extremities of chains to relax faster than the reptation time, while constraint release sCRd links the relaxation of the tube constraint itself to the reptation and CLF of neighboring chains fLikhtman and McLeishs2002dg. In nonlinear deformations, convective CRsCCRdadds to the rate of reconfiguration of the tubes, while stretch suppresses tube reconfiguration and enhances values of stress above the plateau modulusfMead et al. s1998d; Ianniru-berto and Marruccis2001dg. This removes the unphysical maximum in shear stress with shear rate that followed from the original approximations of the tube model. Additionally, it permits the prediction of scattering patterns in quantitative agreement with data on strongly sheared entangled meltfMilner et al.s2001d; Bent et al.s2003d; Graham et al. s2003dg. The level of sophistication, at which all of these molecular processes are pres-ently dealt with in the most detailed accounts of viscometric flows, leads to a level of formalism that would be prohibitive in computations of complex flows. Fortunately, approximations to the full constitutive behavior of models that account for reptation, CLF, CCR, and chain stretch, can be cast in simple, if unfamiliar, formsfLikhtman and Grahams2003dg. This will be the basis of our numerical calculations.
In the next section, we detail the experimental procedures in synthesis and character-ization of our materials, the laboratory rheological testing, and the complex flow rheol-ogy. In Sec. III, we briefly review the theoretical derivation of the molecular constitutive equations employed to analyze both laboratory viscometric and complex flows. In Sec. IV, we present the experimental phenomena exhibited by monodisperse melts in a con-striction flow for the first time, and compare with the model calculations.
II. EXPERIMENTAL METHOD
A. Synthesis and characterization 1. Polymerization of butadiene
The solvents, initiator, and butadiene were purified using standard techniques for anionic polymerizationfMorton and Fetterss1975dg.
2. Polymerization of styrene
The synthesis of PS was carried out on a scale of up to 200 g and, as such, involved some modifications to the usual methodology. Polymerizations were carried out in ben-zene, and purified by passing the solvent sequentially through a column of activated alumina to remove polar impurities and a column of supported copper catalyst to remove traces of oxygenfPangborn et al.s1996dg. Styrene was dried over calcium hydride and degassed by several freeze-thaw cycles. The polymerizations were carried out in a 5,
glass reactor, which was evacuated prior to use. After transferring up to 2,of solvent and
the monomer to the reactor, any residual impurities were removed by drop-wise addition of the initiator, sec-BuLi. Upon the formation of a sustained pale yellow/orange color, attributable to “living” polystyryllithium, the required quantity of initiator was added. All polymerizations were carried out at room temperature and the reactions quenched with degassed methanol. Labels and descriptions of materials used in this study are shown in Table I.
3. Characterization
Molecular weights were obtained by size exclusion chromatography using a Viscotek 200 with differential refractometer/viscometer/RALLS detectors. Threes30037.5 mmd PLgel 5µMIXED C columns were used with tetrahydrofuran as the eluent and a flow rate of 1.0 ml/min. The level of 1,4-enchainment of the butadiene was determined by 1H nuclear magnetic resonance in CDCl3at 30 °C using a Bruker AC250MHz spectrometer.
For each sample, 93%s61%d1,4-addition was found.
B. RHEOLOGICAL MEASUREMENTS 1. Sample preparation
Polymer samples were vacuum dried, compacted using a piston and cylinder as nec-essary, and then premolded to a suitable thickness and geometry using a template and platen press. Typical molding press temperatures were 90 °C for PB and 180 °C to 200 °C for PS depending on molecular weight. Molding cells with a nitrogen atmosphere or vacuum were available.
2. Shear rheology
[image:5.612.125.486.117.222.2]All measurements were made using Rheometrics ARES or RDAII rotational rheom-eters with a nitrogen atmosphere.
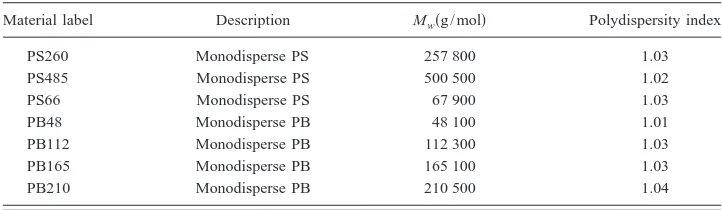
TABLE I. Labels and descriptions of materials used in this study.
Material label Description Mwsg / mold Polydispersity index
PS260 Monodisperse PS 257 800 1.03
PS485 Monodisperse PS 500 500 1.02
PS66 Monodisperse PS 67 900 1.03
PB48 Monodisperse PB 48 100 1.01
PB112 Monodisperse PB 112 300 1.03
PB165 Monodisperse PB 165 100 1.03
3. Linear rheology
Gsvd was obtained using time-temperature superposition and a measurement geom-etry of either 10 mm diameter parallel plates or a 10 mm diameter cone and plate with 2° included angle. PB data were obtained from measurements between280 °C and 60 °C and PS data between 120 °C and 210 °C.
4. Nonlinear rheology
The relaxation modulus Gstdas a function of strainsgdand the transient viscosityhstd as a function of shear ratesg˙dwere obtained with the cone and plate geometry. The 10 mm diameter and 2° angle were used to reduce large normal forces, when installing the sample and during measurement, and to minimize edge fracture instabilityfLee et al. s1992d; Tanner and Keentok s1983dg. To reduce the tendency for slip at high strains and strain rates, the cone and plate surfaces were grit blasted to produce a surface roughness of approximately 600 grit. Transient viscosity data were corrected for the start time error sstrain rate accelerationd. At higher strain rates, the transient viscosity was limited to the minimum time and strain to indicate the stress overshoot. This avoided instability allow-ing repeat measurements on the same test specimen. PB was measured at 20 °C and 50 °C and PS at 170 °C to conform with the elongational data.
5. Elogational rheology
Extensional viscosity was measured in nitrogen using a Rheometrics RME elonga-tional rheometer as described by Meissner and Hostettles1994d. Changes in the rectan-gular bar specimens, initially 60 mm long with a cross section between 3.5 mm2 and 10.5 mm2depending on the strain rate and peak force, were monitored during extension by a camera and frame grabber. Corrections were made for true strain ratefSchulze et al. s2001dg, force base line drift, and start time error. However, the strain rate was determined from change in the sample width due to the need to recover polymer and avoid contami-nation by particles or markers required for direct extension monitoring. Spacer pins were used between the gripping belts to prevent premature squeeze flow in the sample. There is a narrow temperature window for optimum measurement and the PS was measured at 170 °C.
C. FLOW VISUALIZATION
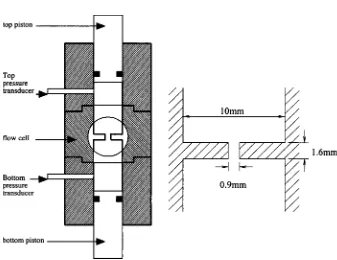
The multipass rheometer sMPRd used for the flow visualization experiments was a two-piston capillary-type rheometer developed at the University of CambridgefMackley et al.s1995dg and is shown schematically in Fig. 1sad. The latestsMk IVddesign has a reduced volume and requires less than a 10 g sample, thereby enabling microprocessing studies to be made on the synthesized monodisperse polymers. The molten polymer was forced backward and forward at controlled piston velocities through an optical flow cell and the flow-induced birefringence technique was used to observe the stress field within the melt. Additional time dependent pressure difference data could also be followed. These techniques have previously been used in combination with an MPR for molten polyethylenefsee for example, Lee and Mackleys2001d; Lee et al.s2001dg.
across the test section, and for most of the stroke the flow is in a steady state. The general layout of the MPR and test section is shown in Fig. 1. The slit flow cell used was a contraction and expansion flow through a narrow slit, with a cross section as shown in Fig. 1sbd; the depth of the cross section was 10 mm and so the channel upstream and downstream of the slit was square. Within the slit the aspect ratio was 11/ 1 where the flow can approximate to being two dimensional.
For comparison with the inherent relaxation times of the polymerssso determining the regime of non-Newtonian flowd, the wall shear rates were estimated both by inverting the Pouseuille expression for thesmeasureddvolume throughput, and by checking against the relevant numerical simulations. The use of flow birefringence is now a well-developed technique for the determination of stress distributions within flowing polymer systems fsee for example Baaijens et al.s1997dg. The system used here followed that employed by Lee et al.s2001d. Linearly polarized monochromatic light was passed through quarter-wave plates and received through an analyzer. The observed isochromate fringes then represented integer differences in principal refractive index, which in turn can be ex-pressed as contours of principal stress differences using the stress optical law. In com-parison to the cases in which large quantities of commercial material are employed, the quality of the birefringence photographs was not as high, although the geometry and number of fringes were generally clear. This was partly due to the presence of debris material from the synthesis and processing, and the inability to flush the apparatus through with quantities of melt.
III. THEORY AND MODELING
A. Tube theory in fast flow
The tube model requires just two parameters for each choice of local polymer chem-istry, reflecting the physics at the coarse-grained level of the tube diameter: The
[image:7.612.136.473.89.349.2]ment modulus Ge,sor alternatively the plateau modulus GN
(0)d and the Rouse relaxation
time of an entanglement segmentte fMcLeish s2002dg. The tube diameter a is not an additional parameter, but is related to Gevia the definition of MefLarson et al.s2003dg. At 170 °C, we find that these are 2.03105Pa and 7.1310−4s, respectively, for PS, by
fitting the molecular theory of Likhtman and McLeishs2002dto a wide data set. Treating all of the physics in the greatest detail requires solving a partial differential equation for the tensor correlation function f(s , s
8
; t) defined in terms of the arc coordinate of the polymers R(s , t), averaged over chains asfabss,s
8
;td ;K
]Rass,td]s
]R
bss
8
,td]s
8
L
. s1dBoth the viscoelastic stress and the single chain scattering function may be calculated from a knowledge of f sthe latter within a Gaussian approximationd. The full partial differential equationsPDEdfor f(s , s
8
; t) contains terms that arise from advection, repta-tion, CLF, CR, and retractionfMilner et al.s2001d; Graham et al.s2003dg:]
]tfabss,s
8
;td=kagfgb+ fagkgb+ 1
3p2Zt
e
S
Z Z*stdD
2
S
]]s+
]
]s
8
D
D*ss,s
8
;lss,s8
ddS
]]s+
]
]s
8
D
fab+3an 2
F
]
]s
1 lssd
]
]ssfab− fab eq
d+
]
]s
8
1 lss
8
d]
]s
8
sfab− fab eqd
G
+ Rs 2p2t
e
F
]
]s
S
fab]
]slnlssd
D
+]
]s
8
S
fab]
]s
8
lnlss8
dDG
. s2dIn Eq.s2d, the first term describes advection by the flow, and the second contains both reptation and CLFsfrom the effective local diffusion constant D*(s , s
8
). Here, Z is the equilibrium number of entanglement segments comprising the chain, and Z*(t) is the timedependent instantaneous value that may differ from Z because of chain stretch. The third term arises from CR, and models the tube as a free polymerlike object with a local hopping raten. In the language of polymer physics, this is equivalent to a “Rouse theory” of the tube. The dynamics of f(s , s
8
; t) arising from CR alone then take the form of a diffusion equation in the two variables s and s8
. Here, a is the “tube diameter,” related to the plateau modulus directly, l(s) is the local mean stretch of the chains, given by lssd=Î
Tr fabss , s8
dd. The CR ratenis calculated in turn self-consistently from averagesB. Nonlinear constitutive equation
Although this detailed theory is necessary to make contact with the scattering experi-ment, it is at present not feasible to use it locally in a finite-element calculation of the flow. Fortunately, calculation of the flow and stress fields requires only a simpler consti-tutive equation that is able to calculate the stress generated by a given flow history on an element of fluid. Recent work by Likhtman and Grahams2003dhas shown that the full treatment at the level of f(s , s
8
; t) may be projected onto a simpler equation for the stresssabonly, that preserves the quality of rheological prediction. Based on the “ROuse-CCR
tube model for LInear Entangled POLYmers,” the “RoliePoly” constitutive equation takes the form
]s
ab
]t =skah+khadshb−
1
td
ssab−dabd
−
2
S
1 −Î
3 TrsD
tRS
sab+b
S
Trs
3
D
d
ssab−dabd
D
. s3dHere, the four terms correspond to:s1dAdvection,s2dreptation,s3dchain retraction, and s4d CCR. Likhtman and Graham s2003d found that the parameter values b= 1 and d
= −0.5 gave the closest fit to the predictions of the full model with the preferred CR parameter of cn= 0.1. The negative value ofdis instructive: It implies that strong stretch-ing flow suppresses CCR. One physical way in which this might arise is that the longer path length of the stretched molecules simply pick up more entanglements, so that the CCR-generated drag is greater. This is, however, not obvious: An alternative picture might view the entanglement structure simply convecting with chain stretch. The corre-sponding predictions of the latter are, however, not consistent with transient shear rheol-ogy. For a full discussion, see Graham et al.s2003d. To recover the details of the linear spectrum of our materials, up to six modes carrying the nonlinear structure of Eq. s3d were used to make computable models of the series of monodisperse melts that approxi-mated closely to the rheology of both the material and the full model in the flow rates of the experiment.
C. Flow computation
The time dependent flow of polymer in the MPR was simulated using the Lagrangian– Eulerian finite-element solver developed at Leeds UniversityfBishko et al.s1999dg, using the RoliePoly constitutive model described above. In this method, the fluid velocity at each time step is calculated using a standard Eulerian finite-element technique, while the evolution of the stress is calculated in a Lagrangian frame by allowing each element to deform with the local velocity gradient. Details of the numerical method are given in Bishko et al.s1999d.
The flow domain is divided into triangular elements, with velocities and pressures held at the vertices in a continuous interpolation, and material constitutive parametersss in the RoliePoly equations, which incorporates chain orientation and stretchd piecewise constant on each element. Modes with relaxation rates much faster than the fluid velocity gradients behave as a Newtonian fluid with viscosity Gitbi, and so to reduce computa-tional time, modes for which g˙tdiø0.01 were treated as Newtonian solvent. Here g˙ = Q / d2is the typical shear rate in the constriction where Q is the area flow rate and d is
At each time step, the velocitysud and pressure spd are found from a finite-element solution of the equations of mass and momentum conservation
m¹2u − ¹p = − ¹ ·s,
s4d
¹· u = 0.
Here, m is the effective viscosity formed from the short relaxation time modes. The calculated velocities are then used to advect the grid with the flow and the corresponding triangle deformations are used to update the internal constitutive parameters for the triangles. The full RoliePoly equation was used for only the slowest mode, other modes used the nonstretching version of the equations fLikhtman and Graham s2003dg. The vertices are then reconnected as necessary to maintain a Delaunay triangulation. The reconnection process introduces a small degree of stress diffusion, but this is controlled by convergence under grid refinement. The resolution of the grid is maintained by an automated adaptive routine which divides any element whose side length is greater than a prescribed maximum length,,max swhich is a function of position, so that finer grids
may be specified in regions of high gradientsd.
At the start of the simulation, the entire domain is filled with undeformed fluid, thus the transient effects of start-up flow are simulated. Since the flow domain is symmetric, only one-half of the domain needs to be calculated. In order to reduce the size of the calculation further, a full two-dimensionals2Dd model is only employed in the region from two channel widths upstream to two channel widths downstream of the contraction. The region far upstream of the contraction is modeled as start-up flow in a uniform channel using a one-dimensionals1Ddsimulation employing the same RoliePoly consti-tutive equations. These velocities are then transferred to vertices in the flow entry region of the 2D simulation. In order to mimic the small, but non-negligible compression of the upstream reservoir, a single-exponential time dependence of growth toward the steady-state upstream velocity was introduced at the upstream boundaryssee belowd. Observa-tion of the results indicates that deviaObserva-tions from uniform channel flow do not start until well into the modeled region. Thus, any upstream effects of the piston in the experimental geometry are not modeled. At the bottom of the simulated region, vertices are removed from the simulation and velocities from the uniform 1D channel flow model are imposed on the flow exit boundary points.
Following previous workfLee et al.s2001dg, the convergence of the numerical scheme was tested by using three different levels of mesh refinement in the region near the contraction. A satisfactory degree of convergence was obtained using a mesh that con-tained approximately ten elements spanning the narrow constriction in the center of the simulation. The stress singularity at the sharp right-angled corners at the entrance to the contraction was avoided by rounding these corners with a radius of 1% of the channel widthfBishko et al.s1999dg. Each simulation took approximately 50 h to run on a 633 MHz Pentium III processor.
IV. RESULTS AND DISCUSSION
A. Viscometric flows
the plateau, modulus GN(0)d, and the Rouse relaxation time of an entanglement segmentte. For PS at 170 °C, these are 2.043105 Pa and 7.1310−4s, respectively, and for PB at
25 °C they are 1.63106 Pa and 4.8310−7s.
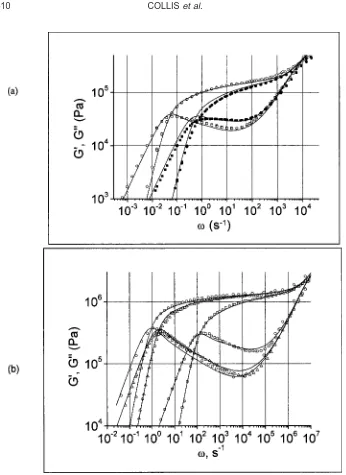
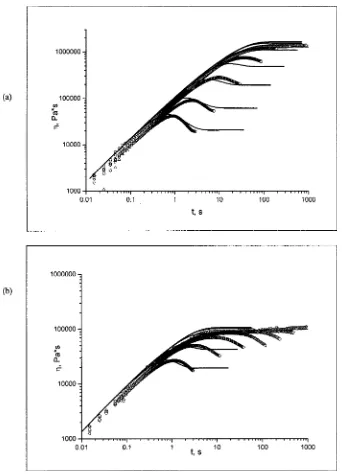
[image:11.612.131.477.72.547.2]Figure 2 shows the measured linear rheology of representative materials compared with the full tube model in linear response of Likhtman and McLeishs2002d. The termi-nal, reptation time itself, corrected for contour length fluctuations, is calculated in this formulation of the tube theory from the series:
FIG. 2. Linear rheology ofsad 250k sfilled symbolsdand 485k PS sopen symbolsdmelts and sbdPB 48
ssquaresd, 156strianglesd, and 210kscirclesdmelts with comparison to predictions from the tube theory, pa-rameterized by a chemistry- and temperature-dependent entanglement modulus Geand Rouse relaxation time of
tdsZd t0sZd
= 1 −2.38 Z1/2 +
4.17
Z − 1.55
Z3/2, s5d
where the “bare” reptation timet0(Z) = 3Z3t
e. The terminal time, shape of terminal peak, slope of G
9
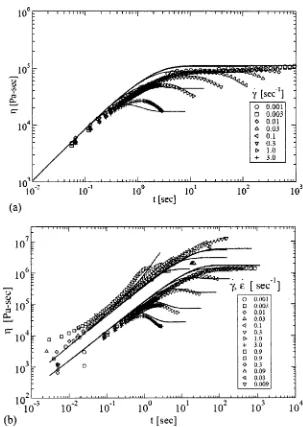
(v) at higher frequencies, and the minimum are all captured by the theory using a unique parameter set for each chemistry. [image:12.612.153.456.97.524.2]Figure 3 contains the transient nonlinear data for two representative PS samples in shear, and the higher molecular weight also in extension. Also given are the predictions for these viscometric flows from the full tube model of Eq. s2d, setting the constraint
FIG. 3. Nonlinear shear and extensionals485k PS onlydtransientssrates from 0.01–3 s−1drheology of 250ksad
release parameter cn= 0.1. We predict and observe some extensional hardening when the
flow rates exceed the Rousesstretchd relaxation time of the monodisperse linear poly-mers. The Rouse time may be predicted from molecular theory directly, from
tR= Z2t
e, s6d
and this value is used within the full tube-CCR model. The Rouse time affects both the shape of the shear transients and the onset and form of the extensional hardening. By this method, we found values of 0.16 s and 0.6 s for PS250 and PS485, respectively, at 170 °C. In particular, in these monodisperse materials with a well-defined lowest Rouse sstretchd relaxation time, the onset of extensional hardening is sudden, as a function of extension rate. This contrasts with commercial materials where the onset is typically much more gradual.
The relaxation times as well as the fixed parameters of the model for the polymers in this study are summarized in Table II. Note that we describe the melt moduli in terms of the parameter Geof Likhtman and McLeishs2002d. It is 5 / 4 of a standard values of GN
(0) . The parameters of the RoliePoly equation samplitude of five modes, reptation, and Rouse times used in the slowest nonlinear modedwere adjusted for each material so that it optimally matched the predictions of the full theory in both extension and in shear. These then became computationally efficient models of the materials to employ in the flow solver. The transient shear flows for the two PS materials matched to the predictions of the RoliePoly models are given in Fig. 4.
B. Constriction flows
The flow field contains several qualitatively different regions. Slow flow of the Pou-seuille type occurs in the broad channels up and downstream. The slot itself is dominated by a much higher wall shear rate, and is preceded by a region of positive extensional deformation upstream, and negative downstream. As we have outlined in Sec. III above, there are two important time scales inherent in each of the monodisperse materials we employ: The reptation timetd, which determines relaxation of tube segment orientation, and the faster Rouse timetR, which determines chain stretch. There are therefore three qualitatively different regimes of flow rate, as measured by the wall shear rate in the channelg˙wsthe extension rate at the constriction will be of the same order of magnituded:
s1d g˙wtd,1 linear response;
s2d g˙wtd.1 ,g˙wtR,1 orienting flow without chain stretch; and s3d g˙wtd.1 ,g˙wtR.1 orienting flow with chain stretch.
[image:13.612.126.487.116.200.2]We have been able to fully access the first two regimes experimentally, and to some extent the thirdsdeep into this regime for monodisperse melts results in onset of flow
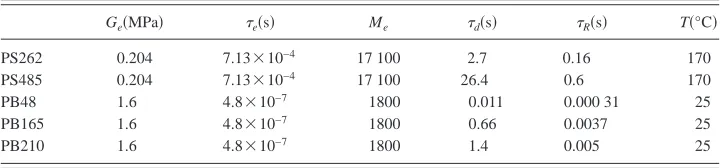
TABLE II. Physical parameters of melt material used in this study.
GesMPad tessd Me tdssd tRssd Ts°Cd
PS262 0.204 7.13310−4 17 100 2.7 0.16 170
PS485 0.204 7.13310−4 17 100 26.4 0.6 170
PB48 1.6 4.8310−7 1800 0.011 0.000 31 25
PB165 1.6 4.8310−7 1800 0.66 0.0037 25
instabilitiesd. However, all three are accessible computationally, so predictions for Re-gimes3dwill be described in the following. Both PS and PB conform to the universal rheology of the tube model, but differ in that the entanglement molecular weight of PS is much higher than in PB, resulting in less well-entangled melts. The main consequence of this for flow type is that Regimes2dis much broader for the PB samples than for the PS.
1. Steady-state flow fields
We established that the terminal relaxation times of the materials were such that steady states could be achieved at the flow rates employed within a single pass of the MPR pistons. The numerical simulations were also run until a steady state was obtained.
2. PS262 melt
The near symmetry of the observed flow is correctly predicted by the simulations up to the maximum piston speed of 0.5 mm/sswall shear rate of 29 s−1d. At this rate, the first
asymmetries in the flow, arising from nonlinearities in the material response, can be detected at the outflow. The wall shear rate, made dimensionless by the reptation time is about 80 at this flow rate, but only order 4 with respect to the Rouse time. Stress concentrations arise at the re-entrant corners, and the stress contours away from the die are slightly more linear than in the inflow region.
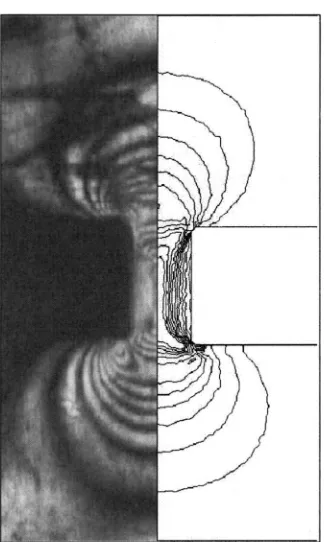
Figure 5 shows a comparison between the experimentally observed birefringence and the simulated contours of principal stress difference sDsd. These are related via the stress-optical law:
CDs=ky d
wherevis the wavelength of the light used s514 nmd, d is the depth of the samples10 mmd, and k is the fringe number. A value for the stress-optic coefficient, C, of 5.6 310−9Pa−1 was used for both the PS materials, in agreement with literature values
[image:15.612.226.388.97.368.2]fJaneschitz-Kriegls1983dg. The immediate finding of both theory and experiment is that,
although deep into the first nonlinear flow regime, the stress field is highly symmetric, with asymmetry only detected near the corners. Agreement of the predicted and experi-mental fringe pattern is good.
3. PS485 melt
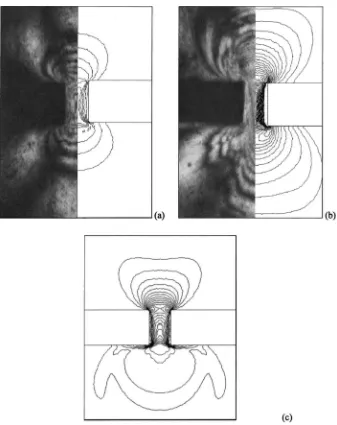
At lower rates, this higher molecular weight melt, approaching 30 entanglements per chain, exhibits symmetric flows like the less entangled materials. But above piston speeds ofs0.05 mm/s, wall shear rate=29 s−1d significant asymmetries appeared, leading
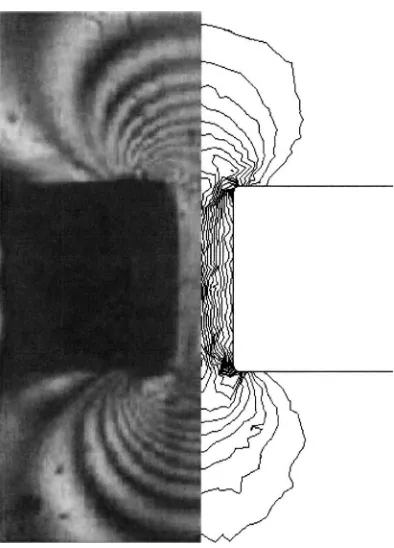
[image:16.612.138.475.98.523.2]even-tually to unstable flow above 0.2 mm/s. Results of both experiment and simulation are
FIG. 6. Experiment and calculation of stress fields for the PS485 monodisperse melt. Piston speeds aresad0.05 mm/s,sbd0.2 mm/s,scd5 mm/s, giving wall shear rates ofsad2.9 s−1,sbd12 s−1, andscd290 s−1. Flowssadis
given in Fig. 6. Both the asymmetric stress fields and the instability seem to be hallmarks of the stretching flow Regimes3d of these monodisperse materials. For example, early indications of a three-lobed appearance of the outflow stress region begin to appear at a wall shear rate of 12 s−1 fFig. 6sbdg, wheng˙
wtR>7, and become fully formed at higher rates. These are accessible for this material by simulation only, because the imposition of a symmetry plane along the flow centerline suppresses the instability that occurs in experimentfFig. 6scdcomes from the simulated steady-state flow at a piston speed of 5 mm/s, far into Regime s3d when g˙wtR>40g. Simulations of the whole channel width srather than a half-width with imposed symmetryddid indeed show the onset of instabili-ties above 0.5 mm/s, but this subject will require further study. Yet the simulations at these higher rates are instructive: In Regimes3dthe characteristic “fanglike” features of stretched material in the outflow, seen hitherto only in transient flows of branched melts fLee et al.s2001dgare predicted to occur even for linear melts. In fact, our calculations predict these features not only in the transient but for steady-state flow as well for monodisperse materials. It will be a challenge to create stable flows in which this pre-diction can be borne out.
4. PB 210k melt
[image:17.612.208.405.98.372.2]We may anticipate from studies on the PS material, that the more entangled PB melts are likely to exhibit highly symmetric stress fields in even very nonlinear flows, since the span of Regimes2dfor the melts extends to much greater rates. Indeed, at all flow rates accessible experimentally, the flow field was symmetric even though these extend into the first nonlinear Regime s2d. We show a representative result for the highest molecular
FIG. 7. Experimental and simulated stress field from the PB210 melt in the 11:1 contraction at a wall shear rate
weight material PB210 in Fig. 7 wheng˙wtd>3.6. The comparison used a stress-optical coefficient of 1.0310−8Pa−1, which is rather larger than one literature value of between
2.0310−9Pa−1 and 3.0310−9 Pa−1fJaneschitz-Kriegls1983dg. The discrepancy may be
related to the far greater tendency for PB to slip in viscometric nonlinear flows than PS. However, both experiment and numerical calculation agree that the only places where any asymmetry is apparent at allsin either experiment or calculationdare the vicinities of the reentrant corners. These are places where, locally, the nonlinearity of the flow is much higher than the mean value.
5. Transient flows and pressure drops
[image:18.612.139.477.100.355.2]The advantage of both the experimental and numerical protocols we have followed is that fully transient flows may be measured and modeled. Here, we present data on pressure-drop transients, as well as stress-birefringence fields during the flow start up. Naïve comparison of pressure-drop transients lead to a strong disagreement between simulation and experiment: The simulation predicts a very rapid rise of the pressure to a value close to its steady state, yet the experiments show a well-resolved rise timessee Fig. 8d. This is due to the compressibility of the upstream reservoir, as shown by a simple calculation. For, in order for the melt to transmit stresses into the constriction of the order of the shear modulus GN(0), it must be compressed by the piston by relative volumeDV / V so that the pressure generated by the bulk modulus B is of order GN(0):
BDV V >GN
s0d s7d
But, for PS, B / GN(0),103, and, since the upstream piston length is 10 cm, the piston displacement corresponding to this compression is of the order of 0.1 mm. At a piston speed of 0.2 mm/ssthat of Fig. 8d, the time scale for achieving the steady-state flow at the constriction end of the reservoir is therefore about 0.5 s, as seen in the experiment. We also observe by comparing the characteristic transient time scales with different piston speeds that they follow a constant bulk strain of the upstream melt, as predicted by Eq. s6d, rather than any constant intrinsic time scale.
[image:19.612.137.475.72.450.2]In order to permit a realistic comparison of transients from experiment and simulation, the compressibility effect must be accounted for. Simulation of the entire upstream res-ervoir is unfeasible, so instead we modulate the 1D upstream velocity boundary condition with an exponential decay onto the steady-state value that matches just the time constant of the observed pressure transientsdashed curve in Fig. 8d. Under such time dependent forcing, the full stress field in time may be computed and compared to the observed field.
FIG. 9. PS262 K at 200 °C—Evolution of flow birefringence at piston speed of 0.5 mm/sssteady-state wall shear rate of 29 s−1d:sadt = 0.25 s,sbdt = 0.5 s,scdt = 0.75 s,sddt = 1.0 s,sedt = 1.25 s, andsfdt = 1.5 ssfully
A series of results is shown in Fig. 9 for the PS262 melt in Regimes2d. The overall shape and magnitude of the stress field is captured throughout the transient flow. Further-more, there are detailed features of the transient flow that are not present in the steady flow that appear in both the experiment and simulation. In particular, lobes of high principal stress from the upstream and downstream re-entrant corners grow, then retreat, during the transient. In spite of the allowance for the delay in flow at the constriction itself, however, these features still occur slightly earlier in the simulation than in experi-ment. For example, the lobe at the upstream re-entrant corner attains maximum extent in the experiment at 1.2 s, while the simulations find this maximum at 0.5 s after start up of flow. This is unlikely to be a constitutive flaw simply related to the viscometric transient response, since the shear overshoots in viscometric flows are well captured by the Ro-liePoly model.
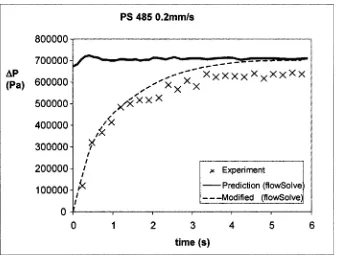
[image:20.612.139.476.94.394.2]Figure 10 shows the comparison of predicted and steady-state pressure drops for the high molecular weight PS485 material. The agreement is good well into Regimes2dof nonlinear flow, but as the experiments become increasingly unstableswhile the simula-tions remain artificially stabled, an increasingly large overprediction of the stress is ob-served. This observation of reduction in expected dissipation suggests that the manifestly unstable flowfFig. 6sbdis a snapshot of an unsteady flowgmay also be accompanied by wall slip. This is also consistent with, but not conclusively determined by, the time dependent birefringence images.
FIG. 10. Observed and simulated steady-state pressure drops as a function of piston speed for the PS485 melt.
Above 0.5 mm/sswall shear rate of 29 s−1d, the observed values fall markedly below the predicted values, but
V. CONCLUSIONS
Monodisperse polymer melts clarify rheology in complex flows in a similar way to that in viscometry. In simple rheological response, sharp monodispersity in molecular structure gives rise to a clear “reptation” peak in the loss modulus, and sharp stress overshoots in strong shear transients. These features are universal among entangled poly-mers when compared at equal degrees of entanglement and entanglement time scale. The corresponding features in the complex constriction flow described here include the highly symmetric stress fields seen in all nonstretching flows, even highly nonlinear ones, and the appearance of very characteristic features in both inflow and outflow when chains become stretched. The advantage of monodispersity at the molecular level is then under-stood as the separation of time scales for orientation relaxation sreptationd and stretch relaxationsRoused, and the absence of the mixed states of chains that will naturally arise in a polydisperse blend. Some of these features occur only in the transient flow and not in steady state. The tube model constitutive equation captures these quantitatively, but the time at which they occur in the transient is affectedsinitially surprisinglydby upstream compressibility of the melt reservoir. Simulations that treat only isolated portions of the flow need to be presented with time-modified boundary conditions to correspond to real experiments.
The second advantagesfor a scientific study, not for a real processd of very narrow polydispersity is the amplification of flow instabilities that break lateral symmetry. Both experiment and simulation indicate that strongly nonlinear flows are prone, especially in the outflows, to oscillations that direct the centerline alternately to one side, then the other, at a frequency that is set by the characteristic deformation rate in the channel.
ACKNOWLEDGMENTS
The authors gratefully acknowledge the support of EPSRCsUKdunder the “Micro-scale Polymer Processing” consortium grant, and the essential additional support of BP Chemicals, DuPont Films, DuPont Teijin, Dow Chemical, BASF, DSM, and Lucite In-ternational. Helpful discussions with Nat Inkson, Ralph Colby, and Daniel Read assisted the preparation of the manuscript, as did helpful comments from referees.
References
Baaijens F. P. T., S. H. A. Seelen, H. P. W. Baaijens, G. W. M. Peters, and H. E. H. Meijer, “Viscoelastic flow past a confined cylinder of a low density polyethylene melt,” J. Non-Newtonian Fluid Mech. 68, 173–203
s1997d.
Bent J., L. R. Hutchings, R. W. Richards, T. Gough, R. Spares, P. D. Coates, I. Grillo, O. G. Harlen, D. J. Read, R. S. Graham, A. E. Likhtman, D. J. Groves, T. M. Nicholson, and T. C. B. McLeish, “Neutron-mapping polymer flow: Scattering, flow visualization, and molecular theory,” Science 301, 1691–1695s2003d. Bishko G. B., O. G. Harlen, T. M. Nicholson, and T. C. B. McLeish, “Numerical simulation of the transient flow
of branched polymer melts through a planar contraction using the ‘pom-pom’ Model,” J. Non-Newtonian Fluid Mech. 82, 255–273s1999d.
Doi, M., and S. F. Edwards, The Theory of Polymer DynamicssOxford University Press, Oxford, UK, 1986d. Graham, R. S., A. E. Likhtman, S. T. Milner, and T. C. B. McLeish, “Microscopic theory of linear entangled polymer chains under rapid deformation including chain stretch and convective constraint release,” J. Rheol.
47, 1171–1200s2003d.
Janeschitz-Kriegl, H., Polymer Melt Rheology and Flow BirefringencesSpringer, New York, 1983d.
Larson, R. G., T. Sridhar, L. G. Leal, G. H. McKinley, A. E. Likhtman, and T. C. B. McLeish, “Definitions of entanglement spacing and time constants in the tube model,” J. Rheol. 47, 809–818s2003d.
Laso, M., and H. C. Öttinger, “Calculation of viscoelastic flow using molecular models: The CONFFESSIT approach,” J. Non-Newtonian Fluid Mech. 47, 1–20s1993d.
Lee, C. S., B. C. Tripp, and J. J. Magda, “Does N1 or N2 control the onset of edge fracture?” J. Rheol. 31, 306–308s1992d.
Lee, K., and M. R. Mackley, “The application of the multipass rheometer for precise rheooptic characterisation of polyethylene melts,” Chem. Eng. Sci. 56, 5653–5661s2001d.
Lee, K., M. R. Mackley, T. C. B. McLeish, T. M. Nicholson, and O. G. Harlen, “Experimental observation and numerical simulation of transient stress fangs within flowin molten polyethylene,” J. Rheol. 45, 1261–1277
s2001d.
Likhtman, A. E., and T. C. B. McLeish, “Quantitative theory for linear dynamics of linear entangled polymers,” Macromolecules 35, 6332–6343s2002d.
Likhtman, A. E., and R. S. Graham, “Simple constitutive equation for linear polymer melts derived from molecular theory: Rolie-Poly equation,” J. Non-Newtonian Fluid Mech. 114, 1–12s2003d.
Mackley, M. R., Marshall, R. T. J., and Smeulders, J. B. A. F., “The multipass rheometer,” J. Rheol. 39, 1293–1309s1995d.
McLeish, T. C. B., and S. T. Milner, “Entangled dynamics and melt flow of branched polymers,” Adv. Polym. Sci. 143, 195–256s1999d.
Mead, D. W., R. G. Larson, and M. Doi, “A molecular theory of fast flows of linear polymers,” Macromolecules
31, 7895–7914s1998d.
Meissner J., and J Hostettler, “A new elongational rheometer for polymer melts and other highly viscoelastic liquids,” Rheol. Acta 33, 1–21s1994d.
Milner, S. T., T. C. B. McLeish, and A. E. Likhtman, “Microscopic theory of convective constraint release,” J. Rheol. 45, 539–563s2001d.
Morton, M., and Fetters, L. J., “Anionic polymerization of vinyl monomers,” Rubber Chem. Technol. 48, 359–409s1975d.
Pangborn, A. B., M. A. Giardello, R. H. Grubbs, R. K. Rosen, and F. J. Timmers, “Safe and convenient procedure for solvent purification,” Organometallics 15, 1518–1520s1996d.
Peters, E. A. J. F., A. P. G. van Heel, M. A. Hulsen, and B. H. A. A. van den Brule, “Generalization of the deformation field method to simulate advanced reptation models in complex flow,” J. Rheol. 44, 811–829
s2000d.
Rajagopalan, D., R. C. Armstrong, and R. A. Brown, “Comparison of computational efficiency of flow simu-lations with multimode constitutive equations: Integral and differential models,” J. Non-Newtonian Fluid Mech. 46, 243–273s1993d.
Schulze, J. S., T. P. Lodge, C. W. Macosko, J. Hepperle, H. Munstedt, H. Bastian, D. Ferri, D. J. Groves, Y. H. Kim, M. Lyon, T. Schweizer, T. Virkler, E. Wassner, and W. Zoetelief, “A comparison of extensional viscosity measurements from various RME rheometers,” Rheol. Acta 40, 457–466s2001d.
Tanner R. I., and M. Keentok, “Shear fracture in cone-plate rheometry,” J. Rheol. 27, 47–57s1983d. Verbeeten, W., G. W. M. Peters, and F. P. T. Baaijens, “The extended pom-pom model,” J. Rheol. 45, 823–843
s2001d.