This is a repository copy of Crack detection using nonlinear output frequency response functions - an experimental study.
White Rose Research Online URL for this paper: http://eprints.whiterose.ac.uk/74575/
Monograph:
Peng, Z.K., Lang, Z.Q. and Billings, S.A. (2006) Crack detection using nonlinear output frequency response functions - an experimental study. Research Report. ACSE Research Report no. 926 . Automatic Control and Systems Engineering, University of Sheffield
[email protected] https://eprints.whiterose.ac.uk/
Reuse
Unless indicated otherwise, fulltext items are protected by copyright with all rights reserved. The copyright exception in section 29 of the Copyright, Designs and Patents Act 1988 allows the making of a single copy solely for the purpose of non-commercial research or private study within the limits of fair dealing. The publisher or other rights-holder may allow further reproduction and re-use of this version - refer to the White Rose Research Online record for this item. Where records identify the publisher as the copyright holder, users can verify any specific terms of use on the publisher’s website.
Takedown
If you consider content in White Rose Research Online to be in breach of UK law, please notify us by
Crack Detection Using Nonlinear Output
Frequency Response Functions – An
Experimental Study
Z K Peng, Z Q Lang, and S A Billings
Department of Automatic Control and Systems Engineering The University of Sheffield
Mappin Street, Sheffield S1 3JD, UK
Crack Detection Using Nonlinear Output
Frequency Response Functions – An
Experimental Study
Z.K. Peng, Z.Q. Lang, S. A. Billings
Department of Automatic Control and Systems Engineering, University of Sheffield Mappin Street, Sheffield, S1 3JD, UK
Emails: [email protected], [email protected], [email protected]
Abstract: The new concept of Nonlinear Output Frequency Response Functions (NOFRFs) is introduced in this paper to detect cracks in beams using frequency domain information. The results show that the NOFRFs are a sensitive indicator of the presence of cracks providing the excitation is of an appropriate strength. The new results provide a novel and effective method for the detection of cracks in beams, with applications in structural fault diagnosis.
1 Introduction
may cause difficulties when using linear methods for crack detection in practice, have been discussed in [10]. Over recent years, increasing attention has been focused on the application of the nonlinear methods to detect the presence of cracks [9]-[14]. When a cracked object is subjected to a harmonic input, the appearance of superharmonic components and subharmonic resonances may be observed. In [9]-[14], these phenomena are termed ‘the nonlinear effects’. In [9], Bovsunovsky and Surace claimed that nonlinear effects are more sensitive to the presence of a crack than the change in natural frequencies, or mode shapes. These authors also studied the influence of damping on the nonlinear effects. Based on subharmonic resonances, Tsyfansky and Beresnevich [10] developed a new approach for the detection of fatigue cracks in flexible, geometrically nonlinear beam-type structural elements. Later, they [11] used the same procedure to detect cracks in aircraft wings. Sundermeyer and Weaver [12] studied the forced response of a bilinear model subjected to an excitation with two frequencies, and based on these results they further exploited the weakly nonlinear character of a cracked beam to determine the crack location. In [13], Saavedra and Cuitino studied dynamic behaviors of different multi-beam systems containing a transverse crack theoretically and experimentally, and gave many results regarding which nonlinear effects would be useful for crack detection.
In summary, as indicated by previous studies by several authors, nonlinear analysis based methods are often much more sensitive to the presence of cracks than linear vibration based methods. The research reported in this paper is devoted to the introduction of the concept of the Nonlinear Output Frequency Response Functions (NOFRFs) [14]-[16] and the application of this for crack detection. NOFRFs are a new concept developed recently by the authors, which allows the analysis of nonlinear systems to be implemented in a similar manner to linear system frequency response analysis. This provides great insight into how nonlinear phenomena such as the generation of new frequencies occur. This paper is focused on an experimental study to demonstrate that the NOFRFs are a good indicator of the presence of cracks in a beam, with the aim of establishing a basis for the use of NOFRFs in structural defect diagnosis in engineering practice.
2. Nonlinear Output Frequency Response Functions (NOFRFs)
2.1 NOFRFs under General Inputs
NOFRFs were recently proposed and used to investigate the behaviour of structures with polynomial-type non-linearities [14]. The definition of NOFRFs is based on the Volterra series theory of nonlinear systems. The Volterra series extends the well-known convolution integral description for linear systems to a series of multi-dimensional convolution integrals, which can be used to represent a wide class of nonlinear systems [15].
Consider the class of nonlinear systems which are stable at zero equilibrium and which can be described in the neighbourhood of the equilibrium by the Volterra series
i n i i n N n
n u t d
h t
y( ) (τ ,...,τ ) ( τ ) τ
1 1 1
∏
∑∫ ∫
= = ∞ ∞ − ∞ ∞ − −= L (1)
where y(t) and u(t) are the output and input of the system, hn(τ1,...,τn) is the nth order
Volterra kernel, and N denotes the maximum order of the system nonlinearity. Lang and
Billings [15] derived an expression for the output frequency response of this class of nonlinear systems to a general input. The result is
⎪ ⎪ ⎩ ⎪ ⎪ ⎨ ⎧ = ∀ =
∫
∏
∑
= + + = − = ω ω ω ω σ ω ω ω π ω ω ω ω n 1 n n 1 i i n 1 n 1 n n N 1 n n d j U j j H 2 n 1 j Y j Y j Y ,..., ) ( ) ,..., ( ) ( ) ( for ) ( ) ( (2)This expression reveals how nonlinear mechanisms operate on the input spectra to
produce the system output frequency response. In (2), Y(jω) is the spectrum of the
system output, Yn(jω) represents the nth order output frequency response of the system,
n j
n n
n
n j j h e d d
H ( ω ,..., ω ) ... (τ ,...,τ ) ωτ ωnτn τ ... τ
1 ) ,..., ( 1 1 1 1 + +
− ∞ ∞ − ∞ ∞ −
∫
∫
= (3)
is the nth order Generalised Frequency Response Function (GFRF) [15], and
∫
∏
= +
+ ω ω =
ω ω σ ω ω ω n n n i i n
n j j U j d
H ,..., 1 1 1 ) ( ) ,..., (
denotes the integration of
∏
over the n-dimensional hyper-plane= n
i
i n
n j j U j
H
1
1,..., ) ( )
( ω ω ω
ω ω
ω1+L+ n = . Equation (2) is a natural extension of the well-known linear relationship
) ( ) ( )
(jω H jωU jω
Y = , where H(jω) is the frequency response function, to the
nonlinear case.
the input and output frequencies is more complicated. Given the frequency range of an input, the output frequencies of system (1) can be determined using the explicit expression derived by Lang and Billings in [15].
Based on the above results for the output frequency response of nonlinear systems, a new concept known as the Nonlinear Output Frequency Response Function (NOFRF) was recently introduced by Lang and Billings [14]. The NOFRF is defined as
∫ ∏
∫
∏
= + + = = + + = = ω ω ω ω ω ω ω ω σ ω σ ω ω ω ω n n n n i i n n i i n n n d j U d j U j j H j G ,..., 1 ,..., 1 1 1 1 ) ( ) ( ) ,..., ( )( (4)
under the condition that
0 ) ( ) ( ,..., 1 1 ≠ =
∫ ∏
= + + ω ω = ω ω σ ω ω n n n i in j U j d
U (5)
Notice that Gn(jω) is valid over the frequency range of Un(jω) , which can be
determined using the algorithm in [15].
By introducing the NOFRFs Gn(jω), n=1,LN, Equation (2) can be written as
∑
∑
= = = = N n n n N nn j G j U j
Y j Y 1 1 ) ( ) ( ) ( )
( ω ω ω ω (6)
which is similar to the description of the output frequency response for linear systems.
For a linear system, the relationship between Y(jω) and U(jω) can be illustrated as
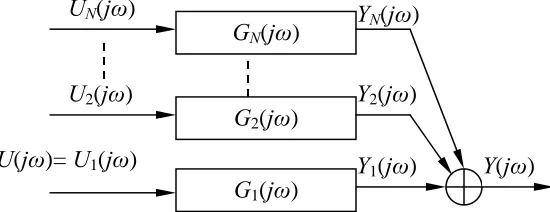
shown in Figure 1. Similarly, the nonlinear system input and output relationship of Equation (6) can be illustrated as shown in Figure 2.
Y(j ) U(j )
[image:6.612.182.457.566.672.2]H(j )=G1(j )
Figure 1. The output frequency response of a linear system
Y1(j ) Y2(j ) YN(j )
UN(j )
U(j )= U1(j ) U2(j )
G1(j ) G2(j )
Y(j ) GN(j )
The NOFRFs reflect a combined contribution of the system and the input to the system
output frequency response behaviour. It can be seen from Equation (4) that Gn(jω)
depends not only on Hn (i=1,…,N) but also on the input U(jω). For any structure, the
dynamical properties are determined by the GFRFs (i= 1,…,N). However, from
Equation (3) it can be seen that the GFRF is multidimensional [17][18], which can make the GFRFs difficult to measure, display and interpret in practice. Feijoo, Worden and Stanway [19][20] demonstrated that the Volterra series can be described by a series of associated linear equations (ALEs) whose corresponding associated frequency response functions (AFRFs) are easier to analyze and interpret than the GFRFs. According to Equation (4), the NOFRF
n
H
) (jω
Gn is a weighted sum of Hn(jω1,..., jωn) over
ω ω
ω1+L+ n = with the weights depending on the test input. Therefore Gn(jω) can be
used as an alternative representation of the dynamical properties described by . The
most important property of the NOFRF
n
H )
(jω
Gn is that it is one dimensional, and thus
allows the analysis of nonlinear systems to be implemented in a convenient manner similar to the analysis of linear systems. Moreover, there is an effective algorithm [14] available which allows the estimation of the NOFRFs to be implemented directly using system input output data. This algorithm is briefly introduced below.
Rewrite Equation (6) as
[
Y(jω)] [
= U1(jω),L,UN(jω)][
G(jω)]
(7)where
[
G(jω)]
=[G1(jω),L,GN(jω)]T.Consider the case of u(t)=αu*(t) where α is a constant and is the input signal under
which the NOFRFs of the system are to be evaluated, then
) ( * t u ) ( ) ( ) 2 ( 1 ) ( ) 2 ( 1 ) ( * ,..., 1 * 1 ,..., 1 1 1 1 ω α σ ω π α σ ω π ω ω ω ω ω ω ω ω ω j U d j U n d j U n j U n n n n i i n n n n i i n n n n = = =
∫ ∏
∫ ∏
= + + = − = + + = − (8)where U*(jω) is the Fourier Transform of u*(t) and
∫ ∏
= + + = − = ω ω ω ω σ ω π ω n n n i i nn U j d
n j U ,..., 1 * 1 * 1 ) ( ) 2 ( 1 ) (
In this case, it is known from Equation (7) that
[
Y(jω)]
=[
αU1*(jω),L,αNUN*(jω)][
G*(jω)]
(9)where
[
G (j )]
[
G1*(j ), ,G*N(j )Twhich are the NOFRFs to be evaluated.* ω ω ω
L
Excite the system under study N times using the input signals αiu*(t), i=1,...,N, where
N ≥N and αN,αN−1,L,α1 are constants which satisfy the condition
0
1 1 > > >
>α − α
αN N L
so that N output frequency responses Yi(jω), i=1,...,N can be generated for the system
under study. From Equation (9), it is known that the output frequency responses can be related to the NOFRFs to be evaluated as below.
[
( )]
) ( )
( 1,..., *
,...,
1 ω ω ω
j G j j N N U
Y = (10)
where
[
N]
TN
j Y j
Y
j ) ( ), , ( )
( 1
,...,
1 ω ω ω
L
=
Y (11)
and ⎥ ⎥ ⎥ ⎦ ⎤ ⎢ ⎢ ⎢ ⎣ ⎡ = ) ( , ), ( ) ( , ), ( ) ( * * 1 * 1 * 1 1 ,..., 1 ω α ω α ω α ω α ω j U j U j U j U j N N N N N N N L M L
U (14)
Consequently the values of the NOFRFs, , can be determined using a
least squares based approach as
) ( , ), ( * *
1 jω G jω
G L N
[
] [
]
(
( )) (
( )) (
( ))
( ) ) ( , ), ( ) ( ,..., 1 ,..., 1 1 ,..., 1 ,..., 1 * * 1 * ω ω ω ω ω ω ω j j j j j G j G j G N T N N T N T N Y U U U − ⎥⎦ ⎤ ⎢⎣ ⎡ = = L (12)2.2 NOFRFs under Harmonic Inputs
Harmonic inputs are pure sinusoidal signals which have been widely used for the dynamic testing of many engineering structures. Therefore, it is necessary to extend the NOFRF concept to the harmonic input case.
When system (1) is subject to a harmonic input
) cos(
)
(t = A ω t+β
u F (13)
Lang and Billings [15] showed that Equation (1) can be expressed as
∑
∑
∑
= + + = = ⎟ ⎟ ⎠ ⎞ ⎜ ⎜ ⎝ ⎛ = = N n k k k k n n N n n kn k nn A j A j
j j H j Y j Y 1 1 1 1
1, , ) ( ) ( )
( 2 1 ) ( ) ( ω ω ω ω ω ω ω ω ω L L
L (14)
where ⎩ ⎨ ⎧ = 0 | | ) ( ) ( sign β
ω A ej k
j
A if
{
}
otherwise 1 , =±
∈ kωF k
ω
Defining the frequency components of nth order output of the system as , then according to Equation (14), the frequency components in the system output can be expressed as n Ω
U
N n n 1 = Ω =Ω (16)
and Ωn is determined by the set of frequencies
{
k k k F i n}
i
n | , 1, ,
1+L+ =± = L
=ω ω ω ω
ω (17)
From Equation (17), it is known that if all
n
k
k ω
ω , ,
1 L are taken as −ωF, then ω=−nωF.
If k of these are taken as ωF, then ω =(−n+2k)ωF. The maximal k is n. Therefore the
possible frequency components of Yn(jω) are
n
Ω =
{
(−n+2k)ωF,k =0,1,L,n}
(18)Moreover, it is easy to deduce that
} , , 1 , 0 , 1 , , , { 1 N N k k F N n
n L L
U
Ω = =− −= Ω
=
ω (19)
Equation (19) explains why some superharmonic components will be generated when a nonlinear system is subjected to a harmonic excitation. In the following, only those components with positive frequencies will be considered.
The NOFRFs defined in Equation (4) can be extended to the case of harmonic inputs as
∑
∑
= + + = + + = ω ω ω ω ω ω ω ω ω ω ω ω ω kn k n kn k n n k k n k k k k n n H n j A j A j A j A j j H j G L L L L L 1 1 1 1 1 ) ( ) ( 2 1 ) ( ) ( ) , , ( 2 1 )( n = 1,…, N (20)
under the condition that
0 ) ( ) ( 2 1 ) ( 1 1 ≠ =
∑
= + + ω ω ω ω ω ω kn k n k k nn j A j A j
A
L
L (21)
Obviously, is only valid over GnH(jω) Ωn defined by Equation (18). Consequently, the
output spectrum Y(jω) of nonlinear systems under a harmonic input can be expressed as
∑
∑
= = = = N n n H n N nn j G j A j
Y j Y 1 1 ) ( ) ( ) ( )
( ω ω ω ω (22)
When k of the n frequencies of
n
k
k ω
ω , ,
1 L are taken as ωF and the remainder are as
F
ω
− , substituting Equation (15) into Equation (21) yields,
β
ω ( 2 )
| | 2 1 ) ) 2 (
( F n n j n k
n j n k A e
Thus becomes GnH(jω) β β ω ω ω ω ω ) 2 ( ) 2 ( | | 2 1 | | ) , , , , , ( 2 1 ) ) 2 ( ( k n j n n k n j n k n F F k F F n n F H n e A e A j j j j H k n j G + − + − − − − = + − 4 4 8 4 4 7 6 L 4 48 4 47 6 L ) , , , , , ( 4 4 8 4 4 7 6 L 4 48 4 47 6 L k n F F k F F
n j j j j
H
−
− −
= ω ω ω ω (24)
where Hn(jω1,...,jωn) is assumed to be a symmetric function. Therefore, in this case,
over the nth order output frequency range
) (jω
GnH Ωn=
{
(−n+2k)ωF,k =0,1,L,n}
isequal to the GFRFHn(jω1,...,jωn) evaluated atω1 =L=ωk =ωF, ωk+1 =L=ωn =−ωF,
. n k=0,L,
This result indicates that the concept of NOFRFs can represent, to a certain extent, the dynamic characteristics of a nonlinear system under investigation, and may therefore be suitable for fault detection of mechanical or civil structures based on the difference of the structural dynamics in the fault and fault free situations.
3 Nonlinearity of Cracked Beams
The presence of a crack in a beam will introduce a local flexibility that affects its dynamic response. During vibrations, a crack does not remain always open; it will open and close over time depending on the loading conditions and vibration amplitudes. If the static deflection due to loading on a cracked beam (e.g. body weight of the beam) is larger than the vibration amplitude, then the crack may remain in one condition all the time, always open or always closed depending on the position of the crack. In this case, the cracked beam may be described as a linear system. If the static deflection is small, then the crack may open and close over time depending on the vibration amplitude. In this case, the cracked beam will behave as a nonlinear system, and nonlinear effects will be present in the output response [21].
Using the finite element method, the dynamical equation of a crack free beam can be written as [21]
[ ]
M{ }
U&& +[ ]
K{ } { }
U = F (25)where
[
M]
is the mass matrix,[
K]
is the stiffness matrix,{ }
U is the displacement vectorand
{
is the load vector. For a cracked beam, when the crack is open, an additionalstiffness is introduced, and equation (25) changes to
}
F[
∆K−
]
In the study of cracks, a breathing crack is often considered, and it is assumed that when the bending moment changes sign, cracks change from open to closed, or from closed to open. Therefore, a cracked beam can behave like a bilinear nonlinear system, as described by [21]
[ ]
{ }
[ ]
{ } { }
[ ]
{ }
[
]
{ } { }
if crack isopen closed is crack if⎩ ⎨ ⎧
= ∆
− +
= +
F U K K U M
F U K U M
& &
& &
(27)
The bilinear system (27) is a typical nonlinear system. Numerical studies have shown that this bilinear model can explain the nonlinear phenomena of the generation of super-harmonic components, which have been observed in the output response of cracked beams subjected to a harmonic input. A crack free beam behaves linearly as described by (25) and can thus be analyzed simply using the well-established Frequency Response Function (FRF). However, the FRF cannot be effectively used to explain the nonlinear phenomena that are characteristic of a cracked beam. This is because the linear FRF based approaches basically monitor the changes of structures at the resonant frequencies or in the mode shapes. However, the presence of cracks will often not induce a significant change in these structural characteristics. In order to solve this problem, the concept of NOFRFs was introduced in [14] to describe the behavior of cracked structures. The results showed that the NOFRFs can provide an explicit explanation for the generation of superharmonic components from a bilinear system subjected to a harmonic excitation. Based on the NOFRF description, the difference between cracked and crack free beams can be illustrated as shown in Figure 3. Figure 3 indicates that the NOFRF concept can be used to more effectively distinguish the cracked and crack free situations in structures.
Crack Free
NOFRF: G1(j ) = H(j ), G2(j ),…, GN(j )
FRF: H(j )
[image:11.612.157.458.477.574.2]Cracked
Figure 3, The difference between crack free and cracked beams
4 An Experimental Study of Crack Detection Using Nonlinear
Output Frequency Response Functions
) (jω
Y and )Un(jω for a particular n of interest and is based on the Volterra series of
nonlinear systems. Compared to NOFRFs, the HOTF is not a theoretically well established concept although under certain conditions, NOFRFs and HOTF can be related to each other. In this section, the application of the concept of NOFRFs for crack detection is investigated based on an experimental study.
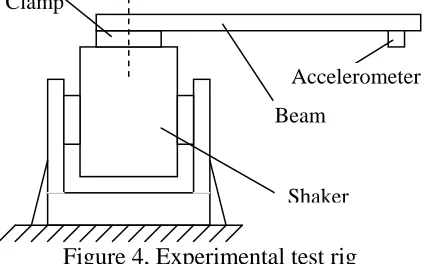
The experimental test rig is shown in Figure 4, which mainly consists of a shaker to generate the excitation, a clamp to fix the beam on the shaker, a beam and an accelerometer mounted at the free end of the beam to measure the acceleration. Three specimen beams were tested: one crack free, one with a slight crack defect (the ratio between the crack depth and the thickness of the beam was about 0.2), and one with a deep crack (the ratio was about 0.4). According to the requirements for estimating the
NOFRFs up to 4th order, four inputs with the same waveform but different strengths will
be needed to excite the system respectively. But for the harmonic input case, according to equations (22) and (23), the frequency components of the output can be written as
) ( ) ( ) ( ) ( )
(j F G1H j F A1 j F G3H j F A3 j F
Y ω = ω ω + ω ω (28)
) 2 ( ) 2 ( ) 2 ( ) 2 ( )
2
(j F G2H j F A2 j F G4H j F A4 j F
Y ω = ω ω + ω ω (29)
Y(j3ωF)=G3H(j3ωF)A3(j3ωF) (30) )
4 ( ) 4 ( )
4
(j F G4H j F A4 j F
Y ω = ω ω (31)
From equations (28)~(31), it can be seen that two different inputs with the same waveform
but different strengths are sufficient to estimate the NOFRFs up to 4th order. Therefore, in
this study, two different inputs were used in each test. Considering the fact that the strength of the excitation forces may affect the nonlinearity of cracked beams, for example a small excitation force may only make the cracks open partly while a strong excitation could make the cracks open fully, to make sure cracks are at the same status during one test, the strengths of the two inputs were chosen such that the strengths did not differ from each
other considerably. The frequency F of the harmonic excitation was 200 Hz, and the
[image:12.612.201.413.573.705.2]vibration signals were sampled using an accelerometer at the sample rate of 8k Hz.
Figure 4, Experimental test rig
Clamp
Accelerometer Beam
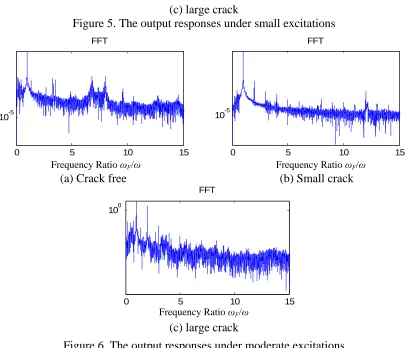
Figures 5, 6, 7 show the FFT spectra of three sets of output reponses which were sampled from three specimen beams under different excitation strengths. Figure 5 shows that under small excitations the nonlinear effects are very weak for both the crack free beam and the beam with a small crack as the superharmonic components of the spectra are too small to be observed. However, Fig 6 shows that the second harmonic component has a large amplitude when the beam has a large crack. The spectra in Figure 6 show that, under moderate excitations, the nonlinear effect is still quite weak for the crack free beam, however, the nonlinear effect becomes noticeable for both the two cracked beams as the superharmonic components up to fifth order are observable in the output spectra. Figure 7 shows the output spectra of the vibration signals sampled under strong excitation. It can be seen that some superharmonic components and some irregular components appear in the output spectra of the crack free beam. It is believed that in this case the strong excitations made the whole test rig behavior nonlinearly. For the two cracked beams, obviously, the nonlinear effect becomes significant, the superharmonic components are quite clear in the output spectra, especially in the output spectrum of the beam with a large crack where the second harmonic component is even larger than the fundamental harmonic component. These observation results indicate that the presence of cracks will induce the nonlinear effects in the output response, and the degree of nonlinearity depends on the strength of the excitations.
FFT FFT
0 5 10 15
10-5 100
0 5 10 15
10-5
Frequency / Hz Frequency / Hz
(a) Crack free (b) Small crack
Frequency Ratio F/ Frequency Ratio F/
FFT
0 5 10 15
100
Frequency / Hz
(c) large crack
Figure 5. The output responses under small excitations
FFT FFT
0 5 10 15
10-5
0 5 10 15
10-5
Frequency / Hz Frequency / Hz
(a) Crack free (b) Small crack
Frequency Ratio F/ Frequency Ratio F/
FFT
0 5 10 15
100
Frequency / Hz
(c) large crack
[image:14.612.102.507.72.420.2]Frequency Ratio F/
Figure 6. The output responses under moderate excitations
0 5 10 15
10-5 100
FFT FFT
0 5 10 15
10-5
Frequency / Hz Frequency / Hz
(a) Crack free (b) Small crack
Frequency Ratio F/ Frequency Ratio F/
FFT
0 5 10 15
(c) lagre crack
Figure 7. The output responses under strong excitations
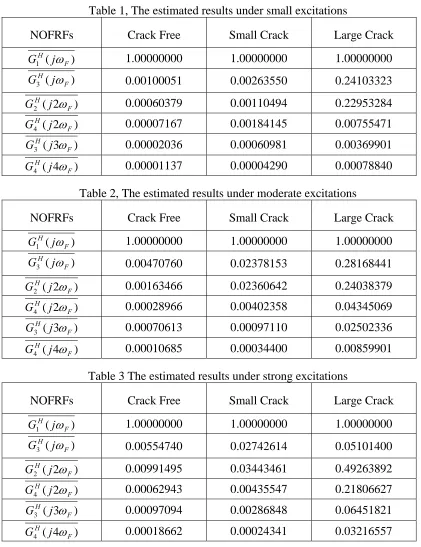
Tables 1, 2 and 3 give the NOFRF evaluation results for the three specimen beams. It is worth noting that all the NOFRFs in the tables have been normalized by divided by . It can be seen that, at the same excitation level, the NOFRFs of the beam with
a large crack are always the largest, while for the beam with a small crack, and the crack free beam the NOFRFs are always relatively small. This means that the behavior of the beam with a large crack is considerably more nonlinear than the crack free beam. It also can be seen that, under small excitations, the NOFRFs of a beam with a small crack are quite small, even smaller than the NOFRFs of the crack free beam under moderate and strong excitations. This is because small excitations may not cause the crack to open, and therefore the beam behaves just like a crack free beam. In addition, the large values of the NOFRFs of the crack free beam under strong excitations indicate that strong excitations made the test rig behave nonlinearly. Therefore, in a strong excitation case, the NOFRFs of the cracked beams reflect the combined nonlinear effects of the crack in the beam and the test rig, but compared to the nonlinear effect caused by a crack, the nonlinear effect from the test rig is less significant.
) (
1 F
H
j
G ω
The results in Tables 1, 2 and 3 show that the NOFRFs are a quite sensitive indicator of the presence of a crack as long as the excitation is strong enough to open the crack. Under small excitations, there are slight differences between the NOFRFs of the crack free beam and the slightly cracked beam, but the NOFRFs of the beam with a deep crack are much larger than the NOFRFs of the crack free beam. Under moderate and large excitations, most of the NOFRFs of the cracked beams are much larger than the NOFRFs of the crack free beam. Therefore, the NOFRFs are a good indicator of the presence of a crack. Moreover, it can be seen that the NOFRFs of the beam with a large crack are always larger than the NOFRFs of the beam with a small crack under the same excitation, which implies that the values of the NOFRFs can be regarded as an indicator of the crack size, larger NOFRFs inferring a larger crack size. The advantage of using the NOFRF results in Tables 1, 2 and 3 is that single values are given for the NOFRFs which are much easier to compare and interpret compared to other frequency based methods.
the test rig behave nonlinearly and the difference between the NOFRFs evaluated in the cracked and crack free situations may not be considerably different.
Table 1, The estimated results under small excitations
NOFRFs Crack Free Small Crack Large Crack
) (
1 F
H j
G ω 1.00000000 1.00000000 1.00000000
) (
3 F
H
j
G ω 0.00100051 0.00263550 0.24103323
) 2 (
2 F
H j
G ω 0.00060379 0.00110494 0.22953284
) 2 (
4 F
H j
G ω 0.00007167 0.00184145 0.00755471
) 3 (
3 F
H
j
G ω 0.00002036 0.00060981 0.00369901
) 4 (
4 F
H j
G ω 0.00001137 0.00004290 0.00078840
Table 2, The estimated results under moderate excitations
NOFRFs Crack Free Small Crack Large Crack
) (
1 F
H j
G ω 1.00000000 1.00000000 1.00000000
) (
3 F
H
j
G ω 0.00470760 0.02378153 0.28168441
) 2 (
2 F
H j
G ω 0.00163466 0.02360642 0.24038379
) 2 (
4 F
H j
G ω 0.00028966 0.00402358 0.04345069
) 3 (
3 F
H
j
G ω 0.00070613 0.00097110 0.02502336
) 4 (
4 F
H j
G ω 0.00010685 0.00034400 0.00859901
Table 3 The estimated results under strong excitations
NOFRFs Crack Free Small Crack Large Crack
) (
1 F
H j
G ω 1.00000000 1.00000000 1.00000000
) (
3 F
H j
G ω 0.00554740 0.02742614 0.05101400
) 2 (
2 F
H j
G ω 0.00991495 0.03443461 0.49263892
) 2 (
4 F
H j
G ω 0.00062943 0.00435547 0.21806627
) 3 (
3 F
H
j
G ω 0.00097094 0.00286848 0.06451821
) 4 (
4 F
H j
5 Conclusions and Remarks
The new concept of the Nonlinear Output Frequency Response Functions (NOFRFs) has been introduced for fault detection. The importance of using the NOFRFs instead of the FRF to describe cracked beams in the frequency domain has been analyzed. Finally, an experimental study using the NOFRFs to detect cracks has been conducted for three specimens of beams, one without a crack, one with a small crack and one with a large crack. The results indicate that the NOFRFs are a quite sensitive indicator of the presence of cracks in a beam as long as the excitations of appropriate strengths are employed, and the values of the computed NOFRFs are an indication of the crack size. Larger values of NOFRFs normally indicate larger crack sizes. The present study provides a novel and effective method for crack detection, with applications in structural fault diagnosis.
Acknowledgements
The authors gratefully acknowledge the support of the Engineering and Physical Science Research Council, UK, for this work.
References
1. Liang RY, Choy FK, Hu JL, Detection of cracks in beam structures using
measurements of natural frequencies, Journal of the Franklin Institute-Engineering
and Applied Mathematics, 328 (1991) 505-518
2. Chinchalkar S, Determination of crack location in beams using natural frequencies,
Journal of Sound and Vibration, 247 (2001) 417-429
3. Rizos PF, Dimarogona AD, Identification of crack location and magnitude in a
cantilever beam from the vibration modes, Journal of Sound and Vibration,138 (1989)
381-388
4. Tsai TC, Wang YZ, Vibration analysis and diagnosis of a cracked shaft, Journal of
Sound and Vibration, 192 (1996) 607-620
5. Kim JT, Ryu YS, Cho HM, Stubbs N,Damage identification in beam-type structures:
frequency-based method vs mode-shape-based method, Engineering Structures, 25
(2003) 57-67
6. Kyriazoglou C, Le Page BH, Guild FJ, Vibration damping for crack detection in
composite laminates, Composites Part A-Applied Science and Manufacturing, 35
(2004) 945-953
7. Panteliou SD, Chondros TG, Argyrakis VC, Dimarogonas AD, Damping factor as an
8. Imam I, Azarro S, Bankert R and Scheibel J, Development of an on-line rotor crack
detection and monitoring system. Journal of Vibration, Acoustics, Stress and
Reliability in Design 3 (1989) 241-250
9. Bovsunovsky AP, Surace C, Considerations regarding superharmonic vibrations of a
cracked beam and the variation in damping caused by the presence of the crack, Journal of Sound and Vibration, (2005) In press
10.Tsyfansky SL, Beresnevich VI, Detection of fatigue cracks in flexible geometrically
non-linear bars by vibration monitoring, Journal of Sound and Vibration213 (1998)
159-168
11.Tsyfansky SL, Beresnevich VI, Non-linear vibration method for detection of fatigue
cracks in aircraft wings, Journal of Sound and Vibration, 236 (2000) 49-60
12.Sundermeyer JN, Weaver RL, On crack identification and characterization in a beam
by nonlinear vibration analysis, Journal of Sound and Vibration, 183 (1995) 857-871
13.Saavedra PN, Cuitino LA, Crack detection and vibration behavior of cracked beams,
Computers and Structures, 79 (2001) 1451-1459
14.Z. Q. Lang, S. A. Billings, Energy transfer properties of nonlinear systems in the
frequency domain, International Journal of Control78 (2005) 354-362.
15.Z. Q. Lang, S. A. Billings, Output frequency characteristics of nonlinear system,
International Journal of Control 64 (1996) 1049-1067.
16.Z. K. Peng, Z. Q. Lang, S. A. Billings, Y. Lu, Frequency domain energy transfer
properties of bilinear oscillators under harmonic loadings, Journal of Sound and
Vibration, (2005) submitted.
17.H. Zhang, S. A. Billings, Analysing non-linear systems in the frequency domain, I:
the transfer function, Mechanical Systems and Signal Processing 7 (1993) 531–550.
18.H. Zhang, S. A. Billings, Analysing nonlinear systems in the frequency domain, II:
the phase response, Mechanical Systems and Signal Processing8 (1994) 45–62.
19.J. A. Vazquez Feijoo, K. Worden, R. Stanway, Associated Linear Equations for
Volterra operators, Mechanical Systems and Signal Processing 19 (2005)57-69.
20.J. A. Vazquez Feijoo, K. Worden. R. Stanway, System identification using associated
linear equations, Mechanical Systems and Signal Processing 18(2004)431-455.
21.T.G. Chondros, A.D. Dimarogonas, J. Yao, Vibration of a beam with breathing crack,
Journal of Sound and Vibration, 239 (2001) 57-67
22.R. Ruotolo, C. Surace, P. Crespo, D. Storer, Harmonic analysis of the vibration of a