i
Department of Cellular and Molecular Physiology
Institute of Translational Medicine
University of Liverpool
Metabolic Reprogramming
in Gastric Cancer
Thesis submitted in accordance with the requirements of the University of Liverpool for the degree of Doctor in Philosophy
Emily Elizabeth Heald Linnane
Supervisors: Prof. Chris Sanderson and Prof. Andrea Varro
ii Abstract
Globally, gastric cancer claims around 800,000 lives per year. As many patients present at an advanced stage of disease, prognosis remains poor for most patients, with five-year survival rates of less than 30%. As many patients show only limited short-term benefits from current therapeutic regimes, there is a clear need for improved understanding of the molecular mechanisms that drive the development and spread of gastric cancer. In this context, the role of the tumour microenvironment in cancer development and the potential for new forms of therapeutic intervention has become a field of increasing interest in many areas of cancer research. It is now well established that the development and progression of gastric tumours is facilitated by reciprocal communication between cancer cells, and cells within the surrounding tissue. In this study we focus our investigation on the mechanisms and consequences of paracrine communication between gastric cancer cells and different populations of stromal myofibroblasts, which are prevalent within the cancer microenvironment and form a significant proportion of many solid tumours.
iii
iv Acknowledgements
First and foremost I would like to thank my supervisor, Professor Chris Sanderson, for all your help and scientific guidance throughout this PhD project. You have been a great mentor to me, and I would like to thank you for all your patience, enthusiasm and support for the past three years. I would also like to thank Professor Varro and Professor Dockray for all your ideas, help and scientific direction throughout the past three years.
Thanks to the members of the Sanderson lab past and present; Rob and Kelly, for your help, support and friendship during the beginning of my PhD project. Amy, Bron, Jen, Jo and Hanna, for making the lab such a pleasant place to work in during the latter part of my project, and for all the fun times and nights out! I wish you all the best of luck with your projects and the future. Thanks also to Dave Peeney – we started our PhD around the same time and now we are both at the end of it, you have been a great friend to me, thank you for all the scientific discussions, help with lab work and laptops, and for providing many laughs and hilarity in the lab.
A special thanks to Dr Helen Smith; what I learnt from you in the first few months of this PhD project has been invaluable to me throughout the entirety of my work. I really appreciate all the hours you spent teaching me bioinformatics, R and especially the time you have given recently, helping with extra analyses of our data (all whilst working and with a new baby!) You have also been a fantastic friend and support to me during the PhD process, thank you.
To all my other friends who have put up with me during my write up- thank you! Dr Sarah Dryhurst, without your Skype pep-talks I honestly do not know what I would have done, thanks for always listening, for your advice, and for always being there for me when I needed a chat.
I would like to extend a massive heartfelt thank you to Dr Andrea Linford; you are an absolute star, especially for all your support over the past few months. Thank you for always believing in me, for providing your time and expertise during my write up period, and most of all, for always telling me the truth!!!
A big thank you to all my family, especially to my sister Rose, thank you for putting up with my moaning and for helping me see the light at the end of the tunnel. Thank you to my wonderful parents; to my dad, for all your support, and for reading through this thesis (and understanding it!) Mum, you are an absolute inspiration to me, and the reason why I have chosen this career. Without both your love and encouragement I would not have achieved as much as I have.
v List of abbreviations
AGS Angiosarcoma
ATM Adjacent Tissue Myofibroblast ATP Adenosine Triphosphate
BSA Bovine Serum Albumin
CAGA cytotoxin-associated gene A
CAGB cytotoxin-associated gene B
CAIX carbonic anhydrase IX
CAM Cancer Associated Myofibroblast
DMEM Dulbecco's Modified Eagle's Medium DNA Deoxyribonucleic acid
DPBS Dulbecco’s Phosphate Buffered Saline
EDN1 Endothelin-1
FBS Foetal Bovine Serum
GLUT-1 Glucose Transporter 1
H.Pylori Helicobactor pylori
HNSCC Head and Neck Squameous Cell Carcinoma
MCT1 Monocarboxylate Transporter One MCT4 Monocarboxylate Transporter Four MSCs Mesenchymal Stem Cell
NTM Normal Tissue Myofibroblast
PBS Phosphate-buffered saline
RNA Ribonucleic acid
TGF-B Transforming Growth Factor Beta
vi
uPAR Urokinase Plasmingen Activator Receptor VEGF Vascular endothelial growth factor
vii
Contents
Acknowledgements ... iv
List of abbreviations ... v
Chapter I ... 16
Introduction ... 16
1.0 Overview ... 17
1.1 Gastric Cancer: An Overview ... 18
1.2 Epidemiology of Gastric Cancer ... 20
1.2.1 Helicobactor pylori ... 21
1.2.2 Diet and Gastric Cancer ... 22
1.2.3 Genetics and Gastric Cancer ... 23
1.3 Targeting the Gastric Microenvironment ... 24
1.4 Cells of the Gastric Stroma and The Tumour Microenvironment ... 24
1.4.1 Fibroblast Cells ... 25
1.4.2 Mesenchymel Stem Cells ... 25
1.4.3 Myofibroblast Cells ... 26
1.4.3.1 The Origin of The Myofibroblast Cell... 26
1.4.3.2 Identifying Myofibroblast Cells ... 27
1.4.3.3 Myofibroblasts in Cancer ... 28
1.4.3.4 Myofibroblasts in gastric cancer ... 30
1.5 Signalling in the Gastric Cancer Environment ... 31
1.5.1 Transcription Factors ... 32
1.5.2 Epithelial to Mesenchymal Transition ... 34
1.5.4 Hypoxia ... 35
1.5.5 Cytokines ... 37
1.6 .Metabolism and Cancer ... 38
1.6.1 The Warburg Effect ... 38
1.6.2 The Reverse Warburg Effect ... 40
1.8 Hypotheses, Aims and Objectives ... 42
Chapter II... 43
Gene Expression Profiling Of Gastric Cancer Cells ... 43
2.0 Introduction ... 44
2.1 Aims and Hypotheses ... 46
viii
2.2.1 Microarray Sample Selection and Data Processing ... 47
2.2.2 qPCR for Real Time Evaluation of Microarray Data ... 48
2.2.3 Proliferation and Migration Assays ... 48
2.3 Results ... 49
2.3.1 Characterisation of primary myofibroblast cell lines ... 49
2.3.2 Microarray Processing and Quality Analysis ... 50
2.3.3 Microarray Validation by qPCR ... 56
2.3.4 Microarray Data Analysis ... 59
2.3.4.1 Raw Data Analysis- Grouped Patient Data ... 61
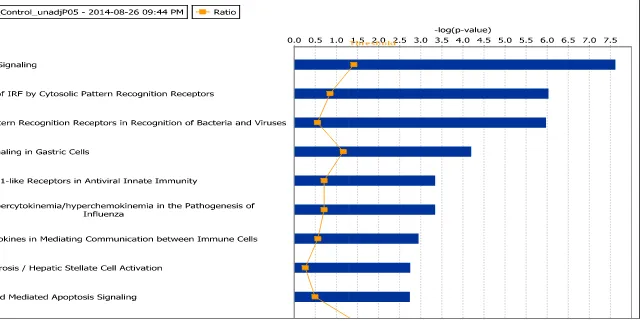
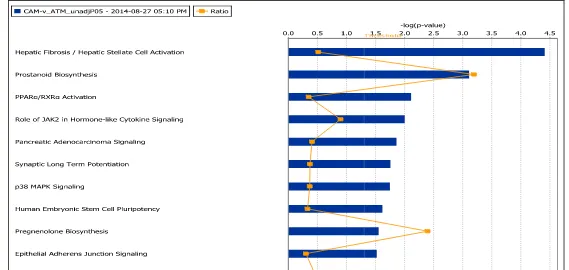
2.3.4.2 Pathway analysis ... 67
2.3.4.3 Network Analysis ... 76
2.3.4.4 Transcription Factor Analysis ... 81
2.3.4.5 Gene Set Enrichment Analysis ... 86
2.3.4.5 GeneVestigator ... 91
2.3.5 Raw Data Analysis Of Single Patient Data ... 92
2.3.5.1. Transcription Factor Analysis of Single Patient Data ... 94
2.3.5 Phenotypic Effects of CAM conditioned media on AGS cells ... 96
2.4 Discussion ... 99
Chapter Three ... 105
Metabolic Reprogramming in the Gastric Cancer Microenvironment ... 105
3.0 Introduction ...106
3.1 Aims and Hypotheses ...108
3.2 Chapter Specific Materials and Methods. ...109
3.2.1 XF-Extracellular Flux Analyser ... 109
3.2.1.1 Myofibroblast Cells ... 109
3.2.1.2 AGS Cancer Cells ... 109
3.2.2 Mitotracker® Staining ... 110
3.2.3 Immunofluorescence for GLUT1 Transporter Channel ... 110
3.2.4 Real Time PCR for CAM Conditioning Experiments ... 110
3.2.5 Western Blotting for CAM, NTM and AGS Conditioning Experiments ... 111
3.3 Results ...112
3.3.1 Comparison of mitochondrial activity in CAMs, NTMs and AGS gastric cancer cells ... 112
ix
3.3.4 Analysis of glycolytic capacity and oxygen consumption in AGS cells
following exposure to CAM conditioned media ... 129
3.3.5 Comparison of mitochondria activity of primary gastric CAM and NTM cells ... 133
3.3.4 Comparing inherent glycolytic capacity and oxygen consumption rate of gastric CAMs and NTMs ... 135
3.4 Discussion ...137
Chapter Four ... 145
Metabolic Reprogramming of ... 145
Normal Tissue Myofibroblasts ... 145
4.0 Introduction ...146
4.1 Aims and Hypothesis ...149
4.2 Chapter Specific Materials and Methods ...150
4.2.1 Proliferation and Migration Assays ... 150
4.2.2 Transwell Co-Cultures ... 150
4.3 Results ...151
4.3.1 Phenotypic Effects of NTM conditioned media on AGS cells ... 151
4.3.2 Validation of Microarray Targets in AGS cells co-cultured with NTM cell lines by qPCR ... 154
4.3.3 Short Term NTM conditioning of AGS cells induced changes in AGS related gene expression profiles and protein expression ... 156
4.3.4 Long Term AGS cells conditioning induced changes in NTM related gene expression profiles ... 159
4.3.5 Long Term AGS cells conditioning induced changes in NTM related protein expression profiles ... 162
4.3.6 NTM induced changes in AGS Cell Protein Expression ... 164
4.4 Discussion ...167
Chapter V ... 172
Discussion ... 172
5.0 Discussion ...173
5.1 Summary and Conclusions ... 173
5.2 Bioinformatic Analysis of Co-Culture Data ... 173
5.3 Metabolic Signatures in CAM cells ... 174
x
5.5 Future work and the potential for therapeutic intervention ... 176
5.6 Concluding Remarks ... 178
Chapter VI ... 180
Materials and Methods ... 180
6.1 Materials ...181
6.1.1 Reagents and Materials ... 181
6.1.2 Solutions and Equipment ... 183
6.2 Methods ...186
6.2.1 Primary Myofibroblast Cell Extraction (Varro Laboratory) ... 186
6.2.2 Myofibroblast Cell Line Generation and Culture ... 189
6.2.3 AGS Cell Culture ... 189
6.2.4 Generation of Conditioned Media ... 190
6.2.5 AGS Cell Conditioning for Microarray Analysis (Varro Laboratory) ... 190
6.2.6 RNA Extractions, Gene Microarray and Normalisation (Varro Laboratory in Collaboration with Dr Jithesh Puthen, Liverpool University Statistician) ... 190
6.2.7 Differentially regulated oligonucleotide lists ... 192
6.2.8 MetacoreTM ... 192
6.2.9 Ingenuity ... 193
6.2.10 Genevestigator ... 193
6.2.11 Mitotracker Staining ... 194
6.2.12 Preparation of Cell Dishes with Cell-Tak ... 194
6.2.13 XF Extracellular Flux Analyser ... 194
6.2.14 DNA Normalisation ... 196
6.2.15 Cell Fixation for IF Using Paraformaldehyde ... 196
6.2.16 Cell Imaging and Analysis ... 197
6.2.17 RNA Extraction for Real Time PCR ... 197
6.2.18 EdU Proliferation Assay for Flow Cytometry ... 199
6.2.19 EdU Proliferation Assay for Immunoflurescence ... 200
6.2.20 Preparation of Cell Lysates ... 201
6.2.21 Western Blotting ... 201
6.2.22 Boydon Chamber Migration Assays ... 202
6.2.23 Gene Set Enrichment Analysis and array quality metrics report (Dr Helen Jones, Manchester University)... 203
6.2.24 Statistical Methods and Analysis ... 203
xi List of Tables
TABLE 1.PRIMARY MYOFIBROBLAST CELL-LINES USED IN AGS CONDITIONING MICROARRAY STUDIES. ... 47
TABLE 2.TOP RANKING DIFFERENTIALLY UP-REGULATED SIGNIFICANT GENES IN CAM VS CONTROL AGS CONDITIONING DATA SET.DATA WAS RANKED BY FOLD CHANGE. ... 63
TABLE 3.TOP RANKING DIFFERENTIALLY DOWN-REGULATED SIGNIFICANT GENES IN CAM
VS CONTROL AGS CONDITIONING DATA SET. DATA WAS RANKED BY FOLD CHANGE. ... 63
TABLE 4.TOP RANKING DIFFERENTIALLY UP AND DOWN-REGULATED SIGNIFICANT GENES IN ATM VS CONTROL
AGS CONDITIONING DATA SET.DATA WAS RANKED BY FOLD CHANGE. ... 65
TABLE 5.TOP RANKING DIFFERENTIALLY UP AND DOWN-REGULATED SIGNIFICANT GENES IN CAM VS ATMAGS CONDITIONING DATA SET.DATA WAS RANKED BY FOLD CHANGE. ... 66
TABLE 6.RANKED CANONICAL PATHWAYS FROM INGENUITY PATHWAY ANALYSIS OF CAM VS CONTROL AGS TREATED MICROARRAY DATA (P<0.05, FC >-1.6,>1.6). ... 69
TABLE 7.RANKED CANONICAL PATHWAYS FROM INGENUITY PATHWAY ANALYSIS OF ATM VS CONTROL AGS TREATED MICROARRAY DATA (P<0.05, FC >-1.6,>1.6). ... 72
TABLE 8.DATA TO SHOW RANKED CANONICAL PATHWAYS FROM INGENUITY NETWORK ANALYSIS ON CAM VS
ATMAGS TREATED MICROARRAY DATA SET (P<0.05, FC >-1.6,>1.6). ... 75
TABLE 9.TABLE TO SHOW RANKED NETWORKS FROM INGENUITY NETWORK ANALYSIS ON CAM VS CONTROL
AGS TREATED MICROARRAY DATA SET (P<0.05, FC >-1.6,>1.6).INGENUITY NETWORK REPORTS OF ALL THE DIFFERENTIALLY REGULATED NETWORKS WITHIN THE DATASET WERE GENERATED. THESE WERE THEN RANKED ACCORDING TO SIGNIFICANCE WITH 1 BEING MOST SIGNIFICANT NETWORK AND 13 LEAST SIGNIFICANT NETWORK. ... 77
TABLE 10.TABLE TO SHOW RANKED NETWORKS FROM INGENUITY NETWORK ANALYSIS ON
ATM VS CONTROL AGS TREATED MICROARRAY DATA SET (P<0.05, FC >-1.6,>1.6). INGENUITY NETWORK REPORTS OF ALL THE DIFFERENTIALLY REGULATED NETWORKS WITHIN
THE DATASET WERE GENERATED. THESE WERE THEN RANKED ACCORDING TO SIGNIFICANCE WITH 1 BEING MOST SIGNIFICANT NETWORK AND 8 LEAST SIGNIFICANT NETWORK. ... 79
TABLE 11.TABLE TO SHOW RANKED NETWORKS FROM INGENUITY NETWORK ANALYSIS ON
CAM VS ATMAGS TREATED MICROARRAY DATA SET (P<0.05, FC >-1.6,>1.6).
INGENUITY NETWORK REPORTS OF ALL THE DIFFERENTIALLY REGULATED NETWORKS WITHIN THE DATASET WERE GENERATED. THESE WERE THEN RANKED ACCORDING TO SIGNIFICANCE
WITH 1 BEING MOST SIGNIFICANT NETWORK AND 9 LEAST SIGNIFICANT NETWORK. ... 80
TABLE 12.SIGNIFICANT ‘HUB’ TRANSCRIPTION FACTORS THAT CONTROL DOWNSTREAM DIFFERENTIALLY REGULATED EFFECTOR GENES WITHIN CAM VS CONTROL AGS CONDITIONED DATA SET. ... 84
xii
TABLE 14.TABLE TO SHOW RANKED NETWORKS FROM GENE SET ENRICHMENT ANALYSIS ON CAM VS CONTROL
AGS TREATED MICROARRAY DATA SET. ... 88
TABLE 15.TABLE TO SHOW RANKED NETWORKS FROM GENE SET ENRICHMENT ANALYSIS ON ATM VS CONTROL AGS TREATED MICROARRAY DATA SET. ... 89
TABLE 16.TABLE TO SHOW RANKED NETWORKS FROM GENE SET ENRICHMENT ANALYSIS ON CAM VS ATM AGS TREATED MICROARRAY DATA SET. ... 90
TABLE 17.DATA TO SHOW TOP HITS FOR UP-REGULATED AND DOWN-REGULATED GENES FOR SINGLE PATIENT AGS CONDITIONING DATA WITH CAM MEDIA. ... 93
TABLE 18.DATA TO SHOW TOP HITS FOR UP-REGULATED AND DOWN-REGULATED TRANSCRIPTION FACTORS FOR SINGLE PATIENT AGS CONDITIONING DATA WITH CAM MEDIA. ... 95
TABLE 19.PATHWAYS IDENTIFIED IN CAM VS NTM MYOFIBROBLAST ANALYSIS. ... 103
TABLE 20. ANTIBODIES AND DILUTIONS USED IN THE WORK PRESENTED IN THIS THESIS. ... 183
TABLE 21.EQUIPMENT USED TO CARRY OUT THE WORK PRESENTED IN THIS THESIS. ... 184
TABLE 22.BUFFERS USED TO CARRY OUT THE WORK PRESENTED IN THIS THESIS ... 185
TABLE 23.TABLE DETAILING FULL LIST AND LABELLING OF PRIMARY PATIENT MYOFIBROBLASTS WITH PASSAGE NUMBER AND SAMPLE TYPE ... 187
TABLE 24.PATIENT INFORMATION RELATING TO THE SCORING DETAILS .ROW DISPLAYING THE TOTAL REPRESENTS THE PROGNOSIS SCORE AND IS CALCULATED BASED ON THE SUM OF ALL THE VARIABLES.IF THE VALUE IS LEFT BLANK THE PATIENT IS NOT DECEASED. ... 188
TABLE 25.TABLE DETAILING FULL LIST AND LABELLING OF ASG MICROARRAY DATA GENERATED FROM CONDITIONING WITH PRIMARY PATIENT MYOFIBROBLASTS MEDIA.TABLE HIGHLIGHTS CELLS PASSAGE NUMBER AND SAMPLE TYPE. ... 192
xiii List of Figures
FIGURE 1.1.SCHEMATIC ADAPTED FROM CORREA AND PLAZUELO (2012). ... 22
FIGURE 1.2.SCHEMATIC SHOWING CELLULAR CROSS-TALK IN THE TUMOUR MICROENVIRONMENT. ... 31
FIGURE 1.3.SCHEMATIC TO ILLUSTRATE THE WARBURG TYPE EFFECT. ... 39
FIGURE 1.4.SCHEMATIC TO ILLUSTRATE A REVERSE WARBURG TYPE EFFECT. ... 41
FIGURE 2.1CELLS OF THE STROMA. ... 44
FIGURE 2.2CHARACTERISATION OF MYOFIBROBLAST CELL TYPES. ... 49
FIGURE 2.3.CHARACTERISATION OF MYOFIBROBLAST CELL TYPES... 51
FIGURE 2.4DENSITY ESTIMATES (SMOOTHED HISTOGRAMS) OF AGS CONDITIONED MICROARRAY DATA. ... 52
FIGURE 2.8.RELATIVE LEVELS OF RNA DEGRADATION ACROSS ALL MICROARRAY SAMPLES. ... 56
FIGURE 2.9. QPCR VALIDATION OF MICROARRAY GENE TARGETS FROM AGS TREATED WITH MEDIA FROM 294, 305 AND 190CAM. ... 58
FIGURE 2.14.SCHEMATIC TO SHOW TRANSCRIPTIONAL REGULATION IN CANONICAL PATHWAYS. ... 81
FIGURE 2.26.SCHEMATIC REPRESENTING PREDICTIVE MODEL OF PARACRINE COMMUNICATION BETWEEN MYOFIBROBLAST CELLS AND AGS EPITHELIAL GASTRIC CANCER. ... 104
FIGURE 3.1.OXYGEN CONSUMPTION RATE OF AGS,CAM AND NTM CELLS. ... 114
FIGURE 3.2.MITOCHONDRIAL INTENSITY OF AGS,CAM AND NTM CELLS. ... 115
FIGURE 3.3.MITOCHONDRIAL INTENSITY OF AGS CELLS AND A PANEL OF PRIMARY NTM AND CAM CELL-LINES. ... 117
FIGURE 3.4.RELATIVE GLUT1 GENE EXPRESSION LEVELS IN 14 GASTRIC CAM CELL-LINES. ... 119
FIGURE 3.5.GLUT1 EXPRESSION IN CAMS AND NTMS. ... 121
FIGURE 3.6.RELATIVE MCT4 GENE EXPRESSION LEVELS IN 14 GASTRIC CAM CELL-LINES. ... 122
FIGURE 3.7.RELATIVE LEVELS OF MCT4 EXPRESSION IN CAM AND NTM CELLS. ... 124
FIGURE 3. 8. RELATIVE CHANGES IN LEVELS OF MCT1 GENE EXPRESSION FOLLOWING EXPOSURE TO OF AGS CELLS TO CAM CONDITIONED MEDIA. ... 127
FIGURE 3.9.RELATIVE INDUCTION OF MCT1 PROTEIN EXPRESSION LEVELS IN AGS CELLS FOLLOWING EXPOSURE TO CAM CONDITIONED MEDIA. ... 128
FIGURE 3.10.OXYGEN CONSUMPTION RATE OF AGS CELLS TREATED WITH CONTROL OR CAM CONDITIONED MEDIA. ... 130
FIGURE 3.11.OXYGEN CONSUMPTION RATE OF AGS CELLS. ... 132
FIGURE 3.12.ANALYSIS OF RELATIVE LEVELS OF MITOCHONDRIAL ACTIVITY IN PRIMARY GASTRIC NTM OR CAM CELLS... 134
FIGURE 3.13.GLYCOLYTIC CAPACITY OF CAMS AND NTM CELLS. ... 136
xiv
FIGURE 4.2.PRINCIPAL COMPONENT ANALYSIS OF ALL CAM(RED),ATM(BLUE) AND NTM(GREEN) PATIENT SAMPLES. ... 151
FIGURE 4.3.EDU PROLIFERATION AND BOYDON CHAMBER MIGRATION ASSAYS REPRESENTING
NTM-CONDITIONING EFFECTS ON AGS CELLS. ... 153
FIGURE 4.4. QPCR TO DETERMINE NTM-CONDITIONING EFFECTS ON AGS CELLS. ... 155
FIGURE 4.5. QPCR SHOWS NTM-CONDITIONING EFFECTS ON AGS CELLS. ... 155
FIGURE 4.6.RELATIVE CHANGES IN LEVELS OF MCT1 GENE EXPRESSION FOLLOWING EXPOSURE TO OF AGS
CELLS TO NTM CONDITIONED MEDIA. ... 157
FIGURE 4.7.WESTERN BLOT TO SHOW MCT1 AND CD147 PROTEIN LEVELS FOLLOWING EXPOSURE OF AGS CELLS TO NTM CONDITIONED MEDIA. ... 158
FIGURE 4.8.RELATIVE CHANGES IN LEVELS OF GLUT1 GENE EXPRESSION FOLLOWING CO-CULTURE OF AGS CELLS WITH NTM CELLS. ... 161
FIGURE 4.9.WESTERN BLOT TO SHOW COMPARISON OF CAM AND NTM CELLS AFTER CO-CULTURE. ... 163
FIGURE 4.10.COMPARATIVE LEVELS OF MCT1 AND CD147 EXPRESSION IN AGS CELLS CULTURED IN THE PRESENCE OR ABSENCE OF CAM OR NTM CELLS. ... 166
xv Appendices
List of supplementary files provided on CD:
Supplementary file I:
Gene Set Enrichment Analysis, 2.0 GeneVestigator Figures, 2.1, 2.2 and 2.3 Canonical Pathway Analysis, 2.4
Supplementary File II:
16
Chapter I
17
1.0Overview
The most fundamental property of living cell systems is the ability to consume and transform energy, a process termed “metabolism” originating from the Greek word “metabolismos,” meaning, “to change.” Cellular metabolism consists of many individual chemical reactions, which occur throughout metabolic pathways. These pathways exist in a delicate balance between anabolic (energy consuming) or catabolic (energy producing). Metabolic processes and pathways in cancer cells have been a subject of much interest since the observations of Otto Warburg and his contemporaries in the early 20th century (Warburg et al., 1927 and Warburg 1956). Despite almost ninety
years of research on this subject, there are still many unanswered questions regarding the role of metabolic change in cancers.
18 1.1 Gastric Cancer: An Overview
Cancers are a large family of multifactorial diseases, characterised by abnormal cell growth and often the ability to metastasise and spread to other parts of the body. There are many factors that contribute to the development and progression of cancer, including: genetics, environmental stress, diet and lifestyle choices. The progression of normal cells, which form a mass, to malignant cancer cells, is primarily due to accumulation of molecular changes in cells as a result of exposure to these genetic or environmental factors. There are two key papers by Hannahan and Weinburg, which have since become the sine qua non for cancer biologists. The ‘Hallmarks of Cancer’ were first published in 2000 and covered the main cellular capabilities that cells require when evolving from healthy cells to malignant tumours. More recently an updated and revised version of the paper was published, ‘Hallmarks of Cancer: the Next Generation’ (Hannahan and Weinburg., 2011) which reviewed the evidence supporting the importance of the tumour microenvironment and energy metabolism in the process of carcinogenesis. The relationship between tumour cells and the tumour microenvironment is closely linked to that of energy metabolism, however there is much conflict in the literature regarding the fundamentals of this relationship, this present thesis attempts to address these issues in using a gastric cancer model and primary gastric stromal cells.
19
therapeutics, treatment of gastric cancer remains problematic and the prognosis for most patients remains poor.
As with most cancers, early detection of gastric cancer correlates with good long-term survival rates for patients (Hohenberger et al., 2009), however, due to non-specific symptoms and lack of routine screening, early diagnosis is rare and only 1 in 5 people survive the disease for five years or more after diagnosis (Cancer Research UK, 2014).
Late diagnosis inevitably results in patients requiring post or peri operative chemotherapy, or radiotherapy in combination with surgery, depending upon the localisation and spread of the tumour (Meyer and Wilke 2011). Unfortunately, for patients who present with advanced tumours, especially with spread to the lymph nodes and metastasis, there are limited treatment options available. Current strategies for treatment include using combinations of chemotherapy agents, mainly platinum and fluoropyrimidine based compounds, such as 5-fluorouracil (5-FU) and doxorubicin (Cunningham et al., 2008, Tetzlaff et al., 2008, and Van Cutsem et al., 2009). Advances in identification of stage and sub-group specific biomarkers, will improve therapeutic prescription of drugs to patients most likely to show responses, thereby limiting unnecessary treatment or suffering in inappropriate patient cohorts.
20
chemotherapeutic agents in patients overexpressing HER2 using trastuzumab is a current treatment strategy in both gastric and breast carcinomas (Jørgensen 2010 and Bose et al., 2013). With the use of these chemotherapeutic agents for palliative treatment of gastric cancer resulting in median survival times of only 9 to 11 months, increasing t0 14 months in HER2 expressing patients treated with trastuzumab (Van Cutsem et al., 2009) and the problem of resistance to chemotherapy, there is a substantial need to establish new and improved therapeutic strategies.
1.2 Epidemiology of Gastric Cancer
Histologically, there are two distinct variants of gastric carcinoma which have been identified: diffuse-type gastric cancer, sometimes known as signet ring carcinoma (Otsuji 1998 and Li et al., 2007) which comprises of individual neoplastic cells that are infiltrating into the stomach wall tissue, but do not form glandular structures (Zhang et al., 2010 and Kim et al., 2004) and intestinal-type adenocarcinomas, which advance through a series of histological stages (gastric atrophy, followed by intestinal metaplasia, which in turn may lead to dysplasia) (Ming 1977, Dicken et al., 2005 and Wroblewski et al.,2010). There have been various classifications of gastric cancer over the years but the Lauren classification, first introduced in 1965 is the most common and widely used today. This classification system is able to histologically distinguish, between gastric adenocarcinomas of diffuse origin (DGCA) and gastric adenocarcinomas intestinal (IGCA) subtypes (Vauhkonen
et al., 2006). The primary prognostic factors in gastric carcinoma are the size
21
(Meyer and Wilke 2011, Takahashi et al., 2013 and Tetzlaff et al., 2008). There are two main tumor sites of gastric adenocarcinoma, and these are classed as proximal and distal (Crew and Neugut, 2006). The majority of stomach cancers are attributed to environmental factors such as Helicobacter pylori (H. Pylori), gastritis, and lifestyle factors such as diet and smoking (Forman and Burley 2006 and Correa 2013). Indeed, occurrence of gastric cancer varies significantly between populations, with the highest number of cases occurring in East Asia (Leung et al., 2008), indicating that both environmental and genetic factors may contribute to occurrence and progression of the disease. Other factors contributing to the progression of gastric cancer include over production of the gastric antral hormone, gastrin, which has been shown to alter a ranger of cellular processes including proliferation, apoptosis, migration and tissue remodelling (Burkitt et al., 2009 and Dockray 2004).
1.2.1 Helicobactor pylori
H. pylori isa class I carcinogen, itwas first isolated in 1982, during a study of
100 patients, all of which were undergoing gastroscopies (Warren and Marshall, 1984). The bacterial strain was identified in all patients presenting with gastric ulcers, chronic gastritis and intestinal ulcer; ultimately leading to the general use of antibiotics as a treatment for gastric ulcers (Warren and Marshall, 1984). Since the discovery of H. pylori, the bacterium has become the focus of countless gastric studies and is now known to be one of the most common infections in humans (Cave, 1997, Fuccio et al., 2007 and Uemura et
22
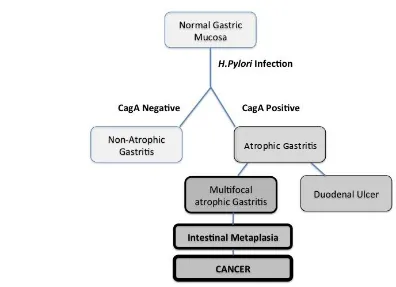
positive strains are known to be potentially carcinogenic, as this strain is known to be associated with peptic ulceration with different strains of
H.pylori being associated with different clinical outcomes [figure 1.1].
[image:22.595.96.492.224.511.2]Atrophic Gastri s
Figure 1. 1. Schematic adapted from Correa and Plazuelo (2012).
Clinical outcomes of infection with CagA positive and negative H.Pylori infections.
1.2.2 Diet and Gastric Cancer
23
food may also be linked to increased risk, as frying or grilling foods produce greater quantities of heterocyclic amines (Jedrychowski et al., 1993, Liu et al., 2009 and Correa 1992). Equally, high dietary salt intake is also reported to be associated with a greater risk, as it may be linked to intestinal metaplasia and also could potentially increase the risk of infection with H.pylori (Correa 1992 and Tsugane et al.,1994).
1.2.3 Genetics and Gastric Cancer
Gastric cancer is a multifactorial disease, characterised by abnormal cell proliferation and the ability to metastasise to other tissues of the body. There are well-documented genetic changes in gastric cancer including up-regulation of NET1 (Bennett et al., 2011), which is associated with increased proliferation, and invasion of gastric cells into the surrounding stroma. HERG was also identified as being involved in the progression of gastric cancer (Shao et al., 2008), as it was found to be exclusively expressed in gastric cancer cells, it was also proposed to be a potential therapeutic target (Shao et al.,2008).
24
opportunities for identification of better prognostic biomarkers and new methods of therapeutic intervention
1.3 Targeting the Gastric Microenvironment
Understanding the complex relationship between different cells within the tumour stroma is vital in understanding the true mechanism of tumour development and drug resistance. As such, this is now an area of considerable interest for both patient stratification, and the identification of new targets for pharmacological inhibition. Indeed, many pharmaceutical companies and academic laboratories are focusing research on the development of new ways to inhibit tumour- associated stromal cells. Examples of these developments include; re-educating immune cells of the microenvironment through targets such as general control non-derepressible 2 (GCN2) (Yu et al., 2007 and Ye et
al., 2010), targeting tumour associated macrophages (Mantovani et al., 2006)
and also blocking the paracrine communication between myofibroblast cells and cancer cells through mechanisms such the wnt signalling pathway (Liu et
al., 2013 and Yauch et al., 2008). Despite these recent developments, there is
still much we do not know about cells of the tumour stroma or reciprocal mechanisms of communication within the cancer microenvironment.
1.4 Cells of the Gastric Stroma and The Tumour Microenvironment
25
immune cells. The cancer microenvironment contains a dynamic mixture of these non-cancerous cells, both in and around the developing tumour, these stromal cells can transform to aid and support cancer cell growth (Albini and Sporn, 2007).
1.4.1 Fibroblast Cells
Fibroblast cells function as a part of normal connective tissue. They have a distinct morphology, with elongated cell bodies and extended cellular processes. They are slow dividing cells with reduced motility and whilst structurally similar to myofibroblast cells, they do not express -SMA (Grotendorst et al., 2004). During normal wound healing, they migrate to the site of injury, where they establish a collagen rich extra-cellular matrix (ECM) (Gabbiani et al., 1971).
The literature often refers to myofibroblast cells as ‘fibroblast’ cells however it is important to note the distinction between the two cell subtypes. Fibroblast cells are a pre-cursor to myofibroblast cells (or ‘active’ fibroblasts) differentiating into myofibroblast cells upon exposure to inflammatory or oncogenic signalling (Tomasek et al., 2002).
1.4.2 Mesenchymel Stem Cells
26
markers (Lee et al., 2013). Literature on the role of MSCs is conflicting with reports showing they have the potential to exhibit both positive and negative effects on tumour growth (Martin et al., 2010, Prockop and Youn., 2012, Al Jumah and Abumaree., 2012 and Anton et al., 2012). However, as they are thought to home to the site of developing tumours there is significant interest in the use of programmed MSCs to inhibit tumour development.
1.4.3 Myofibroblast Cells
1.4.3.1 The Origin of The Myofibroblast Cell
During the late 1970s, extensive studies were performed into the composition of granulation tissue, leading to the identification of myofibroblasts which were found to be fundamental to the process of wound healing (Gabbiani et al., 1971,). After further investigation it became apparent that myofibroblasts not only play a key role in wound healing, but also within the stroma of some neoplasms (Sobral et al., 2011, Tsujino et al., 2007 and Ishii et al., 2003). Despite the cells morphology, immunohistochemistry (Shimasaki et al., 2007) and biochemistry being more fully elucidated following their discovery, there is still much that is unclear about these cells.
27
transforming to active myofibroblasts, which express smooth muscle actin fibres (Micallef et al., 2012). It is known that urokinase plasminogen activator receptor (uPAR), which is an extracellular protease system involved in cell migration, the modelling of the extracellular matrix and growth factor activation is present on the surface of fibroblasts (Bernstein et al., 2007). This receptor is reported to regulate cell transition from fibroblasts to myofibroblasts. Studies show that down-regulation of uPAR is necessary for the differentiation of fibroblasts into active myofibroblasts. Thus, loss of uPAR can be used as a marker for some myofibroblast populations (Bernstein et al., 2007).
As the origin of tissue myofibroblasts appears to be heterogeneous, it is highly likely that not all myofibroblast cells will display identical properties (Chauhan et al., 2003). There is further evidence to suggest that other cells can become “active” and display myofibroblast-like characteristics these include pericytes, MSCs (Kosinski et al., 2010) and fibrocytes (Mitcallef et al., 2012). Also, it is possible that the origin of myofibroblasts may depend on the site of damage; for example, in pathological situations within the liver, myofibroblast-like cells expressing -SMA are thought to be derived from both hepatic stellate cells and local liver fibroblasts (Yin et al., 2013).
1.4.3.2 Identifying Myofibroblast Cells
28
smooth muscle cells in the expression of actin microfilament bundles. This is why the most common myofibroblast marker is alpha-smooth muscle actin (α -SMA) (Hinz et al., 2003 and Hinz et al., 2001). Although both myofibroblasts and smooth muscle cell types express smooth muscle actin at high levels, these cells have distinctive morphologies and gene expression profiles (Gan et al., 2007). Significantly, the functional properties of myofibroblasts vary according to the initial cause or process of activation, such as tissue inflammation or proximity to a developing tumour.
In light of these observations it is clear that myofibroblasts do not have simple unifying properties, their functional profiles and degree of activity is clearly influenced by the form and extent of niche-specific paracrine conditioning. As such, the mechanism and consequences of myofibroblast conditioning must be carefully defined in different tumours, at different stages of development and different tissue locations in order to define tumour specific signatures and unify mechanisms of cancer reprogramming.
1.4.3.3Myofibroblasts in Cancer
The role of myofibroblasts in cancer is currently inconclusive but presence of
29
tumour progression and metastasis (Barron et al., 2012, Giannoni et al., 2013, Shaw et al., 2009,Giannoni et al., 2010). Studies have been carried out to elucidate the mechanisms behind the relationship between the stromal cells and prostate cancer progression. A study by Shaw et al (2009) examines the role of paracrine signalling between the tumour and it’s microenvironment via the sonic hedgehog pathway. Another, more recent study found that preventing differentiation of prostate myofibroblast cells by using DHA, reduced epithelial to mesenchymel transition and tumour invasion (Bianchini
et al., 2012). These studies indicate that the ability to influence myofibroblast
function may provide an effective means of indirectly regulating the proliferation and migration of the cancer cells.
Studies in breast cancer again indicate that the presence of myofibroblasts often correlates with increased invasiveness and poor prognosis (Surowiak et al., 2006 and Yamashita et al., 2012). One study by (Yazhou et al., 2004) showed that loss of Hematopoietic progenitor cell antigen CD34 expression and increased expression of -SMA was associated with carcinomas and not with normal breast tissue containing CD34 expressing fibroblast cells. CD34 is linked to stem cell phenotypes and is associated with Another study by Surowiak et al (2006), reported a consistent positive correlation between the prevalence of myofibroblasts in the tumour stroma and expression of a
marker of proliferation (Ki67) and the proto-oncogene HER-2 in breast cancer
30
conflicting evidence to the role of myofibroblast cells in lung cancer, as Matsubara et al (2009) reported that sub-epithelial myofibroblasts identified by -SMA expression in lung adenocarcinoma was a histological indicator of excellent prognosis in the patients they tested (Matsubara et al., 2009). These varying reports on the role of myofibroblasts in cancer progression need to be further elucidated for a greater range of tumour types.
1.4.3.4 Myofibroblasts in gastric cancer
The role of the myofibroblast cell in gastric cancer is not very well documented; studies in scirrhous gastric cancer patients show that an increase in myofibroblast cells is correlated with a worse prognosis (Fuyuhiro
et al., 2011). Also studies in mouse models of gastric cancer have shown that
tumour associated myofibroblasts express VEGFA which contributes to the promotion of angiogenesis (Guo et al., 2008). Work carried out in the laboratory of Professor A. Varro showed that gastric cancer associated myofibroblasts (CAMs) caused increased cancer cell migration and proliferation when compared to adjacent tissue myofibroblasts (ATMs) and normal tissue myofibroblasts (NTMs) (Holmberg et al., 2012). Also a comparative proteomic analysis of myofibroblast secretomes revealed a decrease in extracellular matrix adaptor protein like transforming growth factor-induced gene-h3 (TGFβig-h3)in the CAM secretome. This decrease was correlated with lymph node metastasis, worse prognosis and shorter patient survival (Holmberg et al., 2012). It is therefore vital to further elucidate the role of the gastric CAMs in cancer progression and patient prognosis.
31
1.5 Signalling in the Gastric Cancer Environment
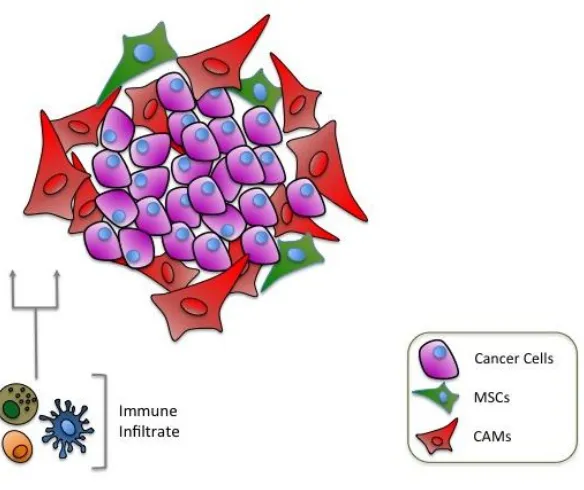
Complex methods of cross-talk have been identified between cancer cells and cells in the tumour microenvironment, [figure 1.2]. Whilst the process itself is well documented, the molecular mechanisms that control these processes are not fully understood, and may vary according to the type of malignancy, the stage of tumour development and the dynamic composition of the surrounding tissue.
Figure 1. 2. Schematic showing cellular cross-talk in the tumour microenvironment.
[image:31.595.106.398.365.610.2]32
Research in breast cancer models suggest that metastasis and chemo-resistance are driven by molecular changes in both tumour cells and the surrounding stroma, (Acharyya et al., 2012), with up-regulation of TNF- in stromal cells conferring chemo-resistance in the cancer cells (Acharyya et al., 2012). Cancer associated fibroblasts (CAFs) via TGF-beta signalling have shown to confer a more aggressive and metastatic phenotype due to induction of epithelial to mesenchmel transition in breast cancer cells (Yu et al., 2014). Up regulation of growth factors secreted by stromal cells (Turner et al., 2010), deregulation of endothelin-1 (Hinsley et al., 2012) and changes in hedgehog ligand and Wnt signalling (Yauch et al., 2008) are all examples of paracrine communication which enhance tumourigenesis. The dependency of cancer cells on the tumour microenvironment is well established, however, the molecular process that facilitates functional reprogramming in cancer or stromal cells has yet to be defined. In particular, which processes are transient reversible responses to external factors, or the consequences of longer term epigenetic programming, remain important unanswered questions.
1.5.1 Transcription Factors
Transcription factors are proteins that bind to specific DNA sequences in the promoter regions of target genes, thereby driving gene expression. Transcription factors are known to be key factors in cancer initiation and
progression (Darnell 2002, Thorne et al., 2009 and Libermann 2006). For
example, up-regulation of STAT-3 has a key role in many cancers including;
metastasis in prostate cancer (Abdulghani et al., 2008), drug resistance in
33
cancers (Burke et al., 2001). Also, up-regulation of the SP family of
transcription factors has been implicated in tumour development (Kong et al.,
2010 and Chuang et al., 2009), as they are reported to have a role in cell-cycle
progression and cell differentiation. In addition, acting in conjunction with
Akt they also play an important role in regulating tumour cell metabolism,
(Archer 2009).
More recently, the differential regulation of transcription factors in cancer
stromal cells has also become an area of increased interest. Indeed, there is a
growing body of evidence to show that regulation of transcription networks in
stromal cells directly leads to the proliferation and migration of cancer cells
(Hatiboglu et al., 2011 and Kim et al., 2011). In particular, the role of NRF2
and NF-κB in hypoxia and the microenvironment is a vital process in the
development and progression of tumour cells (Satoh et al., 2002).
Dysregulation of transcription factors is thought to be a key factor in the
instigation and development of gastric tumours, based on studies performed
in gastric cell lines (Kang et al., 2011, Almedia et al., 2003, and Huang et al.,
2011), however currently there are no reports regarding the effects of
paracrine communication on transcriptional regulation in the gastric cancer
microenvironment. Transcriptional analysis of co-culture, or conditioned
media microarray studies from tumour – stroma interactions would provide
deeper insight and understanding behind the molecular mechanisms driving
34
1.5.2 Epithelial to Mesenchymal Transition
Epithelial to mesenchymal transition (EMT) is the process whereby epithelial cells lose their polarity and convert to a migratory mesenchymal phenotype (Jiang et al., 2011). EMT is critical for appropriate embryonic development, it also occurs during fibrosis, wound healing, tissue regeneration, organ fibrosis, cancer progression and metastasis, as well as diseases of chronic inflammation such as inflammatory bowel disease (Powell et al., 2011). Cancer cells utilise EMT to facilitate invasion of cells into surrounding tissues, crossing endothelial barriers and entering circulation; thus enabling metastasis to other organs in the body (Jiang et al., 2011). There is much evidence supporting the concept of hypoxia-associated factors inducing EMT through transcriptional regulation (Kang and Massagué.. 2004). It has been established that the most common and important inducers of EMT are transcription factors that suppress E-cadherin expression, such as TWIST and SNAIL (Kang and Massagué., 2004). There have also been reports that EMT is induced by inflammatory chemokines and cytokines (Shirakihara et al., 2011). TGF-β has been shown to have both pro and anti-tumour effects. It is associated in EMT in late-stage tumours, by enhancing production of growth factors that encourage migration and production of matrix molecules (Heldin
et al., 2012). TGF-β has also been shown to alter normal epithelial cells in the
35
in human HCT116 cells, showing to promote invasion and metastasis of colorectal cancer cells (Wang et al., 2013).
1.5.4 Hypoxia
Hypoxia results when regions of the body are deprived of oxygen. It is well established that hypoxia is a critical factor in the regulation of wound healing, due to increasing blood supply to the damaged area, restoring homeostasis to the site of injury (Trabold et al., 2003). One of the many ways that cells adapt to a shortage of oxygen is production of angiogenic factors (Rofstad and Danielsen 1999, Shweiki et al., 1992 and Tamura et al., 2009), in order to increase local blood supply. Despite hypoxia being important in wound healing (Oberringer et al., 2008), in carcinogenesis, sustained hypoxia can have severe implications on both the metabolism and migratory abilities of cells. Indeed, hypoxia plays a critical role in tumour development and progression (Tamura et al., 2009, Hong et al., 2005 and Lee 2009). The effects of hypoxia are mediated by a number of signalling molecules, such as the family of hypoxia inducible factors (HIFs) and their downstream effectors (Papandreou et al., 2006 and Du et al., 2011). Transcription factor, nuclear factor-erythroid 2 (NRF2) is also a key component in the cellular response to oxidative stress, and is linked to increased levels of angiogenic factors and HIF1- expression (Kim et al., 2011). Blocking NRF2 was shown to supress tumour angiogenesis in colon cancer through inhibiting HIF1- (Kim et al., 2011).
36
which is the beta subunit HIF- (Ke and Costa 2006). In normoxia HIF is usually down-regulated by the ubiquitin-proteosome pathway, however in hypoxic conditions, degradation of HIF is prevented by prolyl-hydroxylases that act to stablise the -subunit of HIF1-, enabling it to translocate to the nucleus and form a heterodimer with HIF- (Jiang et al,, 2010). When in the nucleus, HIF drives expression of a multitude of genes relating to cell survival and hypoxia, enabling the cell to adapt to a lack of oxygen, by switching metabolism to glycolysis from mitochondrial respiration (Lu et al., 2002). In solid tumours it is well established that there are many regions of hypoxia due to the rapid growth of cancer cells, and poor vasculature. There have been various studies that show activation of HIF leads to increased cancer cell invasion (Koh et al., 2011, Manalo et al., 2005, Branco-Price et al., 2012, Li et al., 2009, Semenza 2011 and Maxwell 2005). HIF expression is strongly associated with the regulation of angiogenic factors such as vascular endothelial growth factors (VEGF) (Cao et al., 2009, Pugh and Ratcliff 2003 and Park et al., 2007). Indeed, loss of HIF-1 expression was linked to profound inhibition of blood vessel growth in solid tumours, due to decreased VEGF expression (Tang et al., 2004). Up–regulation of hypoxia-associated factors has also been linked to enhanced EMT (Misra et al., 2012) and there is a strong link between Akt mediated signal transduction (Elstrom et al.,2004) active HIF-1, and expression of enzymes involved in glycolysis (Koukourakis
et al.,2006). Breast cancer models have shown that hypoxia can induce a
37
metabolic transporter channels has also been linked with hypoxia, as HIF1-
induces up regulation of the monocarboxylate transporter 4 (MCT4), which facilitates the increased lactic acid produced during hypoxia to be promptly removed from the cell (Ullah et al., 2006).
1.5.5 Cytokines
Cytokines are small soluble secreted proteins that act as messengers between cells, especially cells of the immune system (Borish and Steinke, 2003). They can be released into the circulation to act on cellular receptors to initiate a downstream response cascade (Jiang et al,. 2013). The role of cytokines in cancer is varied, and depending on the cells of the tumor microenvironment, cytokines can initiate either a pro-tumour (Jiang et al,. 2013) or anti-tumour response (Banchereau et al., 2012). Indeed TGF- is well documented to have an ambiguous role in cancer progression as it has been shown to display both tumour-suppressing and -enhancing effects (Buck et al., 2006 and Ranganathan et al., 2007).
38
(Ashizawa et al., 2005). The immune system is known to play a key role in detecting and destroying cancer cells in the body. Indeed, immunotherapy is
showing great promise for treatment of several forms of cancer (Mellman et
al., 2011, Palucka and Banchereau, 2012 and Lesterhuis et al., 2011).
However, the adaptability of cancer cells means that in some cases tumours
evolve to overcome detection by the immune system. Tumour cells can
down-regulate expression of self-antigens and can produce specific cytokines and
chemokines which act to desensitise immune cells causing immune cell anergy
(Ben-Baruch et al., 2006 and Stewart and Smyth, 2011).
1.6 .Metabolism and Cancer
The word ‘metabolism’ is derived from the Greek word “Metabolismos” and means “to change”. In the early 20th century, Otto Warburg pioneered studies in respiration and metabolism, particularly in relation to cancer cell metabolism (Warburg et al., 1924 and Warburg 1956). Hans Kreb worked as research assistant to Warburg, and later in his career pioneered work, in the field of metabolism, which lead to the discovery of the fundamentals in cellular metabolic processes; the urea cycle and the citric acid cycle (Krebs, 1937, Krebs et al., 1938 and Krebs 1938). These key discoveries form the basis and understanding of most cellular metabolic processes today.
1.6.1 The Warburg Effect
39
normal tissues, a phenomenon termed the Warburg effect (Warburg et al.,
1927). Since this discovery there have been numerous studies acknowledging the switch of cancer cells to a more glycolytic phenotype (Schulze et al., 2011, Salminen et al., 2010 and Cai et al., 2010). However, what causes alterations in these metabolic processes in cancers is still relatively unknown. Indeed, changes in cancer cell metabolism have been linked to changes in the expression of oncogenes (Muñoz-Pinedo et al., 2012), disruption of circadian rhythm (Sahar et al., 2009) and also loss of tumour suppressor function (Lyssiotis et al., 2012).
Figure 1. 3. Schematic to illustrate the Warburg type effect.
40
The question of why cancer cells would switch to glycolysis, a less efficient way of energy production, is something which has puzzled many scientists. Warburg postulated that the switch to glycolysis was due to defective mitochondrial function in these cells (Warburg et al., 1927). More recently these metabolic changes have been further elucidated and in some cancer models it is reported that cells still maintain mitochondrial function but preferentially utilise glycolysis for ATP production (Futin et al., 2006 and Koppenol et al., 2011) however the reasons for this still remain unclear.
1.6.2 The Reverse Warburg Effect
41
Figure 1. 4. Schematic to illustrate a reverse Warburg type effect.
Cancer cells utilise high energy metabolites for oxidative phosphorylation which have been received from stromal cells, using glycolysis for respiration.
42 1.8 Hypotheses, Aims and Objectives
The primary purpose of this work was to characterise functional changes induced by communication between gastric myofibroblasts and AGS gastric cancer cells.
To address this issue we aimed:
1. To test the hypothesis that there would be differences in AGS cell gene expression profiles after conditioning with CAM or ATM media compared to control media.
2. To establish the inherent and reciprocally induced metabolic profiles of gastric cancer epithelial cells and primary gastric cancer associated myofibroblasts
43
Chapter II
44 2.0 Introduction
Historically, a selection of primary myofibroblast cell lines were isolated from a cohort of 12 patients with gastric cancer or 8 tissue donors with no history of gastric cancer (Varro laboratory). These cell lines included Cancer Associated Myofibroblasts (CAMs), isolated from tissue immediately juxtaposed to gastric tumours and matched tissue Adjacent Tissue Myofibroblasts (ATMs), myofibroblasts isolated from tissue neighbouring the site of gastric tumours [figure 2.1]. In contrast, primary myofibroblasts isolated from patients with no history of cancer are defined as Normal Tissue Myofibroblasts (NTMs).
Figure 2. 1 Cells of the stroma.
45
Previous analysis of gene expression profiles of all patient primary gastric myofibroblast cell-lines showed that each form of myofibroblast (CAM, ATM and NTM) has distinct and characteristic global gene expression profiles (Jones et al., unpublished data). In addition, statistical correlation analysis enabled CAMs derived from early and late stage tumours to be correctly clustered into prognostic groups based on trends in gene expression profiles.
46 2.1 Aims and Hypotheses
This chapter describes the analysis and interpretation of data from a series of conditioning microarray experiments, which were originally performed in the laboratory of Professor Andrea Varro, the collaborating laboratory in this study. The primary purpose of this chapter was to establish trends in gene expression profiles between AGS cells conditioned with primary gastric myofibroblast cell media. We wanted to test the hypotheses that trends in AGS gene expression profiles would vary between CAMs and ATM conditioning versus controls.
The aims this chapter were:
1. To confirm that the cells used in these studies retain previously defined markers and functional characteristics of CAM, ATM and NTM cells
2. To establish the quality of available microarray data and to assess cell-type specific trends in global gene expression profiles
3. To validate primary microarray data by targeted qPCR analysis 4. To confirm that gene expression profiles observed in primary
microarray data are retained in primary myofibroblasts used in subsequent functional studies.
47
2.2 Chapter Specific Materials and Methods
Full details of materials and methods can be found in chapter VI.
2.2.1 Microarray Sample Selection and Data Processing
All microarray studies were performed on low passage (P4-P10) myofibroblast cell-lines [table 1]. In all conditioning experiments, the effects of AGS conditioned media were compared to corresponding molecular signatures and functional phenotypes observed in non-conditioned serum-free media. Details of patient data are shown in table 1.
Label Sample Sample Type Array Sample Name
190 CAM Sz190/1 P4 Cancer AV 55. CEL
190 ATM Sz190/2 P4 Adjacent AV 56. CEL
192 CAM Sz192/1 P5 Cancer AV 82. CEL
192 ATM Sz192/2 P5 Adjacent AV 83. CEL
294 CAM Sz294/1 P4 Cancer AV 59. CEL
294 ATM Sz294/2 P5 Adjacent 1 AV 60. CEL
305 CAM Sz305/1 P5 Cancer AV 84. CEL
305 ATM Sz305/22 P5 Adjacent 1 AV 86. CEL
308 CAM Sz308/1 P5 Cancer AV 87. CEL
308 ATM Sz308/22 P6 Adjacent AV 88. CEL
CONTROL N/A N/A AV 58. CEL
CONTROL N/A N/A AV 57. CEL
CONTROL N/A N/A AV 94. CEL
Table 1. Primary myofibroblast cell-lines used in AGS conditioning microarray studies.
48
2.2.2 qPCR for Real Time Evaluation of Microarray Data
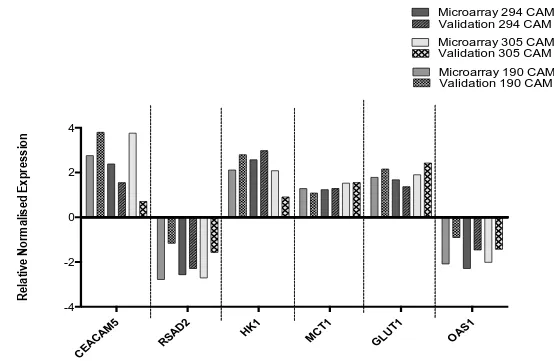
Primary CAM myofibroblast cell-lines 190, 294 and 305 were selected for qPCR validation of induced gene expression profiles, as these represent different survival/prognosis patient subgroups, identified by previous informatics analysis of unconditioned CAM gene expression profiles (Jones et
al., unpublished data). Gene specific qPCR primers were designed for
differentially regulated gene changes within each microarray data set.
2.2.3 Proliferation and Migration Assays
49 2.3 Results
2.3.1 Characterisation of primary myofibroblast cell lines
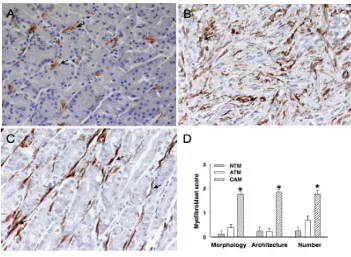
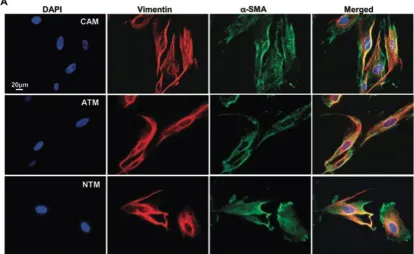
[image:49.595.115.466.432.689.2]To confirm the cells were myofibroblast cell lines, cell phenotype, morphology, quantity and abundance were determined by the Varro Laboratory (Holmberg et al., 2012) [figure 2.2]. To confirm isolated primary CAMs, ATMs and NTMs retained their characteristic morphology and function, each cell line was stained to confirm the presence of a spindle or stellate morphology and expression of the two canonical myofibroblast markers, vimentin and α-SMA (Holmberg et al. 2012) [Figure 2.3]. Collated data from these experiments confirms that when RNA was prepared from primary gastric myofibroblasts for microarray analysis, cell lines maintained all of the hallmarks that have been used to define this cell type in other tissues.
Figure 2. 2 Characterisation of myofibroblast cell types.
50
2.3.2 Microarray Processing and Quality Analysis
The primary purpose of the microarray analysis was to allow for a data driven, exploratory approach, to identify potential candidates of interest for follow up analysis. In order to progress with the microarray data experiments, a series of quality control and normalisation steps were carried out. Firstly, the RNA extracted from AGS conditioned cells, passed quality (RQI) and purity thresholds and could therefore be used in subsequent microarray experiments (Varro Laboratory).
[image:50.595.99.513.118.372.2]
Affymetrix array chips allowed for normalisation locally, as each gene is Figure 2. 3. Characterisation of myofibroblast cell types.
51
matched to 11 pairs of probes, which are evenly distributed throughout the chip to detect any noise within the genechip (as well as gene expression). Each chip also contains probes which measure non-specific binding of cRNA which also eliminates non-specific signals and enables the data to be normalised effectively. To ensure quality control between the 12 arrays, there is also a selection of normalisation probes on the gene chip, which have constant levels of expression, these are used to normalise signals across the multiple arrays.
52
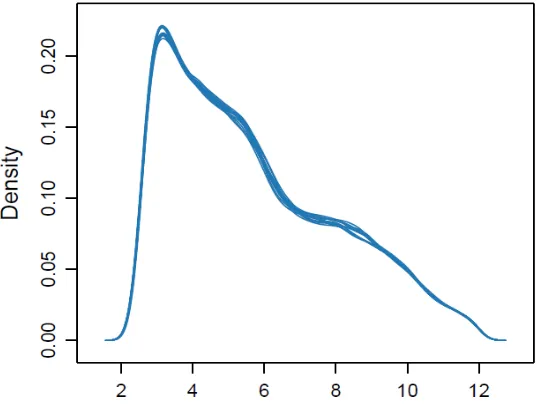
Figure 2. 4 Density estimates (smoothed histograms) of AGS conditioned microarray data.
Each array is indicated by a single blue line showing the density distributions between data from individual microarrays were found to be highly comparable.
[image:52.595.119.389.89.295.2]53
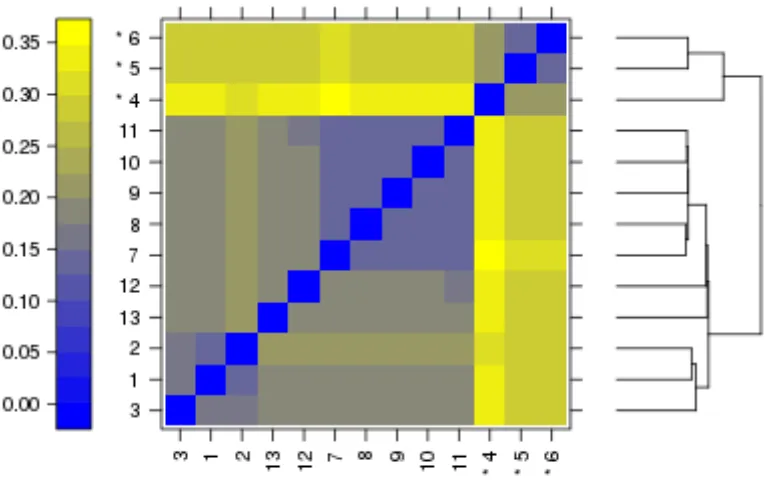
Figure 2. 5. False colour heat-map of arrays.
The plot shows variation between data from individual arrays by clustering of related trends. Outliers in this analysis are indicated by the asterisk (*).
54
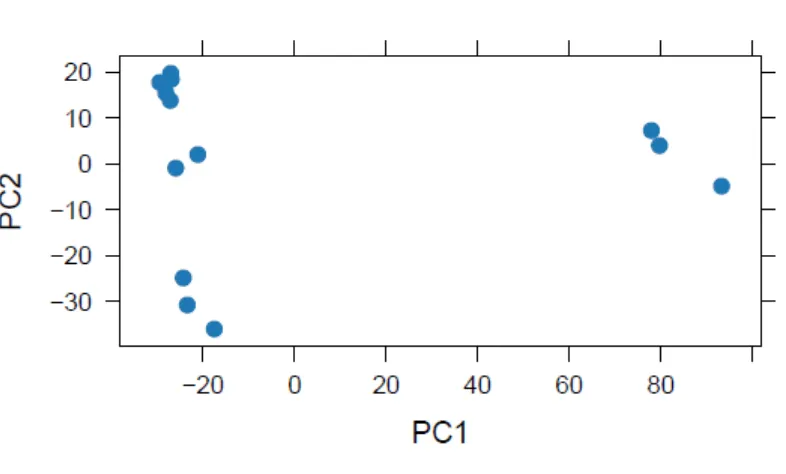
Figure 2. 6 Principle component analysis of microarray data.
The array quality metrics report plotted the PCA showing the global gene expression of the arrays both before batch correction.
55
Figure 2. 7 Principle component analysis of global gene expression profiles of AGS conditioning microarray data using PARTEK©.
After RMA normalisation and batch correction data was plotted and global gene expression analysed by principle component analysis.
56
can be confident that RNA the quality of RNA is consistent across all samples used in these studies.
Figure 2. 5. Relative levels of RNA degradation across all microarray samples.
All values were calculated from the pre-processed data after background correction and quantile normalisation. Each array is represented by a single line.
2.3.3 Microarray Validation by qPCR
57
58
CEAC
AM5
RSAD
2
HK1 MCT1
GLUT 1 OAS1 -4 -2 0 2 4
Microarray 190 CAM Validation 190 CAM Microarray 294 CAM Validation 294 CAM
Microarray 305 CAM Validation 305 CAM
[image:58.842.134.688.88.449.2]R el at iv e N or m al is ed E xp re ss io n
Figure 2. 6. qPCR validation of microarray gene targets from AGS treated with media from 294, 305 and 190 CAM.
59 2.3.4 Microarray Data Analysis
60
Figure 2. 10. Schematic showing sequential stages of microarray data analysis.
61
2.3.4.1 Raw Data Analysis- Grouped Patient Data
In order to investigate the hypothesis further, to determine if there were any differences in AGS gene expression following conditioning with primary myofibroblast cell media, raw gene-expression data analysis of microarray data was carried out. This analysis ranked genes according to fold change and p-value significance from the gene lists generated after initial processing (work carried out in Partek, by Dr Jithesh Puthen). As previously stated, the work in this chapter was hypothesis generating, and used to investigate any potential trends within the data, therefore a p-value cut off of less than 0.5 was applied to filter the data, and a fold change cut off of 1.6 was used as an arbitrary cut off for on all data sets. Three gene lists were generated for further analysis: (1) AGS conditioned with CAM media vs control media; (2) AGS conditioned with ATM media vs control and (3) AGS conditioned with CAM media vs ATM media. Both CAM vs control and ATM vs control datasets had 200 genes, which significantly changed within the dataset after applying stringent cut offs (p<0.05, fc>1,6,<-1.6) compared to only 73 in the CAM vs ATM comparison. This result suggests that CAMs and ATMs have the ability to induced similar changes in AGS gene expression profiles.
62
63
Symbol Entrez Gene Name p-value Fold Change Location Type(s) IGFBP5 insulin-like growth factor binding protein 5 2.11E-08 4.803 Extracellular Space other
CEACAM5 carcinoembryonic antigen-related cell adhesion molecule 5 3.37E-04 2.758 Plasma Membrane other
PGBD1 piggyBac transposable element derived 1 7.62E-04 2.612 Extracellular Space enzyme
PRSS1 protease, serine, 1 (trypsin 1) 8.76E-04 2.435 Other peptidase
CFI complement factor I 4.70E-05 2.33 Extracellular Space peptidase
COQ3 coenzyme Q3 methyltransferase 1.52E-02 2.32 Cytoplasm enzyme
CYP1A1 cytochrome P450, family 1, subfamily A, polypeptide 1 3.52E-06 2.205 Cytoplasm enzyme
AGK acylglycerol kinase 1.40E-03 2.187 Cytoplasm kinase
MDP1 magnesium-dependent phosphatase 1 3.07E-03 2.124 Other phosphatase
HK1 hexokinase 1 2.07E-05 2.114 Cytoplasm kinase
Table 2. Top ranking differentially up-regulated significant genes in CAM vs Control AGS conditioning data set. Data was
ranked by fold change.
Symbol Entrez Gene Name p-value Fold Change Location Type(s) IFNL2 interferon, lambda 2 1.14E-02 -2.451 Extracellular Space other
OAS2 2'-5'-oligoadenylate synthetase 2, 69/71kDa 1.60E-07 -2.464 Cytoplasm enzyme
USP18 ubiquitin specific peptidase 18 1.38E-04 -2.465 Cytoplasm peptidase
IFIT3 interferon-induced protein with tetratricopeptide repeats 3
1.59E-10 -2.506 Cytoplasm other
IFI44L interferon-induced protein 44-like 5.84E-05 -2.587 Other other
PMCH pro-melanin-concentrating hormone 8.15E-04 -3.01 Extracellular Space other
RSAD2 radical S-adenosyl methionine domain containing 2 2.01E-07 -3.128 Cytoplasm enzyme
ZNF114 zinc finger protein 114 3.43E-02 -3.267 Cytoplasm other
MX2 myxovirus (influenza virus) resistance 2 (mouse) 2.28E-07 -3.488 Nucleus enzyme
Table 3. Top ranking differentially down-regulated significant genes in CAM vs Control AGS conditioning data set. Data
64
65
Symbol Entrez Gene Name p-value Fold Change Location Type(s) IGFBP5 insulin-like growth factor binding protein 5 1.29 E-08 5.213 Extracellular Space other
CEACAM5 carcinoembryonic antigen-related cell adhesion molecule 5
2.59E-04 2.858 Plasma Membrane other
PRSS1 protease, serine, 1 (trypsin 1) 6.27E-04 2.540 Other peptidase
HEG1 Heart development protein 7.25E-03 2.373 Plasma other
COQ3 coenzyme Q3 methyltransferase 2.65E-02 2.113 Cytoplasm enzyme
RSAD2 radical S-adenosyl methionine domain containing 2 4.67E-08 -3.778 Cytoplasm enzyme
OAS2 2'-5'-oligoadenylate synthetase 2, 69/71kDa 3.94E-09 -3.764 Cytoplasm enzyme
MX2 myxovirus (influenza virus) resistance 2 (mouse) 2.28E-07 -3.488 Nucleus enzyme
IFIT3 interferon-induced protein with tetratricopeptide repeats 3
1.59E-10 -2.506 Cytoplasm other
PMCH pro-melanin-concentrating hormone 8.15E-04 -3.01 Extracellular Space other
Table 4. Top ranking differentially up and down-regulated significant genes in ATM vs control AGS conditioning data set.
66
Table 5. Top ranking differentially up and down-regulated significant genes in CAM vs ATM AGS conditioning data set.
Data was ranked by fold change.
Symbol Entrez Gene Name p-value Fold Change Location Type(s) PPP1R14A protein phosphatase 1, regulatory (inhibitor) subunit 14A 0.024 5.57 Cytoplasm phosphatase
TGFB2 transforming growth factor, beta 2 0.025 5.33 Extracellular Space growth factor
RGS5 regulator of G-protein signaling 5 0.042 4.94 Plasma Membrane other
NDNF neuron-derived neurotrophic factor 0.013 4.38 Extracellular Space other
DAAM2 dishevelled associated activator of morphogenesis 2 0.014 4.13 Other other
PRSS3 protease, serine, 3 0.033 -3.93 Extracellular Space peptidase
HPSE heparanase 0.041 -3.96 Plasma Membrane enzyme
SDK1 sidekick cell adhesion molecule 1 0.047 -4.06 Plasma Membrane other
STEAP1B STEAP family member 1B 0.041 -4.39 Other other