Do Different Types of Dynamic Extrapolation Rely on the
Same Mechanism?
Alexis David James Makin and Marco Bertamini
University of LiverpoolObservers can estimate the position of occluded moving objects, and this ability could be mediated by the oculomotor control system. However, other forms of motion cannot be tracked with pursuit eye movements. In Experiment 1, 2 kinds of motion extrapolation tasks were interleaved. In the Position extrapolation trials, participants observed a moving target that became occluded. They attempted to press a button when it arrived at the end of the occluder. In novel Accumulation extrapolation trials, they observed a matrix of Gabors with new elements appearing over time. The participants pressed when Gabors would have filled the entire matrix, had they continued accumulating at the same rate. In both tasks completion time estimates were related to presentation parameters in the same way. Moreover, there were robust intertask correlations: Participants who responded earlier in the position task also responded earlier in the accumulation task. Experiment 2 replicated these results with a third form of extrapolation. Although performance was not identical in all tasks, there were enough similarities to suggest that overlapping systems guide all forms of extrapolation. We propose that a common rate control mechanism guides extrapolation, like the velocity store in oculomotor control, but with a broader function than previously envisaged.
Keywords: motion extrapolation, feature motion, velocity, prediction motion, time-to-contact
Supplemental materials:http://dx.doi.org/10.1037/a0036680.supp
Humans live in a dynamic environment, where moving objects are often temporarily occluded behind other things. It is sometimes necessary to estimate the exact position of occluded objects, and this ability has been studied with laboratory-based motion extrap-olation tasks (also known as prediction motion tasks, Tresilian,
1995). In a typical experiment, participants observe a single
mov-ing target travel at constant velocity across the fronto-parallel plane, before disappearing behind an occluder. They then press a button when the occluded target would reach a particular location (Battaglini, Campana, & Casco, 2013;Benguigui, Broderick, & Ripoll, 2004;DeLucia, Tresilian, & Meyer, 2000;Gilden, Blake, & Hurst, 1995;Gray & Thornton, 2001;Huber & Krist, 2004; Makin, Poliakoff, Chen, & Stewart, 2008; Makin, Stewart, & Poliakoff, 2009;Peterken, Brown, & Bowman, 1991;Rosenbaum,
1975). How do people respond at the approximately right time on
motion extrapolation tasks? There are two broad possibilities,
termed cognitive clocking and cognitive tracking byDeLucia and
Liddell (1998). According to the clocking hypothesis, people ob-tain a time-to-contact (TTC) representation at the onset of
occlu-sion, then mentally count down this duration before initiating a
response (Tresilian, 1995). The alternative tracking hypothesis is
that people track the moving target with a spotlight of spatial attention or with eye movements. They continue tracking as accu-rately as possible across the occluder, and then respond when
attention or gaze arrives at the goal.DeLucia and Liddell (1998)
presented evidence in favor of cognitive tracking.
Makin and Poliakoff (2011) further developed the tracking model of motion extrapolation, elaborating on the role of smooth pursuit eye movements. A great deal is known about smooth pursuit, and this can be used to help understand motion
extrapo-lation in more detail.Barnes (2008)surmises that representations
of target velocity can be held in working memory for many seconds after targets disappear, and that stored velocity
informa-tion can be used to guide anticipatory smooth pursuit (e.g.Barnes
& Asselman, 1991;Poliakoff, Collins, & Barnes, 2005) or
approx-imate tracking across occlusion periods (e.g.,Bennett & Barnes,
2006).Makin and Poliakoff (2011)argued that velocity memory controls tracking in motion extrapolation tasks, and that people simply respond when gaze reaches the end of the occluder.
What if participants are required to fixate? Now, participants might track the occluded target with covert attention, while keep-ing the eyes still. Covert trackkeep-ing is likely to be mediated by velocity memory and premotor components of the smooth pursuit system, with eye movements inhibited at a relatively late stage (an
idea inspired by the influential premotor theory of attention,
Riz-zolatti, Riggio, Dascola, & Umilta, 1987). In summary,Makin and Poliakoff (2011) concluded that the smooth pursuit system is perfectly suited to guide responses on motion extrapolation tasks, even during fixation, and that the only remaining issue is about This article was published Online First May 19, 2014.
Alexis David James Makin and Marco Bertamini, Department of Psy-chological Sciences, University of Liverpool, Liverpool, United Kingdom. A Leverhulme Trust Early Career Fellowship awarded to Alexis Makin sponsored this work.
Correspondence concerning this article should be addressed to Alexis David James Makin, Department of Psychological Sciences, Eleanor Rath-bone Building, University of Liverpool, Liverpool L69 7ZA, United King-dom. E-mail:[email protected]
This
document
is
copyrighted
by
the
American
Psychological
Association
or
one
of
its
allied
publishers.
This
article
is
intended
solely
for
the
personal
use
of
the
individual
user
and
is
not
to
be
disseminated
broadly.
causal role of mental imagery, which may accompany tracking
(e.g., Huber & Krist, 2004; Jonikaitis, Deubel, & de’Sperati,
2009).
Novel Kinds of Extrapolation
Object position is only one thing that can change over time. For example, a colored patched could smoothly change from red to green at a constant rate. If the presentation is suddenly occluded, participants could extrapolate color change through color space. Although perception of motion through feature space has been
explored (Blaser, Pylyshyn, & Holcombe, 2000;Blaser &
Sper-ling, 2008; Howard & Holcombe, 2008; Sheth, Nijhawan, & Shimojo, 2000), extrapolation through feature space has not been widely considered.
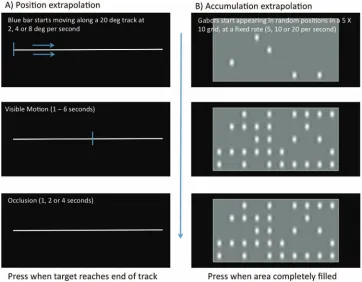
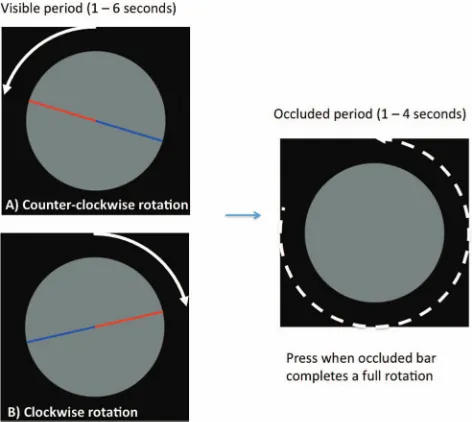
In Experiment 1 we contrasted a standard Position extrapolation task (Figure 1A), where the target moves through physical space, with an equivalent task with motion through feature space, which
we call the Accumulation extrapolation task (Figure 1B). On each
trial of the accumulation task, an empty region began filling with small Gabors at a constant rate. This dynamic accumulation then stopped, but participants imagined the Gabors continuing to fill the matrix, then pressed a button at the exact time they thought it would be completely full. The eye movement inspired models of extrapolation cannot explain performance in this task, because the smooth pursuit system cannot track this kind of accumulation.
There are important differences between position and accumu-lation tasks. First, there is a major difference in the velocity signals available before occlusion. Elementary motion detectors code
tar-get velocity (e.g.,Burr & Thompson, 2011), and if smooth pursuit
is allowed, extraretinal velocity signals are also available (e.g., Barnes, 2008). However, neither mechanism would code lation velocity. Consider two subsequent iterations of the accumu-lation display: The onset of a new Gabor could produce apparent motion. However, the distance between Gabors was different across iterations, while the temporal frequency of onsets was uniform. Therefore, speed and direction signals would always change unpredictably between iterations. Consequently the motion signals available on a single iteration are not sufficient to judge higher-order accumulation velocity over an extended period, and must undergo further integration. Importantly, accumulation can-not be tracked with smooth pursuit, so extraretinal velocity signals would not be available either. In short, radically different motion signals arise from accumulation, and the smooth pursuit system is not tuned to these signals.
[image:2.594.116.478.382.664.2]Second, consider the occlusion period. The Position extrapola-tion task is thought to involve memory guided tracking across the occluder, but how is “occluded” accumulation processed? Perhaps spatial attention scans all the remaining, unfilled locations until they have all been covered, then the button press is initiated? However, this is far more demanding than Position extrapolation,
Figure 1. Position and Accumulation extrapolation tasks. (A) Position extrapolation task. (B) Accumulation extrapolation task. In both extrapolation tasks, the dynamic presentation disappears, and participants estimate the time it would have reached completion (either the blue bar reaches the end of the track, or all spaces taken by Gabors). The occlusion durations were matched in both tasks. White notes in each panel describe parameters. The color version of this figure appears in the online article only.
This
document
is
copyrighted
by
the
American
Psychological
Association
or
one
of
its
allied
publishers.
This
article
is
intended
solely
for
the
personal
use
of
the
individual
user
and
is
not
to
be
disseminated
because it requires memory for which occluded locations have already been scanned. Moreover, it is impossible to execute a sequence of saccades to all the unfilled locations at sufficiently high frequency. Again, we see that the known components of the smooth pursuit system, which seem well suited to guiding judg-ments on Position extrapolation task, cannot guide judgjudg-ments on the Accumulation extrapolation task.
If the smooth pursuit-inspired model described byMakin and
Poliakoff (2011)does not work for Accumulation extrapolation, what about mental imagery? It is possible that participants could mentally simulate imaginary Gabors filling up all the remaining spaces, and then press the button when the imaginary filling in process is complete. However, it would still be necessary for mental imagery to be updated at the appropriate rate across the occlusion period so that the button press can be executed at the right time. It is possible that a common rate control system under-pins mental updating, and possibly mental imagery, on both tasks. This common rate control system would necessarily have a broader function than the velocity store described in smooth
pursuit-based models of extrapolation (Makin & Poliakoff, 2011).
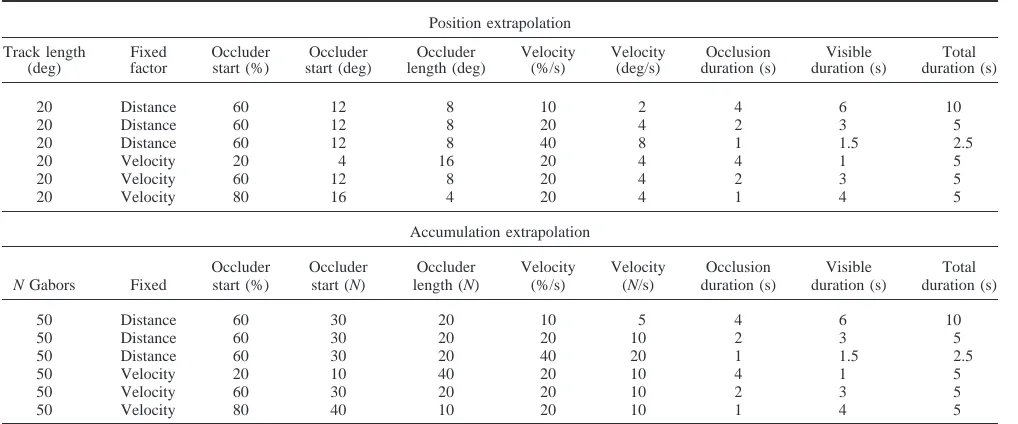
In Experiment 1 participants were instructed to press a button when the occluded process was complete: that is, either the blue line reached the end of the track in the Position extrapolation task, or the region was filled with Gabors in the accumulation task (see Figure 1). We measured completion time estimates (CTEs) in both tasks for different occlusion durations, distances, and velocities (see Table 1). Experiment 1 distinguishes between two distinct hypotheses: (a) Both position and accumulation tasks are guided by a common rate control system. According to this common rate control hypothesis (CRC) performance should be similar on both tasks; (b) Alternatively, the Position extrapolation task could be mediated by the smooth pursuit system, and the accumulation task could recruit a different rate control system altogether. According to this separate rate control hypothesis (SRC), performance should be different on each task.
How can we distinguish between CRC and SRC accounts? If performance on the position and accumulation tasks were identi-cal, we could choose CRC with some confidence. Alternatively, if performance were very different on both tasks, we might go for SRC. But how similar does performance need to be for CRC, and how different for SRC? It is difficult to define a principled “per-formance similarity criterion” to adjudicate between the competing accounts.
Fortunately, we can obtain performance metrics that directly index the functioning of the rate controller, and focus our analysis on these metrics. We exploited the fact that CTEs increase linearly
with occlusion duration (Benguigui et al., 2004;Tresilian, 1995).
This allowed us to separately measure the slope and intercept of this relationship. Importantly, slope differences imply that updat-ing is runnupdat-ing faster for one kind of extrapolation task that another, so the difference in CTEs keeps growing with occlusion duration. In other words, any differences in rate control between the position and accumulation tasks should multiply with occlusion duration
(for similar analysis, seeWearden, Edwards, Fakhri, & Percival,
1998). Unlike slope differences, intercept differences reflect some
general bias that is not directly related to the functioning of the rate controller(s). Differences in intercept values between position and accumulation tasks can still occur even if the tasks use the same rate controller.
We also considered that the rate controller is imperfect, and cannot produce exactly the same CTE on two identical trials. We could thus measure the standard deviation of CTEs across the repeats of a condition (a metric termed “variable error,” abbrevi-ated VE). VE also increases linearly with occlusion duration, and again we obtain the slope and intercept of this function. The CRC predicts that VE will increase with occlusion duration in the same way in both tasks because the same, imprecise rate controller guides updating. Conversely, the SRC predicts that these slopes will be different in each task because one rate controller may be
[image:3.594.47.556.509.721.2]more precise than another (seeBuhusi & Meck, 2005;van Rijn,
Table 1
Trial Parameters in Experiment 1
Position extrapolation
Track length (deg)
Fixed factor
Occluder start (%)
Occluder start (deg)
Occluder length (deg)
Velocity (%/s)
Velocity (deg/s)
Occlusion duration (s)
Visible duration (s)
Total duration (s)
20 Distance 60 12 8 10 2 4 6 10
20 Distance 60 12 8 20 4 2 3 5
20 Distance 60 12 8 40 8 1 1.5 2.5
20 Velocity 20 4 16 20 4 4 1 5
20 Velocity 60 12 8 20 4 2 3 5
20 Velocity 80 16 4 20 4 1 4 5
Accumulation extrapolation
N Gabors Fixed
Occluder start (%)
Occluder start (N)
Occluder length (N)
Velocity (%/s)
Velocity (N/s)
Occlusion duration (s)
Visible duration (s)
Total duration (s)
50 Distance 60 30 20 10 5 4 6 10
50 Distance 60 30 20 20 10 2 3 5
50 Distance 60 30 20 40 20 1 1.5 2.5
50 Velocity 20 10 40 20 10 4 1 5
50 Velocity 60 30 20 20 10 2 3 5
50 Velocity 80 40 10 20 10 1 4 5
This
document
is
copyrighted
by
the
American
Psychological
Association
or
one
of
its
allied
publishers.
This
article
is
intended
solely
for
the
personal
use
of
the
individual
user
and
is
not
to
be
disseminated
Gu, & Meck, 2014; Wing, 2002, for reviews of the cognitive timing literature, where analysis of scalar variability is routine).
Finally, the competing CRC and SRC accounts make other predictions. According to CRC, stimulus parameters—such as velocity, distance, and occlusion duration—should have the same effect on performance in both tasks. CRC also predicts that per-formance should be correlated, so a person who responds earlier in one task will also do so in the other. We tested these predictions as well, while acknowledging that this evidence alone may not be strong enough to support CRC or SRC.
Experiment 1
Method
Participants. Twenty-four participants were involved (aged 18 to 34, two left-handed, 11 male). Participants were awarded £10 or course credit. All participants had normal or corrected to normal vision. All experiments reported here had local ethics committee approval and was carried out in accordance with the 2008 decla-ration of Helsinki.
Apparatus. Stimuli were presented on a 1024⫻1280 Apple CRT monitor, updating at 60 Hz. Experiments were controlled
with Python and open source PsychoPy software (Peirce, 2007).
Head position was stabilized with a chin rest 57 cm from the screen.
Stimulus and design.
Position extrapolation task. The Position extrapolation task is
shown in Figure 1A. On all trials, a vertical blue target moved
horizontally leftward or rightward along a 20° track, centered on the participant’s midline. Before motion began, a 200 ms audio cue sounded. Then the blue target was seen in its starting position on the left or right of the track for 500 ms, before moving at a constant velocity. The target disappeared at an unpredictable point, which marked occlusion onset. Participants were instructed to assume hidden movement until the target reached the to the end of the track, and then press the space bar. After the participant’s CTE was recorded, there was a 300 ms pause while the track was still visible.
Although many studies have used approach motion where the
target moves toward the observer (seeSchiff & Detwiler, 1979, for
an early example), we chose lateral motion because we were interested in contrasting an extrapolation task where the dynamic stimuli can be tracked with pursuit eye movements against one where it cannot. Approach motion is an intermediate case, where some forms of ocular tracking may play a role, but not necessarily smooth pursuit.
Most analyses were conducted on a subset of experimental trials where stimulus parameters were tightly controlled. These are
shown in Table 1. On these trials, there were three occlusion
durations: 1 s, 2 s, and 4 s. These durations were produced in different ways— determined by the fact it is impossible to vary duration without covarying distance or velocity. In the fixed dis-tance trials, Occlusion always began at 12° (or 60% of the track). Occlusion duration was produced by setting target velocity at 2, 4, or 8 °/s (or 10%, 20%, or 40% of the track per second). Con-versely, on the fixed velocity trials, target velocity was always 4 °/s (or 20% of track per second), and occlusion began at 4°, 12°, or
16° (20%, 60%, or 80% of the track).Figure 3Aand B show the
fixed distance and fixed velocity trials graphically. There were 10 repeats of each condition. There were an equal number of leftward and rightward moving targets in each condition. As well as the 60 experimental trials, we included 36 filler trials, where velocity was chosen at random (min 2 °/s, max 8 °/s) and occlusion distance was chosen at random (min 4° deg, max 16° deg). The filler trials prevented participants from overlearning the occlusion parameters in the experimental trials.
Accumulation extrapolation task. The accumulation task is
illustrated inFigure 1B. As with the Position extrapolation task,
trials began with a 200 ms audio cue followed by a 500 ms static period before accumulation began. During this period the partici-pants viewed an empty background area which could be filled with
50 individual ⬃1⫻ 1° Gabors, arranged in a 5° by 10° array.
When the dynamic presentation started, Gabors filled the empty spaces in the array at a certain accumulation velocity. At an unpredictable point, Gabors stopped appearing (analogous to oc-clusion), but participants pressed the space bar at the time the matrix would be full, if the accumulation process had continued at the same rate.
The Gabors were produced from a 1 cycle-per-degree sine wave grating, which was then two-dimensional (2D)
Gaussian-modulated with an SD of 0.5 (Figure 1B). The Gabors accumulated
on a midgray background so the luminance of the display did not change dramatically during the trial.
Critically, the accumulation velocity and occlusion parameters were matched with the Position extrapolation task. Although ac-cumulation speed cannot be coded in degrees of visual angle per second, we matched velocity in terms of the proportion of the trial completed per second (seeTable 1). As with the Position extrap-olation task, occlusion duration was set at 1 s, 2 s, or 4 s in the experimental trials. This was produced in two separate ways. Again, half the experimental trials were fixed distance trials, where occlusion began after 30 Gabors had accumulated (60% of the total). Occlusion durations were produced by different accumula-tion speeds of 5, 10, or 20 Gabors per second (10%, 20%, or 40% total per second). On velocity fixed trials, Gabors always accumu-lated at a rate of 10 per second, and the three occlusion durations were produced by varying occlusion onset (10, 30, or 40 Gabors;
i.e., 20%, 60%, or 80% of the total). Table 1shows how these
parameters are matched to the Position extrapolation task in terms of proportion completed, visible durations, and occluded durations.
The graphics inFigure 3Aand B also apply to the accumulation
task, although in a more abstract way, with the timeline represent-ing empty-to-full. As with the Position extrapolation task, there were also 36 filler trials, with randomly chosen velocity and number of occluded Gabors (5–20 Gabors per second, 10 – 40 Gabors before occlusion).
To summarize, the most important feature of experimental trials in both position and accumulation tasks was that occlusion dura-tion was set at 1 s, 2 s, or 4 s, and these duradura-tions were produced by varying distance or velocity. These parameters were partly chosen for similarity with other motion extrapolation experiments
(e.g., Peterken et al., 1991; Schiff & Oldak, 1990), but also
because of inherent constraints on the accumulating Gabor stimuli. We wanted to create the subjective impression of a rapid, contin-uous process. Moreover, the process could not be too fast for the 60 Hz monitor, and not so slow as to encourage counting of the individual elements as they appeared. We also wanted to include
This
document
is
copyrighted
by
the
American
Psychological
Association
or
one
of
its
allied
publishers.
This
article
is
intended
solely
for
the
personal
use
of
the
individual
user
and
is
not
to
be
disseminated
enough elements so the number of empty slots at the onset of occlusion could not be immediately perceived.
Procedure. At the beginning of the testing session partici-pants were shown examples of one position and one accumulation trial. They were instructed to press the space bar at the exact time they thought the hidden processes were complete. After this dem-onstration, participants completed a 12-trial practice block, with six position and six accumulation trials. These were all filler trials, where velocity and occlusion parameters were chosen at random as described above. The experiment followed, comprising 192 trials in total. Half were Position extrapolation, half were Accumulation extrapolation. The position and accumulation trials were inter-leaved and presented in a random order for each participant. The intertrial interval was randomized between 200 ms and 800 ms. The experiment was broken into 12 blocks of 16 trials, and participants were encouraged to take a rest between each block. There were no fixation demands on any trials.
Analysis. Before any analysis, one anomalous trial where the participant responded at more than four times the maximum oc-clusion duration was excluded. On each trial, we measured CTE (time from occlusion onset to button press). From the CTE values, we also obtained error (defined by CTE minus perfect CTE), variable error (VE; the standard deviation of CTEs in the condi-tion) and the coefficient of variation (CoV; defined by VE/mean CTE). All four metrics were analyzed with repeated measures ANOVA. The Greenhouse-Geisser correction factor was used when the assumption of sphericity was violated. Finally, the slope
and intercept of the relationship between occlusion duration and performance metrics were obtained for each condition and partic-ipant.
Results
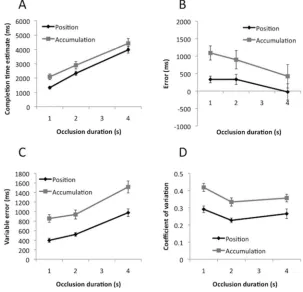
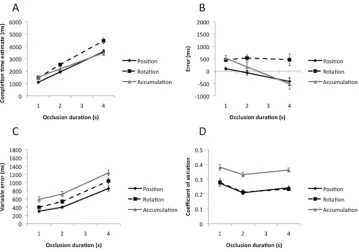
Results are shown inFigure 2. Panel A shows CTE as a function
of occlusion duration in the position and accumulation tasks. We analyzed this data with repeated measures ANOVA—Task
(Posi-tion, Accumulation)⫻Occlusion Duration (1 s, 2 s, 4s). There was
a main effect of task, because participants responded later in the
accumulation task, F(1, 23)⫽9.67, p⫽.005, partial2⫽
0.30. CTE increased with occlusion duration, demonstrating that
partic-ipants could perform the task appropriately, F(1.12,25.74) ⫽
233.24, p ⬍ .001, partial 2
⫽ 0.91. There was no interaction
between task and occlusion duration, F(1.30, 29.92)⫽1.84, p⫽
.185. Analysis of occlusion duration versus CTE slope values
found no difference between tasks, t(23)⫽1.37, p⫽.183, while
the intercept was higher in the accumulation task, t(23)⫽4.74,
[image:5.594.144.447.394.686.2]p⬍.001.
Figure 2Bshows error data as a function of occlusion duration. It can be seen that button presses were usually too late (positive on this graph). However, error became earlier as occlusion duration increased from 1 s to 4 s. These results are very similar to the CTE analysis, because the error data was directly derived from CTE data, so we do not analyze them statistically.
Figure 2. Results of Experiment 1. (A) Completion time estimates (CTEs) as a function of occlusion duration in position and accumulation tasks. (B) Error. (C) Variable error (VE). (D) Coefficient of variation (CoV). Error bars represent⫹/⫺1 S.E.M.
This
document
is
copyrighted
by
the
American
Psychological
Association
or
one
of
its
allied
publishers.
This
article
is
intended
solely
for
the
personal
use
of
the
individual
user
and
is
not
to
be
disseminated
Figure 2Cshows variable error (a participant’s VE score is the standard deviation of their 20 CTEs within a condition). It can be seen that CTEs become more variable with longer occlusion du-rations in both tasks, and that VE was larger in the accumulation task. Repeated measures ANOVA found main effects of task, F(1,
23)⫽27.22, p⬍.001, partial2
⫽0.54, and occlusion duration,
F(1.49, 34.34) ⫽ 84.04, p ⬍ .001, partial 2 ⫽
0.79, but no
interaction, F(1.31, 31.10) ⫽ ⬍ 1, ns. The tasks had similar
occlusion duration versus VE slopes, t(23)⬍1, ns, but the
inter-cept was greater in the accumulation task, t(23)⫽4.35, p⬍.001.
Figure 2Dshows the coefficient of variation for each condition
(CoV ⫽ VE/mean CTE). CoV analysis shows that, across all
conditions CTE variability was around 32% of the mean value.
However, CoV was greater for the accumulation task, F(1, 23)⫽
42.39, p⬍.001, partial2 ⫽
0.65. There was a main effect of
occlusion duration, F(2, 46)⫽14.03, p⬍.001, partial2
⫽0.38,
because the CoV was relatively larger than the 1-s occlusions.
There was no Task⫻Occlusion duration interaction, F(2, 46)⬍
1, ns.
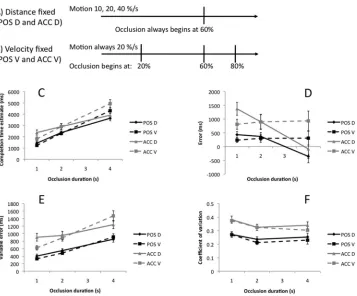
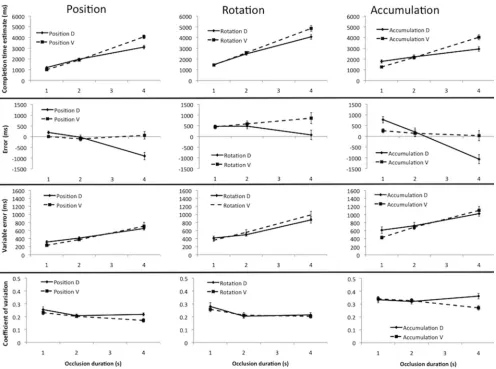
In our Experiment 1, we produced different occlusion durations
by varying velocity (while keeping distance fixed,Figure 3A) or
varying occluded distance (while keeping velocity fixed, Figure
3B).Table 1shows the stimulus parameters in the fixed distance
and fixed velocity trials.Figure 3Cshows how CTEs were affected
by occlusion duration and fixed parameter in each task. The choice of fixed parameter (distance or velocity) had a similar effect on
CTE in both tasks. This was confirmed with a three-factor repeated
measure ANOVA—Task (Position, Accumulation) ⫻ Fixed
Pa-rameter (Distance, Velocity)⫻Occlusion Duration (1 s, 2 s, 4s).
In addition to the main effects of task and occlusion duration (which are reported above) there was a main effect of fixed
parameter, F(1, 23)⫽11.51, p⫽.002, partial2⫽
0.33, because, over all conditions, participants responded later in the trials where velocity was fixed than the trials where distance was fixed. There
was no interaction between task and fixed parameter, F(1, 23)⬍
1, ns, suggesting that this effect was similar in both tasks. There
was a strong fixed parameter ⫻ occlusion duration interaction,
F(1.46, 33.64)⫽40.96, p⬍.001, partial2⫽
0.64, which was
not further modulated by task, F(1.34, 30.80)⫽3.55, p⫽.058.
Figure 3Dshows error data. This highlights the nature of the
fixed parameter⫻occlusion duration interaction. In the velocity
fixed trials, error did not change dramatically with occlusion duration. Conversely, in the fixed distance trials, there was a shift from late to early CTEs as occlusion duration increased. Impor-tantly, these patterns are similar in both tasks (even though CTEs were uniformly later in the accumulation task). The three-factor ANOVA is essentially identical to that reported above (because error was directly derived from CTE, as mentioned). Instead, we now follow-up the interaction between fixed parameter and occlu-sion duration. There was a no effect of occluocclu-sion duration in the
[image:6.594.121.478.72.368.2]fixed velocity condition, F(1.28, 29.45)⬍1, ns. However, there
Figure 3. Extended results of Experiment 1. Panels A and B diagrammatize the distance fixed and velocity fixed trials in Experiment 1. (C) CTEs as a function of occlusion duration in the position (POS) and accumulation (ACC) tasks, both when occluded distance (D) and target velocity (V) were held constant across the different levels of occlusion duration. (D) Error. (E) VE. (F) CoV. Error bars represent⫹/⫺1 S.E.M.
This
document
is
copyrighted
by
the
American
Psychological
Association
or
one
of
its
allied
publishers.
This
article
is
intended
solely
for
the
personal
use
of
the
individual
user
and
is
not
to
be
disseminated
was a strong main effect of occlusion duration in the fixed distance
condition, F(1.16, 26.68)⫽33.49, p⬍.001, partial2⫽
0.59. The effect of task, fixed parameter, and occlusion duration on
VE is shown inFigure 3E(here VE⫽the standard deviation of the
10 CTEs in each condition). It appears that the positive linear relationship between occlusion duration and VE was stronger in the fixed velocity trials. This was confirmed with three-factor
repeated measures ANOVA. The main effects of task, F(1, 23)⫽
27.39, p ⬍ .001, partial 2
⫽ 0.54, and occlusion duration,
F(1.43,32.89)⫽74.24, p⬍.001, partial2⫽
0.76, were signif-icant. Although there was no main effect of fixed parameter, F(1,
23)⫽1.19, p⫽.287, there was a significant crossover interaction
between fixed parameter and occlusion duration, F(2, 46)⫽9.95,
p⬍ .001, partial2⫽
0.30. Unlike most effects reported here, there was an additional three-way interaction between task, fixed
parameter, and occlusion duration, F(2, 46) ⫽ 3.70, p ⫽ .034,
partial2
⫽0.137, because the crossover interaction was present
in the accumulation task, F(2, 46)⫽9.79, p⬍.001, partial2⫽
0.30, but did not reach significance in the position task, F(1.50,
34.51)⫽1.54, p ⫽.230. The CRC does not predict interactions
involving task (although basic crossover was apparent in both tasks).
CoV results are shown inFigure 3F. The only significant effects
were a main effect of task, F(1, 23)⫽ 28.85, p⬍.001, partial
2
⫽0.56, and occlusion duration, F(2, 46)⫽10.20, p⬍.001,
partial 2 ⫽
0.31. The main effect of fixed parameter was not
significant, F(1, 23)⫽2.98, p⫽.098, and there were no
interac-tions, F(2, 46)⬍1, ns.
These results show that CTEs were systematically shaped by trial parameters, and crucially, that these influences were comparable in both position and accumulation tasks. This supports the CRC hypoth-esis. Further support came from correlation analysis: Participants who responded later in the position task also did so in the accumulation
task (r⫽ .679, p⬍.001, one-tailed). To explore this further, we
measured intertask CTE correlations in all conditions separately (2
fixed parameter⫻ 3 occlusion duration). There was a significant,
positive correlation in all six cases, and the weakest effect was still
significant (r⫽ .401, p⫽.026, one-tailed). Next we considered a
more specific correlation analysis. For each task, we recomputed the CTEs in each condition as a deviation from the mean CTE across conditions. We then explored correlations between normalized CTEs in the position and accumulation tasks for the six conditions. These
correlations were weak, with only two reaching significance (r⬎.36,
p⬍.04. one-tailed). However, the mean coefficient was still positive
(r⫽.2), and there were no large negative correlations (min⫽ ⫺.025).
This provides some modest evidence that participants who were strongly influenced by an independent variable in the position task tended to be influenced by the same variable the accumulation task.
Discussion
Experiment 1 compared performance in two types of extrapo-lation task: a standard Position extrapoextrapo-lation task and a novel Accumulation extrapolation task. One hypothesis was that a com-mon rate control system guides responses in both tasks (CRC hypothesis). The alternative SRC hypothesis was that the extrap-olation tasks recruit separate rate control mechanisms. We did not find an identical pattern of results in the position and accumulation tasks, which would provide the strongest evidence for CRC.
How-ever, the performance differences between position and accumu-lation tasks did not multiply with occlusion duration. This pattern suggests that mental updating unfolded at the same rate in both extrapolation tasks, as if the same rate controller with the same properties governed both.
In addition, we found that CTEs were significantly correlated on both tasks, so a participant who pressed earlier in the standard Position extrapolation task also tended to do so in the Accumula-tion extrapolaAccumula-tion task. We also found that normalized CTEs were weakly correlated. This means that the influence of independent variables was related across tasks, so a participant who was strongly influenced by a given factor in the position task was also strongly influence by the same factor in the accumulation task. However, we would not want to over interpret this, because the normalized correlations were neither strong nor consistent.
Finally, stimulus parameters had similar effects on performance in the both tasks. For CTEs, there was a comparable fixed param-eter by occlusion duration crossover interaction in both tasks. This again suggests that the tasks are related. For VE, there were also crossover interactions in both tasks, although this did not reach significance in the position task.
These similarities imply that motion extrapolation tasks do not rely solely on the smooth pursuit system, which cannot track accumulation. It is possible that mental imagery facilitates
perfor-mance, as suggested by many authors (e.g.,Huber & Krist, 2004;
Jonikaitis et al., 2009). However, imagery would still have to be updated at the appropriate rate during occlusion, so some form of universal rate control system would still be necessary. In Experi-ment 2, we compare the position and accumulation tasks with a third extrapolation task, where the stimuli can be tracked with eye movements. We wanted to see whether performance on the accu-mulation task would stand out dramatically from the other two.
Experiment 2
In Experiment 2, we compared performance on a new rotation extrapolation task with the position and Accumulation extrapola-tion tasks of Experiment 1. Our rotaextrapola-tion task was similar to an
experiment conducted by de’Sperati (2003). A vertical bar was
presented in the center of a circle. The bar then rotated leftward or rightward at a constant angular velocity, before disappearing at an unpredictable time. The participant pressed a button at the exact time they judged it to have returned to the vertical orientation,
having traveled through 360° (seeFigure 4). The Position
extrap-olation task in Experiment 2 was the same as Experiment 1. The Accumulation task was similar to Experiment 1, but we took this opportunity to compare accumulation of white squares on a black background with black squares on a white background. Trials thus had either an increase and decrease in luminance (counterbalanced across other factors in the experiment). This was an alternative to using Gabors, and was a better match for the bidirectional motion in the position and rotation tasks.
Experiment 2 provides an important test for the common rate control hypothesis because it contrasts two kinds of occluded motion that can be tracked by the oculomotor system (position and rotation), with the accumulation task, which cannot be tracked by the oculomotor system. According to the common rate control account, the results of the accumulation task should not stand out dramatically from the other two “oculomotor-friendly”
extrapola-This
document
is
copyrighted
by
the
American
Psychological
Association
or
one
of
its
allied
publishers.
This
article
is
intended
solely
for
the
personal
use
of
the
individual
user
and
is
not
to
be
disseminated
tion tasks. Experiment 2 thus provided a baseline, showing the kind of performance differences we can expect between two ex-trapolation tasks with different stimuli, but which both potentially recruit the oculomotor system. We were interested to see whether performance metrics on the accumulation task fall within this range.
Again we used analysis of slope and intercept effects to test precise predictions from the CRC. The CRC hypothesis predicts that CTE and VE should be related to task parameters in the same way on the position, accumulation, and rotation tasks. If task differences are found, they should not multiply with occlusion duration. It also predicts that CTEs should correlate across all three extrapolation tasks, so that participants who respond late in one will also respond later in the other two.
Method
Twenty-four participants were involved (aged 18 to 50, two left-handed, nine male). The apparatus was the same as Exper-iment 1. Again participants pressed a button at the exact time they thought the occluded processes were complete. The basic features of the position and accumulation tasks were the same as Experiment 1. The track in the extrapolation task was always 20° long, and there were always 50 square placeholders
ar-ranged in a 5° ⫻10° rectangle in the accumulation task. The
background was either black or white, and the accumulating squares were the opposite shade. The rotation task involved a
gray circle, with a red/blue vertical line in the center (seeFigure
4). The line could rotate clockwise or counterclockwise. It
disappeared at an unpredictable point, and participants were
instructed to press when they judged it had returned to the vertical orientation, assuming a constant angular velocity.
As with Experiment 1, all types of extrapolation (position, accumulation, and rotation) were matched in terms of proportions.
[image:8.594.50.286.76.287.2]These values were exactly the same as Experiment 1 (Table 1,
Figure 3Aand B). For the rotation task, trials involved a single revolution, so these proportions refer to the degrees round the circumference (not degrees of visual angle). As with Experiment 1, all experimental trials had one of three occlusion durations, 1 s, 2 s, and 4 s, which were produced by fixing distance or velocity. Direction was fully crossed with the other factors (where “direc-tion” references leftward or rightward motion in the Position extrapolation task, white or black accumulation in the accumula-tion task, and clockwise or counterclockwise in the rotaaccumula-tion task). As with Experiment 1, there were 60 experimental trials for each task, and there were an additional 36 filler trials, where parameters were set randomly on a trial-by-trial basis, within the same limits of the experimental trials. CTE, error, VE, and CoV were pro-cessed and analyzed in the same way as Experiment 1 (again one outlier trial was removed because CTE was four times the longest occlusion).
Results
CTEs are shown as a function of occlusion duration for the three
extrapolation tasks in Figure 5A. The corresponding repeated
measures ANOVA revealed a main effect of task, F(1.50,
34.45) ⫽ 11.76, p ⬍ .001, partial 2 ⫽
0.34, and occlusion
duration, F(1.09, 25.12)⫽299.69, p⬍.001, partial2
⫽0.93, as
well as an unexpected Task ⫻ Occlusion duration interaction,
F(2.56, 58.93) ⫽21.86, p ⬍ .001, partial2
⫽ 0.49. Next the
slopes of the occlusion duration versus CTE relationship from each task were compared. There was a significant difference between
slopes for all three tasks—smallest effect, t(23)⫽3.67, p⫽.001.
There were also intercept differences between all tasks—smallest
effect, t(23)⫽3.00, p⫽.006. Error patterns are shown inFigure
5B, which helps visualize the interaction effects described above.
VE results are shown in Figure 5C. ANOVA revealed main
effects of task, F(1.39, 30.02) ⫽20.92, p⬍ .001, partial2
⫽
0.48, and occlusion duration, F(1, 29, 29,73)⫽162.99, p⬍.001,
partial2
⫽0.88, but no interaction, F(3.01, 69.21)⬍1, ns. The
slopes inFigure 5Cwere similar—largest effect, t(23)⫽1.19, p⫽
.246. However, the intercept for the accumulation task was greater
than the position task, t(23)⫽3.20, p⫽.004, and the rotation task,
t(23) ⫽ 2.49, p ⫽ .020, which did not differ from each other, t(23)⫽1.35, p⫽.190. CoV results are shown inFigure 5D. It can be seen the variation was approximately 25% of mean CTEs in the position and rotation tasks, but around 36% in the accumulation task. CoV was also slightly higher at 1s occlusions. ANOVA
found main effects of task, F(2, 46)⫽ 72.76, p⬍.001, partial
2
⫽0.77, and occlusion duration, F(1.48, 34.08)⫽14.89, p⬍
.001, partial2⫽
0.39, but no interaction, F(4, 92)⬍1, ns.
As with Experiment 1, we considered CTEs and related metrics on trials where occlusion duration was produced by varying ve-locity (while keeping distance constant) or distance (while keeping velocity constant). This was explored with a three-factor
analy-sis—Task (Position, Rotation, Accumulation)⫻Fixed parameter
(Distance, Velocity)⫻ Occlusion Duration (1 s, 2 s, 4s). CTEs
from the three different extrapolation tasks are shown in the top Figure 4. The Rotation extrapolation task. Participants observed a bar
that was half red and half blue. The trials began with vertical orientation, with the red upward. The bar then rotated counterclockwise (A) or clock-wise (B). At an unpredictable point, the bar disappeared. Participants assumed continued occluded rotation at the same velocity, and pressed when they judged a single revolution to be complete. The color version of this figure appears in the online article only.
This
document
is
copyrighted
by
the
American
Psychological
Association
or
one
of
its
allied
publishers.
This
article
is
intended
solely
for
the
personal
use
of
the
individual
user
and
is
not
to
be
disseminated
row ofFigure 6. There was a main effect of fixed parameter, F(1,
23)⫽ 65.09, p⬍ .001, partial2⫽
0.74, a fixed parameter⫻
occlusion duration interaction, F(2, 46)⫽206.29, p⬍.001, partial
2 ⫽
0.90. There was also a three-way interaction between all
factors, F(2.89, 66.39)⫽8.78, p⬍.001, partial2
⫽0.28. The
nature of the three-factor interaction can also be seen on the second
row ofFigure 6, which shows error. In fixed velocity trials, error
did not change with occlusion duration—largest, F(1.09, 25.01)⫽
3.93, p⫽.055. Conversely, errors shifted from late to early in the
fixed distance trials, and this was significant in all tasks—smallest, F(1.11, 25.63)⫽5.00, p⫽.031, partial2
⫽0.18. Although the
fixed parameter⫻occlusion duration interactions were
approxi-mately the same shape in the three extrapolation tasks, they were not identical, hence the three-way interaction. This is somewhat inconclusive, but we acknowledge that it is not consistent with CRC.
VE was also influenced by task parameters in a similar way for
all three tasks (Figure 6, third row). As in Experiment 1, all tasks
produced crossover interactions, where the slope of the occlusion duration versus VE was steeper for the velocity fixed trials. The
main effects of task, F(1.57, 30.04) ⫽17.88, p ⬍ .001, partial
2⫽
0.44, and occlusion duration, F(1.31,30.02)⫽109.19, p⬍
.001, partial2
⫽0.83, were significant. There was no main effect
of fixed parameter, F(1, 23)⬍1, ns, and no interactions between
task and fixed parameter, F(1.57, 36.11) ⫽ 2.07, p ⫽ .149, or
between task and occlusion duration, F(4, 92)⫽2.00, p⫽.101.
The crossover interaction between fixed parameter and occlusion
duration was significant, F(1.34,30.92)⫽7.827, p⫽.005, partial
2
⫽0.254, and not further modulated by task, F(2.41, 55.42)⬍
1, ns CoV results are shown in the bottom row ofFigure 6. There
were main effects of task, F(2, 46)⫽56.47, p⬍.001, partial2
⫽
0.71; fixed parameter, F(1, 23)⫽ 6.07, p⫽ .022, partial2
⫽
0.209; and occlusion duration, F(2, 46)⫽11.19, p⬍.001, partial
2
⫽ 0.33. There were no interactions between task and fixed
parameter, F(1.53,35.11)⬍1, ns, or task and occlusion duration,
F(4, 92)⫽1.11, p⫽.356. There was, however, a fixed
parame-ter⫻occlusion duration interaction, F(2, 46)⫽7.43, p⫽.002,
partial2
⫽0.24, which was not further modulated by task, F(4,
92)⫽1.84, p⫽.128.
In summary, the CTE results were related to occlusion duration with different slopes in the different extrapolation tasks, providing some support for alternative SRC hypothesis. However, VE showed no slope effects, supporting the CRC. The same interac-tions with fixed parameter were evident in all tasks, partially supporting the CRC (although these interactions were more pro-nounced in some tasks than others). Nevertheless, the accumula-tion task did not generally stand out from the other two tasks, even though the stimuli could not be tracked with eye movements. One exception was the CoV results; however, the same does not hold for the metrics used to calculate CoV, so this is difficult to interpret.
More consistent support for the CRC hypothesis comes from striking correlations between CTEs in all tasks. First, we simply measured correlations between the CTEs in position, rotation, and accumulation tasks (collapsing across other conditions). All three comparisons showed a positive correlation with one-tailed tests
(position vs. rotation, r⫽.792, p⬍.001; position vs.
accumula-tion, r⫽.441, p⫽.016; rotation vs. accumulation, r⫽.507, p⫽
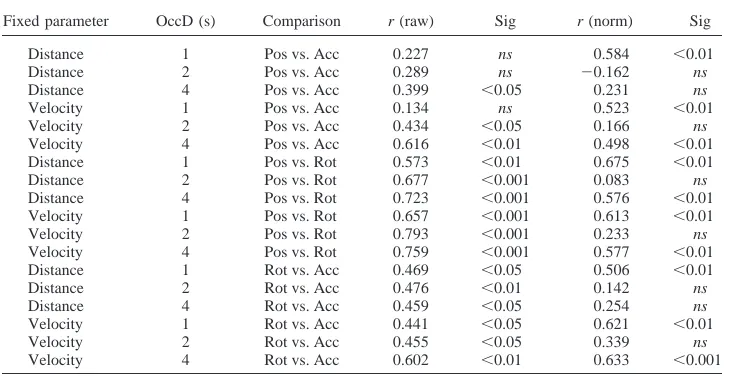
.006). Next we analyzed correlations between CTEs in all six
conditions of three tasks. Results are shown inTable 2. Of the 18
possible correlations, all were positive, and all but three were
[image:9.594.118.477.75.327.2]significant according to one-tailed tests (Table 2, right column).
Figure 5. Results of Experiment 2. Conventions are the same asFigure 2, except results from the rotation extrapolation task are also included.
This
document
is
copyrighted
by
the
American
Psychological
Association
or
one
of
its
allied
publishers.
This
article
is
intended
solely
for
the
personal
use
of
the
individual
user
and
is
not
to
be
disseminated
Table 2reveals another interesting pattern: In general, the weakest correlations were all between position and accumulation tasks, and the strongest were between position and rotation. Correlations between rotation and accumulation were intermediate. We con-ducted a second correlation analysis with normalized CTEs. These
results are shown in the far columns of Table 2: Again the
correlations were typically positive, with 10 significant positive correlations from 18, and no large negatives.
Discussion
Experiment 2 was an extension of Experiment 1, with the
addition of a third task that required mental rotation (de’Sperati,
2003). Interestingly, the results of the accumulation task, where
occluded motion could not be directly tracked with eye move-ments, did not stand out from the results of the position and rotation extrapolation tasks. Although there were significant ferences between CTEs in the three tasks, the magnitude of dif-ferences between position and rotation were comparable to any
differences with accumulation. This indicates that the Accumula-tion extrapolaAccumula-tion task is not anomalous in this context.
To test CRC and SRC accounts in detail, we again analyzed the slope of the relationship between occlusion duration and CTEs. Unlike Experiment 1, there were some slope differences, which could be interpreted as support for the SRC. However, these unexpected slope differences were not straightforward. According to the SRC account, any differences between the extrapolation tasks should multiply with occlusion duration, while we observed the opposite effect for CTEs in position and accumulation tasks, which became more similar at longer occlusions. Moreover, VE slopes were similar in all three tasks, as predicted by the CRC account.
[image:10.594.50.546.75.444.2]As with Experiment 1, the fixed parameter had a profound effect on CTEs. When velocity was held constant, error was similar at all levels of occlusion duration. Conversely, when occluded distance was held constant, we observed later CTEs and short occlusions and earlier CTEs at longer occlusions. The important point is that this pattern was found in all three extrapolation tasks, suggesting Figure 6. Extended results of Experiment 2. Rows from top to bottom, show CTEs, Error, VE and CoV.
Columns, from left to right, show Position extrapolation, rotation extrapolation, and Accumulation extrapolation tasks. Conventions are similar toFigure 3.
This
document
is
copyrighted
by
the
American
Psychological
Association
or
one
of
its
allied
publishers.
This
article
is
intended
solely
for
the
personal
use
of
the
individual
user
and
is
not
to
be
disseminated
that there is considerable overlap between them. We did not predict fixed parameter by occlusion duration interactions in Ex-periments 1 and 2, but we may speculate about their origin nev-ertheless. The pattern of CTEs in the distance fixed trials resem-bles Veirordt’s law: Relatively short intervals tend to be
overestimated and longer intervals underestimated (Brown, 1995).
However, this range effect was not observed in the velocity fixed trials, so other explanations are required. We suggest that this pattern of errors is consistent with a rate controller that partially combines or blends the velocity representations across all trials seen in the experiment. First, consider trials where occlusion duration was produced by variations in velocity, with occluded
distance held constant (the distance fixed trials,Figure 3A). If the
rate controller were biased toward the typical velocity, we would get late responses at short occlusion durations, and early responses at long occlusions: exactly the observed result. Conversely, a rate controller with this averaging property would be perfect for the fixed velocity trials, where the most common velocity was always
presented (Figure 3B). In these trials CTEs would relate more
closely to occlusion duration, again, exactly the observed result (see Makin et al., 2008 for indirectly related findings). These considerations provide further, albeit indirect, support of the com-mon rate control hypothesis: We note that an effect that is attrib-utable to characteristics of the rate controller is common to both tasks (rather than some general bias).
As with Experiment 1, we reasoned that if tasks involve the same cognitive processes, then performance should be correlated. Experiment 2 provided stronger evidence for this than Experiment 1. There was a positive correlation between CTEs in all three tasks, so participants who pressed early in one extrapolation task tended to do so in the other two. Correlations were strongest between position and rotation tasks, and weakest between position and accumulation, and intermediate between rotation and accumulation (see Table 2). The intermediate correlations prevent conclusive understanding of this result. The correlations between normalized
CTEs were slightly stronger than in Experiment 1. These again suggests that the influence of independent variables was correlated across the three extrapolation tasks, albeit modestly, so partici-pants who were strongly influenced by a given factor one extrap-olation task tended to be influenced by the same factor in the others.
General Discussion
Makin and Poliakoff (2011)built upon previous work and their own findings, and argued that the smooth pursuit system mediates motion extrapolation performance. It is likely that premotor net-works drive the eyes or covert attention to hidden target locations, and velocity memory controls the rate at which attention shifts (Bennett & Barnes, 2006). Whereas standard motion extrapolation
tasks are perfectly suited to smooth pursuit eye movements (Figure
1A), other novel forms of motion cannot be tracked with the eyes.
Here we tested an Accumulation extrapolation task, where small visual patches (either Gabors or squares) accumulated at a certain rate in a defined area. The process stopped before the area was full, but participants assumed further, hidden accumulation, then pressed a button when they thought the area would be completely
full (Figure 1B).
Although there are differences between different extrapolation tasks, they all involve some kind of updating across an occlusion period. We proposed that different representational systems (cod-ing degree of fullness, angle, or simply spatial position) could be functionally coupled to a common rate control mechanism. During the standard Position extrapolation task, the rate controller would function in exactly the same way as the velocity memory system, and be coupled to oculomotor networks. During Accumulation extrapolation, the same rate controller could be coupled to a dynamic representation of accumulating Gabors.
[image:11.594.116.483.100.288.2]Support for the CRC hypothesis was threefold. Most conclu-sively, when metrics differed between tasks, these differences did Table 2
Correlations Between Completion Time Estimates in Experiment 2
Fixed parameter OccD (s) Comparison r (raw) Sig r (norm) Sig
Distance 1 Pos vs. Acc 0.227 ns 0.584 ⬍0.01
Distance 2 Pos vs. Acc 0.289 ns ⫺0.162 ns
Distance 4 Pos vs. Acc 0.399 ⬍0.05 0.231 ns
Velocity 1 Pos vs. Acc 0.134 ns 0.523 ⬍0.01
Velocity 2 Pos vs. Acc 0.434 ⬍0.05 0.166 ns
Velocity 4 Pos vs. Acc 0.616 ⬍0.01 0.498 ⬍0.01
Distance 1 Pos vs. Rot 0.573 ⬍0.01 0.675 ⬍0.01
Distance 2 Pos vs. Rot 0.677 ⬍0.001 0.083 ns
Distance 4 Pos vs. Rot 0.723 ⬍0.001 0.576 ⬍0.01
Velocity 1 Pos vs. Rot 0.657 ⬍0.001 0.613 ⬍0.01
Velocity 2 Pos vs. Rot 0.793 ⬍0.001 0.233 ns
Velocity 4 Pos vs. Rot 0.759 ⬍0.001 0.577 ⬍0.01
Distance 1 Rot vs. Acc 0.469 ⬍0.05 0.506 ⬍0.01
Distance 2 Rot vs. Acc 0.476 ⬍0.01 0.142 ns
Distance 4 Rot vs. Acc 0.459 ⬍0.05 0.254 ns
Velocity 1 Rot vs. Acc 0.441 ⬍0.05 0.621 ⬍0.01
Velocity 2 Rot vs. Acc 0.455 ⬍0.05 0.339 ns
Velocity 4 Rot vs. Acc 0.602 ⬍0.01 0.633 ⬍0.001
Note. Pos ⫽ Position extrapolation; Acc ⫽ Accumulation extrapolation; Rot ⫽ Rotation extrapolation; OccD⫽Occlusion duration. The important columns show the Pearson’s r coefficient and significance level for each. Correlations between raw CTEs and normalized CTEs are shown in separate columns.
This
document
is
copyrighted
by
the
American
Psychological
Association
or
one
of
its
allied
publishers.
This
article
is
intended
solely
for
the
personal
use
of
the
individual
user
and
is
not
to
be
disseminated
not systematically multiply with occlusion duration. In other words, there were rarely slope differences between tasks. This is in stark contrast to the SRC, which predicts that performance differ-ences should grow for longer occlusions. Second, different kinds of extrapolation were affected by stimulus parameters in the same way, and these similarities were quite specific: There was a
Com-parable fixed parameter ⫻ occlusion duration interaction in all
tasks. Third, we found robust correlations between CTEs on the different extrapolation tasks, so that people who responded earlier in one tended to do so in the corresponding condition of the others. The variable error data was particularly interesting. This was found to increase with occlusion duration, and the function relating occlusion duration to VE was linear, and had the same slope in all extrapolation tasks we tested. To further understand our VE re-sults, we ran several computer simulations of CTE variation, which are described in the supplementary materials online. The take-home message from our supplementary analysis is that con-stant noise (which does not scale with occlusion duration) and proportional noise (scaled to occlusion duration) both contribute to CTE variability. The real data can be best modeled as difference in constant noise between the tasks, but identical proportional noise. Proportional noise is more closely related to imprecision in the rate control system itself, and it instructive that this was comparable across tasks.
Could there be some other explanation for these results, instead of the common rate control account? We acknowledge that each piece of evidence presented here is probably not conclusive on its own. The least convincing evidence for CRC is probably the correlation analysis. After all, there are many reasons performance might correlate between different tasks, even if they do not share the same resources. For example, some participants could simply try harder than others at all tasks they are presented with, resulting in correlated performance metrics. Nevertheless, our results show converging evidence for CRC, from various sources.
How does the CRC hypotheses change contemporary ideas about motion extrapolation? As we have said, the idea that motion extrapolation is entirely mediated by the smooth pursuit
system (Makin & Poliakoff, 2011) requires some
reconsidera-tion. What about the more general idea, now less widely held, that motion extrapolation involves cognitive clocking? Are our tasks “merely” temporal reproduction tasks, involving known
timing faculties? As mentioned,Tresilian (1995)proposed that
motion extrapolation involves obtaining a TTC representation just before occlusion, then counting down this temporal repre-sentation in order to initiate the button press at the right time. This is fundamentally different from other accounts, because it involves no tracking of the occluded target and no mental imagery. It is theoretically possible that our participants used the clocking strategy, and that a common clocking process produced the similarities between tasks.
There has been a large research effort focused on understand-ing how TTC information is obtained, which we briefly con-sider. Many TTC researchers have been inspired by the
Gibso-nian approach to perception, which hopes to specify
information in the optic array that can be used to guide action
(e.g., Schiff & Detwiler, 1979). When an object approaches,
TTC is specified by the angle subtended by an object, divided by the rate of expansion. The Greek letter “tau” is traditionally
used to denote this value (Lee, 1976). For our Position
extrap-olation task, tau is specified by the angle between the target and end of the track, divided by the rate of contraction. One expla-nation for worse performance in the accumulation task is that tau information is not available. However, some researchers have developed and extended the tau hypothesis to other
mo-dalities, specifying auditory tau (Schiff & Oldak, 1990;Shaw,
McGowan, & Turvey, 1991). This multimodal tau resembles the above ideas about a common rate controller, although the focus is on how tau is extracted, not how the resulting temporal representation is exploited.
Despite these considerations, there is good reason to doubt that motion extrapolation involves tau and countdown timers. For example, this account is inconsistent with the finding that CTEs are affected by fixation, and it cannot explain why is there a clear relation between TTC estimates and oculomotor behavior during occlusion, or why the oculomotor system ap-pear to be covertly active when people conduct motion
extrap-olation during fixation (Makin & Poliakoff, 2011). The
clock-ing theory must also explain why there are performance similarities between extrapolation tasks that can be done with
the clocking strategy and those that cannot (DeLucia & Liddell,
1998), and why induction of the motion aftereffect in the
position of the occluder alters performance (Gilden et al.,
1995). Furthermore, the immediate accessibility of tau is not
always exploited when other less reliable TTC cues are
avail-able (DeLucia, 2013). Given these considerations, we think it is
likely that people simulate the ongoing process, by tracking, mentally rotating, or mentally filling the remaining places, and that a common rate controller guides the rate of updating. In other words, people may enact the occluded processes, even if pure timing would be computationally simpler.
Other work on rate control has explored how well people can synchronize paced finger-taps with rhythmic tones (synchronization period), and how well they can keep time after the tone inputs are switched off (continuation period). It is thought that an internal pacemaker may time finger taps during the continuation period. The pacemaker can be functionally coupled to different motor effectors, and timing variation attributed to separate cognitive and motor
sources (see Wing, 2002 for review). This pacemaker obviously
resembles the putative common rate controller— but despite these intriguing analogies, there are also large disanalogies. On motion extrapolation tasks, mean errors shift by hundreds of milliseconds as occlusion duration increases, while the mean interresponse in-terval remains nearly perfect across long continuation periods
of finger tapping. Rao et al. (1997) measured brain activity
during the synchronization and continuation periods. During continuation, there was additional activation in loops connect-ing the basal ganglia nuclei and supplementary motor area, and in loops connecting the right inferior frontal gyrus with the auditory cortex. This differs considerably from the brain activ-ity recorded during occluded tracking, which produces addi-tional activation in a network of brain regions including the
dorso-lateral prefrontal cortex (e.g., Lencer et al., 2004). We
anticipate that the central pacemaker that guides rhythmic mo-tor responses and the common rate controller may one day be collapsed into a common theoretical construct, but this is not guaranteed.
This
document
is
copyrighted
by
the
American
Psychological
Association
or
one
of
its
allied
publishers.
This
article
is
intended
solely
for
the
personal
use
of
the
individual
user
and
is
not
to
be
disseminated