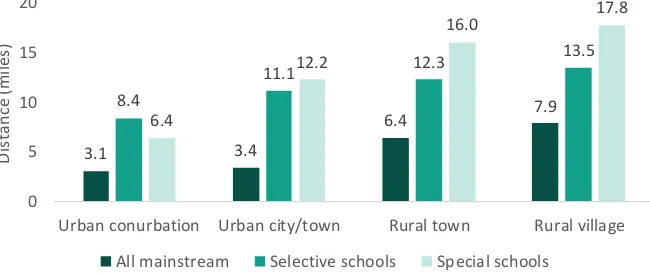
Access to special schools in England
Full text
Figure
Related documents
Teachers from schools with a high proportion of FSM-eligible pupils are also more likely than average to say that they expect to make changes to their GCSE option blocks (17%
Taken together, our findings suggest that rapid progression of liver fibrosis during chronic HCV infection is associated with greater quasispecies diversity at an early stage in
In this study, we systematically compared inferences made by six different methods for detecting compartmentalization based on three data sets: (i) a sample of 45 patients
Employees in workplaces where managers reported a stronger adverse impact from the recession were more likely to ‘Strongly agree’ that they never had enough time to get their
Each station measures the radial component of the surface current at each grid point, and by combining data from both stations it is possible to produce maps of surface
Scenario analysis was undertaken for tubewell owners and water buyers at the current 90% subsidy rate and an assumed 50% and 0% rates to find out its effect
A review of the influence of the statutory status of the regional bodies, which applies in some states, identified statistical differences between the evaluation barriers and
The climate strategies for Bribie Island, Gold Coast and Redland included a mix of both mitigation and adaptation actions in key areas, including the natural environment

