Evaluation of Subject
Knowledge Enhancement
Courses
Technical Report – Analysis of
Survey Data 2011-12
Research Report
June 2013
Sarah Gibson, Dr Gillian O’Toole,Mary Dennison
& Lizzie Oliver
2
Contents
Table of figures 6
1. Introduction 13
2. SKE Beginning and End of Course SKE Surveys 14
2.1 Profile of Survey Respondents 14
2.1.1 Characteristics of SKE students 14
2.1.2 SKE subject and length of course 17
2.2 Student Background 19
2.1.3 Previous studies 20
2.1.4 Previous experience and professional status 23
2.3 Subject Knowledge 28
2.3.1 Level of subject knowledge 28
2.3.2 Level of confidence in the subject 32
2.3.3 Confidence to teach the subject 34
2.4 Motivations and Expectations 35
2.4.1 Motivations for teacher training and subject specialisation 35
2.4.2 Expectations of the SKE course 40
2.5 Barriers Experienced 45
2.6 Advantages and Disadvantages of the SKE Course 47
2.7 Satisfaction with the SKE Course 50
2.8 SKE Course Content 51
2.9 Comparing SKE Students and Traditional Route Teacher Trainees 54
2.10 Future Aspirations 57
2.11 Additional Comments 60
3
3.1 Profile of Survey Respondents 63
3.1.1 Characteristics of PGCE students 63
3.2 Student Background 64
3.2.1 Current studies and progress 64
3.2.2 Previous studies 68
3.2.3 Previous experience 72
3.3 Subject Knowledge 74
3.3.1 Level of subject knowledge 74
3.3.2 Level of confidence in the subject 75
3.3.3 Level of subject knowledge for teaching different levels 77
3.3.4 Expectations for teaching the chosen subject 78
3.4 Motivations and Expectations 81
3.5 Experience of SKE courses 82
3.5.1 Course content 83
3.5.2 Advantages and disadvantages of the SKE course 87
3.5.3 Satisfaction and impact 88
3.5.4 Awareness and perception of SKE courses 92
3.6 Non-SKE Students’ Perception of SKE courses 94
3.7 Comparing SKE Students and Traditional Route Teacher Trainees 95
3.8 Future Aspirations 99
3.9 Additional Comments 102
4. Newly Qualified Teacher (NQT) Survey 104
4.1 Profile of Survey Respondents 104
4.1.1 Characteristics of NQTs 104
4.2 Background of NQTs 105
4
4.2.2 Previous experience 110
4.3 Experience of Teaching 112
4.3.1 Motivations and Expectations 112
4.3.2 About the NQT post 113
4.3.3. Subjects and key stages 115
4.3.4 Satisfaction with NQT year 119
4.4 Subject Knowledge 120
4.4.1 Teaching the principal subject at different levels 120
4.4.2 Level of confidence in the subject 123
4.4.3 Subject specialisation 127
4.5 Experience of SKE Courses 127
4.5.1 Course content 128
4.5.2 Advantages and disadvantages of the SKE course 131
4.5.3 Satisfaction and impact 133
4.5.4 Awareness and perception of SKE courses 135
4.6 Future Aspirations 136
4.7 Additional Comments 139
5. Appendices 141
Appendix 1 - Beginning of Course Survey Data Tables 141
Appendix 2 - End of Course Survey Data Tables 159
Appendix 3 - PGCE Survey Data Tables 176
Appendix 4 - NQT Survey Data Tables 192
Appendix 5 – Online Survey Questionnaires 217
Beginning of Course Survey Questions 217
End of Course Survey Questions 254
5
6
Table of figures
Figure 1: Proportions of male and female SKE students by subject - Beginning of Course
Survey 2011/12 15
Table 1 Age of SKE students - Beginning of Course Survey 2011/12 15
Figure 2 Proportions of male and female SKE students by subject - End of Course
Survey 2011/12 16
Table 2 Age of SKE students - End of Course Survey 2011/12 17
Figure 3 Survey response by SKE subject - Beginning of Course Survey 2011/12 18
Figure 4 Survey response by SKE subject - End of Course Survey 2011/12 18
Table 3 Length of SKE course – Beginning and End of Course Surveys 2011/12 19
Figure 5 Proportion of SKE students holding an A level in their SKE subject - Beginning
of Course Survey 2011/12 20
Table 4 Top 3 bachelor degree subjects of SKE students - Beginning of Course Survey
2011/12 21
Figure 6 University type attended for bachelor degree by SKE subject - Beginning of
Course Survey 2011/12 22
Figure 7 Bachelor degree classification by SKE subject - Beginning of Course Survey
2011/12 23
Table 5 Proportion of SKE students with a previous career by subject - Beginning of
Course Survey 2011/12 24
Figure 8 Number of SKE students with a previous career by Standard Industrial
Classification Codes (SIC, 2007) - Beginning of Course Survey 2011/12 25
Table 6 Reasons for leaving previous career - Beginning of Course Survey 2011/12 26
Figure 9 Reasons for leaving previous career by SKE subject - Beginning of Course
Survey 2011/12 27
Figure 10 Experience of working in the school environment by SKE subject - Beginning of
Course Survey 2011/12 28
Figure 11 Level of current subject knowledge by SKE subject - Beginning of Course
7
Figure 12 Level of subject knowledge at the beginning of the course by SKE subject -
End of Course Survey 2011/12 30
Figure 13 Level of subject knowledge at the end of the course by SKE subject - End of
Course Survey 2011/12 30
Figure 14 Level of subject knowledge required to successfully complete the PGCE by
SKE subject - End of Course Survey 2011/12 31
Table 7 Proportion (percentage) of SKE students rating their level of subject knowledge
by length of SKE course - Beginning and End of Course surveys 2011/12 32
Figure 15 Level of confidence in subject by SKE subject - Beginning of Course Survey
2011/12 33
Figure 16 Level of confidence in subject by SKE subject - End of Course Survey 2011/12 33
Figure 17 Level of confidence in teaching the subject by SKE subject - Beginning of
Course Survey 2011/12 35
Table 8 Motivations for entering the teaching profession - Beginning of Course Survey
2011/12 36
Table 9 Motivations for choosing to teach the subject - Beginning of Course Survey
2011/12 37
Table 10 Motivations for teaching the subject by SKE subject - Beginning of Course
Survey 2011/12 38
Table 11 Reasons for enrolling on the SKE course by SKE subject - Beginning of Course
Survey 2011/12 39
Figure 18 Reasons for enrolling on the SKE course by length of course - Beginning of
Course Survey 2011/12 40
Table 12 Expectations of the SKE course - Beginning of Course Survey 2011/12 41
Figure 19 Expectations of the SKE course by length of course - Beginning of Course
Survey 2011/12 42
Figure 20 Expectations of the SKE course by SKE subject - Beginning of Course Survey
2011/12 42
Figure 21 What students have learned from the SKE course by subject - End of Course
8
Figure 22 What students have learned from the SKE course by length of course - End of
Course Survey 2011/12 44
Table 13 Expectations of the SKE course - End of Course Survey 2011/12 45
Figure 23 Barriers to enrolment on the SKE course by SKE subject - Beginning of Course
Survey 2011/12 46
Table 14 Barriers experienced whilst completing the SKE course - End of Course Survey
2011/12 47
Table 15 Advantages of the SKE course - End of Course Survey 2011/12 48
Table 16 Disadvantages of the SKE course - End of Course Survey 2011/12 49
Figure 24 Overall satisfaction with the SKE course - End of Course Survey 2011/12 51
Figure 25 Balance of subject knowledge and pedagogy in SKE courses - End of Course
Survey 2011/12 52
Figure 26 Preferred balance of subject knowledge and pedagogy in SKE courses - End
of Course Survey 2011/12 53
Figure 27 Career aspirations for the next 5 to 10 years - End of Course Survey 2011/12 58
Table 17 Age of PGCE survey respondents - PGCE Survey 2011/12 64
Table 18 List of top ten universities with highest number of responses - PGCE Survey
2011/12 65
Figure 28 Subject studying to teach - PGCE Survey 2011/12 65
Figure 29 Subject studying to teach by completed/not completed SKE - PGCE Survey
2011/12 66
Figure30 Comparison of subject students are studying to teach by SKE subject - PGCE
Survey 2011/12 67
Table19 Did students study the same subject for their SKE as for their PGCE? - PGCE
Survey 2011/12 67
Table 20 Did students study the same subject for their SKE as for their PGCE by length
of course - PGCE Survey 2011/12 68
Table 21 Do PGCE students hold an A level in the subject they are studying to teach by
9
Table 22 Do PGCE students hold an A level in the subject they are studying to teach by
length of SKE course - PGCE Survey 2011/12 69
Table 23 Top 3 bachelor degree subjects of PGCE students - PGCE Survey 2011/12 69
Figure 31 Degree classification of PGCE students by completed/not completed SKE -
PGCE Survey 2011/12 70
Table 24 Do students hold a postgraduate qualification? by completed/not completed
SKE – PGCE Survey 2011/12 71
Figure 32 SKE subject - PGCE Survey 2011/12 71
Table 25 SKE subject - PGCE Survey 2011/12 72
Table 26 Length of SKE course - PGCE Survey 2011/12 72
Table 27 Did students have a career prior to teacher training? - PGCE Survey 2011/12 73
Figure 32 Number of PGCE students with a previous career by Standard Industrial
Classification Codes (SIC, 2007) - PGCE Survey 2011/12 74
Figure 33 Rating progress on the PGCE course compared to fellow students - PGCE
Survey 2011/12 75
Figure 34 Rating of confidence in subject knowledge of principal subject - PGCE Survey
2011/12 76
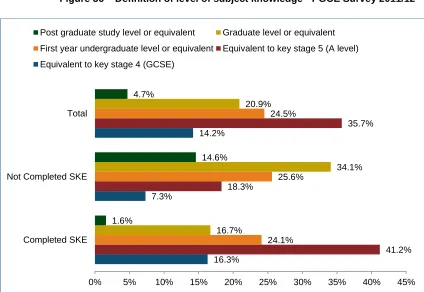
Figure 35 Definition of level of subject knowledge - PGCE Survey 2011/12 77
Table 28 Subject knowledge needed to teach to key stages 3, 4 and 5 - PGCE Survey
2011/12 77
Figure 36 Expected levels to teach principal subject to once NQT year is completed -
PGCE Survey 2011/12 78
Table 29 Level of confidence to teach to key stages 3, 4 and 5 in the principal subject -
PGCE Survey 2011/12 79
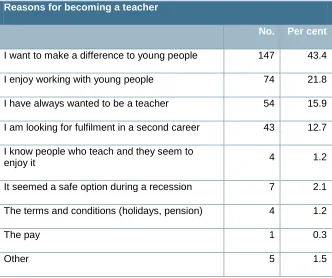
Table 30Reasons for becoming a teacher - PGCE Survey 2011/12 82
Figure 37 Balance of subject knowledge and pedagogy in SKE courses - PGCE Survey
2011/12 83
Figure 38 Preferred balance of subject knowledge and pedagogy in SKE courses - PGCE
Survey 2011/12 85
Figure 39 How the SKE course content might have helped to prepare the PGCE
10
Table 31 Advantages of the SKE course - PGCE Survey 2011/12 87
Table 32 Disadvantages of the SKE course - PGCE Survey 2011/12 88
Figure 40 How the SKE course has impacted on performance on the PGCE course -
PGCE Survey 2011/12 89
Table 33 Could the SKE course have better prepared students for the PGCE? - PGCE
Survey 2011/12 90
Figure 41 Progress on the PGCE course compared to fellow students - PGCE Survey
2011/12 92
Table 34 School awareness of SKE courses as perceived by former SKE students -
PGCE Survey 2011/12 93
Figure 42 School perception of SKE students - PGCE Survey 2011/12 93
Table 35 Reason for not completing an SKE course - PGCE Survey 2011/12 94
Figure 43 Career aspirations for the next 5 to 10 years - PGCE Survey 2011/12 99
Figure 44 Career aspirations in the next 5 years by PGCE subject - PGCE survey 100
Figure 45 Career aspirations in the next 10 years by PGCE subject - PGCE survey 101
Table 36 Age of NQT survey respondents - NQT Survey 2011/12 105
Figure 46 Proportions of male and female NQT survey respondents by subject - NQT
Survey 2011/12 105
Figure 47 Proportion of NQTs holding an A level in the subject they teach - NQT Survey
2011/12 106
Table 37 Top 3 bachelor degree subjects by former SKE subject - NQT Survey 2011/12 107
Figure 48 Degree classification by former SKE subject - NQT survey 2011/12 107
Figure 49 Proportions of SKE subjects represented by the NQT sample - NQT Survey
2011/12 108
Table 38 Former SKE course duration - NQT survey 2011/12 109
Figure 50 PGCE subject studied by NQTs - NQT Survey 2011/12 109
Figure 51 Subject studied for PGCE by former SKE subject - NQT Survey 2011/12 110
11
Figure 51 Number of NQTs with a previous career by Standard Industrial Classification
Codes (SIC, 2007) - NQT Survey 2011/12 112
Table 40 Reasons for becoming a teacher - NQT Survey 2011/12 113
Figure 52 Time taken to secure a teaching post since completing the PGCE - NQT
Survey 2011/12 114
Table 41 Type of school NQTs work in - NQT Survey 2011/12 115
Table 42 Principal subject that NQTs are teaching - NQT Survey 2011/12 116
Table 43 Is the principal subject being taught the same as the SKE subject by SKE
subject - NQT Survey 2011/12 117
Table 44 Principal and other subjects taught by key stage - NQT Survey 2011/12 118
Figure 53 Level of satisfaction with first year in teaching by former SKE subject - NQT
Survey 2011/12 120
Figure 54 Definition of current level of subject knowledge in principal subject of the SKE
course - NQT Survey 2011/12 121
Table 45 Subject knowledge needed to teach principal SKE subject to key stages 3, 4
and 5 - NQT Survey 2011/12 122
Figure 55 Expected levels to teach principal subject to once NQT year is completed -
NQT Survey 2011/12 122
Figure 56 NQTs' current level of confidence in the principal SKE subject - NQT Survey
2011/12 123
Table 46 NQTs level of confidence in subject knowledge to teach to key stages 3,4 and 5
- NQT Survey 2011/12 124
Figure 57 The extent to which NQTs have found it necessary to develop their subject
knowledge - NQT Survey 2011/12 126
Table 47 Do NQTs class themselves as subject specialists? - NQT Survey 2011/12 127
Table 48 Do colleagues of NQTs class them as subject specialists? - NQT Survey
2011/12 127
Figure 58 Split of SKE course content - NQT Survey 2011/12 128
Table 49 Preferred split of SKE course content - NQT Survey 2011/12 130
Figure 59 How the SKE course content helped to prepare NQTs for their first year of
12
Table 50 Advantages of the SKE course - NQT Survey 2011/12 132
Table 51 Disadvantages of the SKE course - NQT Survey 2011/12 133
Figure 60 Impact of SKE courses on NQTs' performance as a teacher - NQT Survey
2011/12 133
Figure 61 Impact of SKE course - NQT Survey 2011/12 135
Table 52 Awareness of schools of SKE courses - NQT Survey 2011/12 135
Figure 62 NQT views on how schools perceive SKE students - NQT Survey 2011/12 136
Figure 63 Career aspirations of NQTs in the next 5 to 10 years - NQT Survey 2011/12 137
Figure 64 Career aspirations of NQTs for the next 5 years by SKE subject - NQT Survey
2011/12 137
Figure 65 Career aspirations of NQTs for the next 10 years by SKE subject - NQT Survey
13
1. Introduction
The Teaching Agency commissioned CooperGibson Research to carry out the final year of an evaluation of the Subject Knowledge Enhancement (SKE) courses programme (initially commissioned by the Training and Development Agency for Schools). The evaluation looked at the effectiveness of the programme in equipping teacher trainees to specialise in teaching a subject in school and the impact it had on teacher trainees who had been through the SKE programme compared to those who had not.
The results presented here cover survey findings from the third year of a three year evaluation, following students from SKE courses to Initial Teacher Training (ITT) and finally on to their newly qualified teacher (NQT) year. As part of the evaluation for year three, four online surveys were administered via SKE providers. These were:
1. The Beginning of course survey for those just starting on SKE courses (run October to December 2011).
2. The End of course survey for those completing SKE courses (run May to August 2012).
3. Postgraduate Certificate of Education (PGCE) survey (run June to October 2012). 4. Newly Qualified Teacher (NQT) survey (run July to October 2012).
The Beginning of Course survey mainly focused on obtaining details in relation to the profile of students enrolling on the course and their level of subject knowledge whereas the End of Course survey was focussed on obtaining an insight into the experiences and future aspirations of students completing SKE courses. The PGCE survey included questions around progress on the PGCE course and development of subject knowledge, expectations for teaching and future aspirations. The NQT survey explored the final stages of teacher training and how SKE courses have had an impact on confidence to teach at various levels in specialist subjects and on teaching practice.
This is an annual report of survey results. It supplements a main analytical report which synthesises all of the survey and additional interview data around the objectives of the evaluation. Where appropriate, in this report, comparisons are made across different SKE course subject areas and with other key variables. The report explains the nature of questions and response options in the survey and provides proportions of responses as a percentage for comparison purposes. Alongside these proportions are the base counts for particular responses and where these counts are low, caution is advised in
14
2. SKE Beginning and End of Course SKE Surveys
As with previous years of the evaluation, a Beginning of Course survey was run to establish the backgrounds and different experiences of students, their perceived level of subject knowledge at the start of the SKE course, their reasons and motivations for
taking the SKE course and entering the teaching profession and their expectations for the future. At the end of the SKE course, another survey followed-up on this survey to
measure changes in perception, experiences and levels of confidence in subject knowledge. This section provides the results of the two surveys.
2.1 Profile of Survey Respondents
There were 159 responses to the SKE Beginning of Course survey. In previous years, the survey was conducted over two rounds to allow for courses starting at different times of the year. However, due to changes in contractor conducting the third year of the evaluation and timing of the contracting activity, it was agreed to use one round for the Beginning of Course survey as timing of further rounds did not fit with the start of SKE courses. Responses to the Beginning of Course survey came from trainees of 19 SKE
providers as shown in Appendix1.
There were 435 respondents to the End of Course SKE survey from trainees of 39 SKE providers. These are shown in Appendix 2. Note that the students completing the End of Course survey were not necessarily the same students who completed the Beginning of Course survey.
2.1.1 Characteristics of SKE students
Beginning of Course
Of the 159 respondents to the Beginning of Course survey, 64% (100) were female, 37% (57) were male. This matches the profile of teacher trainees on secondary ITT
programmes well - in the 2011/12 secondary ITT cohort, 38% were male and 62% female.1 There were some differences across the subjects being studied, in that
chemistry SKE courses appear to attract more female students compared to other SKE subjects.
1
ITT Census 2011/12 data.
15
Figure 1: Proportions of male and female SKE students by subject - Beginning of Course Survey 2011/12
The majority, 87% (137), classed their ethnic background as White (7% Asian or Asian British, 3% Black and Black British). Again, this profile replicates that of the ITT Census data for 2011/12 where 88% of teacher trainees were classified as ‘Non-BME entrants on
ITT programmes’2
.The majority of respondents were under 35 years old although older
age groups were represented in the sample, with 5% being 50 years or older.
Table 12Age of SKE students - Beginning of Course Survey 2011/12
Age
No. Per cent
under 25 69 43.4
25-29 30 18.9
30-34 18 11.3
35-39 15 9.4
40-44 11 6.9
45-49 8 5.0
50-54 7 4.4
55 or over 1 0.6
2
ITT Census 2011/12 data.
http://www.education.gov.uk/schools/careers/traininganddevelopment/initial/b00204146/itt-data-and-surveys/trainee-census
18.8% 40.0%
52.8%
81.3% 60.0%
47.2%
0% 20% 40% 60% 80% 100%
Chemistry Mathematics Physics
16
End of Course
Of the respondents to the End of Course survey, 57% (246) were female and 43% (189) were male – whilst the proportions are more fairly distributed, this profile does not reflect the profile of the ITT cohorts as well (the 2011/12 Census data reports 38% were male and 62% female). As with the results of the Beginning of Course survey, there were some differences across the subjects being studied, in that chemistry SKE courses appear to attract more female students compared to other SKE subjects.
Figure 23Proportions of male and female SKE students by subject - End of Course Survey 2011/12
The majority, 79% (344), classed their ethnic background as White (11% Asian or Asian British, 7% Black and Black British) – these are similar to the Beginning of Course sample and therefore the ITT profiles shown in the ITT Census data (see above). The majority of respondents were under 35 years old although older age groups were represented in the sample, with 4% being 50 years or older.
32.6% 45.5%
50.0%
67.4% 54.5%
50.0%
0% 20% 40% 60% 80% 100%
Chemistry Mathematics Physics
17
Table 24Age of SKE students - End of Course Survey 2011/12
Age
No. Per
cent
under 25 154 35.4
25-29 103 23.7
30-34 47 10.8
35-39 45 10.3
40-44 39 9.0
45-49 31 7.1
50-54 13 3.0
55 or over 3 0.7
2.1.2 SKE subject and length of course
Beginning of Course
The Beginning of Course survey respondents represents a range of SKE subjects. Although the survey was sent to students via providers of a range of SKE courses, the focus was on obtaining responses from chemistry, mathematics and physics SKE students. Similar to the profile of the SKE cohort as a whole, mathematics was the most popular subject (48%, 76 respondents), followed by physics (23%, 36) and chemistry
(21%, 33)3. A minority were on design and technology (5%) and modern languages (4%)
SKE courses. Caution is advised when interpreting some of the findings in this chapter where analysis is provided across subjects since for chemistry and physics, counts are relatively low.
3
18
Figure 35Survey response by SKE subject - Beginning of Course Survey 2011/12
End of Course
The End of Course survey included a slightly wider range of SKE subjects, such as ICT and other science although their numbers were low. Similar proportions (to the Beginning of Course survey) of chemistry, mathematics and physics SKE students were
represented in the sample – again, these are similar to the SKE cohort as a whole although there are higher representations of mathematics students by 14 percentage points.
Figure 46Survey response by SKE subject - End of Course Survey 2011/12
Respondents to the Beginning of Course survey said that they were enrolled on longer SKE courses of 28 weeks and over, with the majority enrolled on 36 week courses. This
Mathematics 48.1% Physics
22.8%
Chemistry 20.9%
Modern Languages
3.8%
Design and Technology
4.4% Other
8.2%
Mathematics 51.0% Physics
23.9% Chemistry
21.8%
Other Science 0.2%
Modern Languages 1.6%
ICT 0.9% Design and Technology 0.2%
Other 0.2% Other
19
pattern was shown across all subjects although the students studying chemistry appear to be more likely to enrol on 36 week courses (refer to Appendix 1). The prevalence of longer courses could be due to the timing of this survey since it was implemented once before Christmas and therefore, did not coincide with later course start dates.
Table 37Length of SKE course – Beginning and End of Course Surveys 2011/12
Length of the course – Beginning of Course Survey
Length of the course – End of Course Survey
No. Per
cent No.
Per cent
16 weeks - - Less than 1 month 38 8.7
20 weeks - - 1 to 3 months 28 6.4
24 weeks - - 4 to 6 months 201 46.2
28 weeks 19 12.1 Over 6 months 168 38.6
32 weeks 13 8.3
36 weeks 125 79.6
other - -
At the end of the SKE course, students were asked a slightly revised question to aid completion of the question and later analysis. This revealed that the most students (85%, 369) were enrolled on courses of 4 or more months in duration, with 4 to 6 months being most popular. There did not appear to be any significant differences in length of course according to SKE subject although there were higher proportions of chemistry students on short courses of less than one month (19%, compared to 6% for physics and 6% for mathematics).
Students were also asked to reflect on the length of the course and how appropriate they felt it was. Overall, 85% (369) of SKE End of Course survey respondents felt that the length of the course was about right, 10% (43) felt it was too short and 5% (22) felt it was too long – these proportions were also reflected within the different subject areas.
2.2 Student Background
20
2.1.3 Previous studies
A level study
Just over half (58%, 90) of SKE Beginning of Course survey respondents said that they had an A level in their SKE subject. Comparing across subjects, the largest proportion of students with an A level in the same subject as their SKE course was found in
mathematics SKE students (67%, 50). Physics SKE students were least likely to have an A level in the same subject (42%, 15) compared to mathematics and chemistry (55%, 18).
Figure 58Proportion of SKE students holding an A level in their SKE subject - Beginning of Course Survey 2011/12
Bachelor degree study
The majority of SKE students (94%, 150 respondents) had a Bachelor Degree
(regardless of the subject), with a high proportion having studied biological sciences for their degree. The five most popular subject areas were:
Biological sciences (36%, 54).
Physical sciences (11%, 16).
Business and administration studies (9%, 14).
Social studies (7%, 11).
Law (6%, 9).
Only 2% (3 respondents) had a mathematical sciences degree. These results were further explored according to the SKE course that students were enrolled on and some slight differences were noted across the subject areas. The top three main subject areas of study for bachelor degrees according to the SKE course are shown in the table below (it should be noted that biological sciences showed a higher proportion than any other subjects overall).
54.5%
66.7%
41.7%
56.7% 45.5%
33.3%
58.3%
43.3%
0% 20% 40% 60% 80% 100% 120%
Chemistry Mathematics Physics Total
21
Table 49Top 3 bachelor degree subjects of SKE students - Beginning of Course Survey 2011/12
Chemistry SKE students Mathematics SKE students Physics SKE students
Biological Sciences (58%) Biological Sciences (19%) Biological Sciences (56%)
Physical Sciences (16%) Business and Administration
Studies (17%) Physical Sciences (25%)
Law (7%) Social Studies (16%)
Computer Science,
Engineering and Technology and Law (6%)
The subject areas previously studied at degree level is overall reasonably varied, with mathematics SKE students seemingly entering SKE courses with the widest
backgrounds (wider range of subjects studied at degree level previously).
Of those with a minor component to their bachelor degree, for 22% (8), biological sciences was the minor component, whilst 17% (6) had social studies as a minor component and 11% (4) had creative arts and design or law.
The SKE students had attended a range of universities for their undergraduate study. Students were able to select their previous place of study from a list of institutions. Where their institution did not appear on the list, they were able to select ‘other’. A total of 145 students responded to this question, giving the name of 57 institutions plus 11 others.
The results were specifically analysed to form a profile of the academic background of students doing SKE courses on the basis of the year that their institution gained university status. The main classification is based on whether an institution gained university status prior to the Further and Higher Education Act in 1992, or in the periods after.
The term ‘post 1992 institutions’ specifically relates to any of the former polytechnics, central institutions or colleges of higher education that were given university status by John Major's government in 1992. The term also refers to colleges that have been granted university status since that period. ‘Pre 1992 institutions’ are essentially those institutions that gained university status prior to this act.
22
Figure 610University type attended for bachelor degree by SKE subject - Beginning of Course Survey 2011/12
Overall, the balance of SKE students completing their bachelor degrees at pre or post 1992 institutions was fairly evenly split – 43% (62) came from pre 1992 institutions and 50% (72) came from post 1992 institutions, just 8% were from outside England (other).
Although only slightly higher proportions of SKE students appear to have studied for their bachelor degrees in post 1992 institutions compared to pre 1992 institutions, there does not appear to be a significant difference between students on different SKE courses. Only slightly higher proportions of students on chemistry SKE courses (57%) studied for their bachelor degrees in post 1992 universities compared to physics (44%) and
mathematics (44%) SKE students.
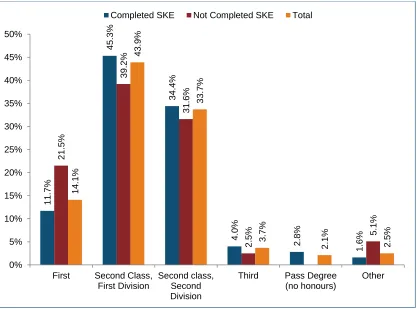
In terms of attainment at degree level, nearly half of the respondents (47%, 70) achieved a second class, second division (2:2) degree qualification, 40% (60) achieved second class, first division (2:1) and 11% (16) achieved a first-class degree. For comparison, the ITT Census reports that in 2011/12, 63% of postgraduate entrants held a 2:1 or better UK
degree (this compares to 51% of the SKE survey sample).4
4
ITT Census 2011/12 data.
http://www.education.gov.uk/schools/careers/traininganddevelopment/initial/b00204146/itt-data-and-surveys/trainee-census
39.3% 45.6%
47.2% 43.1%
57.1% 44.1% 44.4% 49.3%
3.6% 10.3%
8.3% 7.6%
0% 10% 20% 30% 40% 50% 60% 70% 80% 90% 100%
Chemistry Mathematics Physics Total
23
Further analysis of bachelor degree classification by subject does not reveal any
considerable differences although out of those studying a physics SKE, there seems to be more tendency to have a first or 2:2 classification compared to other subjects.
Figure 711Bachelor degree classification by SKE subject - Beginning of Course Survey 2011/12
Postgraduate study
Beyond undergraduate level, one-fifth of the students (21%, 33) had a postgraduate qualification. There does not appear to be any differences in the proportion of students holding a postgraduate qualification according to their SKE subject of study. For the postgraduate qualifications held by SKE students, the main subjects of study were biological sciences (28%, 9), education (22%, 7) and physical sciences (13%, 4). Analysis across subjects shows similar patterns as with degree subject although the numbers are particularly small so caution is advised when interpreting these figures:
Students on a chemistry SKE course are more likely to have a postgraduate
qualification in biological sciences (57%, 4).
Students on a mathematics SKE course were more likely to have a postgraduate
qualification in education (35%, 6) or biological sciences (18%, 3).
Students on a physics SKE course were more likely to have a postgraduate
qualification in biological sciences or physical sciences (29%, 2).
2.1.4 Previous experience and professional status
Membership of professional organisations
Just 8% (13 respondents) stated that they were members of a professional body or organisation and this average is fairly evenly represented across the subject areas.
3 .2 % 4 8 .4 % 4 8 .4 % 8. 7% 4 2 .0 % 4 4 .9 % 2. 9% 1 .4 % 1 6 .7 % 2 7 .8 % 5 2 .8 % 2 .8 % 1 0 .7 % 4 0 .3
% 46
.3 % 0 .7 % 1 .3 % 0 .7 % 0% 10% 20% 30% 40% 50% 60%
First Second Class, First Division
Second Class, Second Division
Third Pass Degree (no honours)
24
Examples of such organisations included the Association of Chartered Certified
Accountants, British Pharmacological Society, the Chartered Institute of Environmental Health and the Royal society of Chemistry.
Previous careers
Nearly half of the survey respondents (47%, 73) considered themselves to have had a career previous to starting the SKE course, 54% (84) did not have a previous career. Looking at the different subject areas, only those on a chemistry SKE course appear to be less likely than others to have had a previous career (27% of chemistry SKE students said they had a previous career, compared to 55% of mathematics SKE students and 50% of physics students).
Table 512Proportion of SKE students with a previous career by subject - Beginning of Course Survey 2011/12
Total Mathematics Physics Chemistry Other
No. Per cent No. Per cent No. Per cent No. Per cent No. Per cent
Yes 73 46.5 41 54.7 18 50.0 9 27.3 6 42.9
No 84 53.5 34 45.3 18 50.0 24 72.7 8 57.1
Total 157 75 36 33 14
Those who have had a previous career before starting the SKE course were able to provide details of their job role. Over 70 students provided details as to the nature of their previous career which appears to be wide – examples include Administration Assistant, Accountant, Classroom Assistant, Cover Supervisor, Crime Scene Investigator,
Customer Service Assistant, Driving Instructor, Farm Labourer, Financial Adviser, IT Manager/Technician, Learning Support Assistant, NHS Management, Policy Researcher, Social Worker, Veterinary Nurse, Warehouse Supervisor.
All job roles provided were coded for the purposes of analysis according to the Standard Industrial Classification Codes (SIC, 2007), as provided by the Office of National
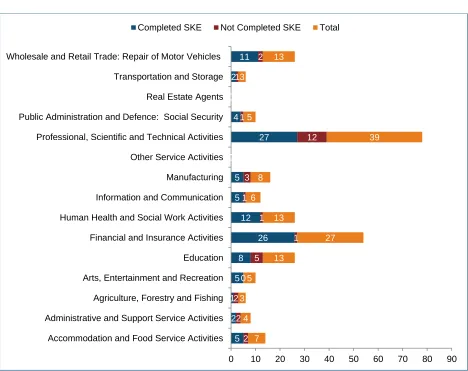
Statistics (ONS). The findings reflect the wide range of backgrounds that SKE students bring to their teacher training. Overall, the top four industries in which SKE students worked were:
Education (23%, 17).
Professional, Scientific and Technical Activities (21%, 15).
Financial and Insurance Activities (12%, 9).
Other Service Activities (12%, 9).
25
instances of very small counts in some industries when comparing across SKE subject areas. Nevertheless, the following patterns emerged:
The few chemistry SKE students are spread across four varied sectors with
slightly more in Professional, Scientific and Technical Activities (38%, 3).
There are higher proportions of mathematics SKE students from Education (31%,
13) and Financial and Insurance (17%, 7) sectors compared to other sectors and students on other SKE courses.
There are higher proportions of physics SKE students from Professional, Scientific
and Technical sectors compared to other sectors (33%, 6).
Figure 813Number of SKE students with a previous career by Standard Industrial Classification Codes (SIC, 2007) - Beginning of Course Survey 2011/12
Of those with a previous career, the most popular reasons for leaving their career were to work in a different environment (19%, 14) or a more positive environment (16%, 12). A smaller proportion (12%, 9) left their previous career because they became unemployed and of these, in the majority of cases (7 of 9), it was due to redundancy. Just under one-quarter of respondents (24%, 17) selected ‘other’ reasons and gave their own account of these.
1 2 1
3 1
2 1
2
13 7
2 2
5
6 3
1
1 1
1
3
6 2
1
2
0 2 4 6 8 10 12 14 16
Accommodation and Food Service Activities Administrative and Support Service Activities Agriculture, Forestry and Fishing Arts, Entertainment and Recreation Education Financial and Insurance Activities Human Health and Social Work Activities Information and Communication Manufacturing Other Service Activities Professional, Scientific and Technical Activities Public Administration and Defence: Social Security Real Estate Agents Transportation and Storage Wholesale and Retail Trade: Repair of Motor Vehicles
26
Table 614Reasons for leaving previous career - Beginning of Course Survey 2011/12
Why did you leave this career?
No. Per
cent
To spend more time with my family 6 8.2
I wanted to work in a different working environment 14 19.2
I was no longer enjoying my job 8 11.0
I wanted a more stable job 4 5.5
I became unemployed 9 12.3
I wanted to work in a more positive environment 12 16.4
Personal circumstances e.g. moving house 3 4.1
Other 17 23.3
Comparing the reasons for leaving a previous career across students on different SKE courses, of those who responded, the common reasons per subject area were:
Chemistry SKE students no longer enjoyed their job, wanted a more stable job or
left due to other reasons (22%, 2 respondents).
Mathematics students gave other reasons (28%, 11) or wanted to work in a
different working environment (23%, 9).
Physics students wanted to work in a different working environment (22%, 4).
27
Figure 915Reasons for leaving previous career by SKE subject - Beginning of Course Survey 2011/12
A range of reasons were provided under the ‘other’ option, such as; ‘I did not want to
retire as a [*] and wanted to do a job that required more knowledge and a higher
challenge’, ‘moving back to UK after a number of years living overseas’, ‘to further my
career’ … ‘wanted to return to university’ .
Experience of working in the school environment
The majority of respondents (81%, 129) had some form of experience of working in a school environment - 26% (42) had worked for a few weeks in a local school, 21% (34) had worked as a teaching assistant and 3% (5) had worked at a summer school. Just under one-fifth of respondents (19%, 30) had not worked in a school
environment before. Another 30% (48) had other experience which they explained to be one or two weeks in school for placements, as invigilators or offering personal tuition. Some had noted that they had more significant experience in schools, for
example; ‘20 weeks of teaching practice at a secondary school’, ‘as a maths teacher
in secondary school in Ghana, and also for a few days in my local school’, ‘as a
science teacher abroad’, ‘TA for 12 months followed by 5 years as cover supervisor in
a maths department’. Other examples include voluntary work, a weekly homework club, conducting workshops in secondary schools and observations days.
7.5% 5.6%
8.3%
11.1%
22.5% 22.2%
19.4%
22.2%
10.0% 5.6%
11.1%
22.2% 2.5% 5.6%
5.6%
15.0% 16.7%
12.5%
11.1% 15.0% 16.7%
15.3%
11.1% 11.1% 4.2%
22.2% 27.5%
16.7% 23.6%
0% 10% 20% 30% 40% 50% 60% 70% 80% 90% 100%
Chemistry Mathematics Physics Total
To spend more time with my family I wanted to work in a different working environment I was no longer enjoying my job I wanted a more stable job
28
Figure 1016Experience of working in the school environment by SKE subject - Beginning of Course Survey 2011/12
Across different SKE courses, there are slight differences in the nature of previous experience in schools. Chemistry SKE students seem to be more likely to have experience as a teaching assistant, whereas physics SKE students seem to be more likely to have experience for a few weeks in a local school and mathematics students gave other examples of experience in the school working environment.
2.3 Subject Knowledge
This section focuses on perceived levels of subject knowledge and confidence in subject knowledge that students have provided at the beginning and end of the SKE courses. It measures changes in subject knowledge and confidence in the subject by comparing the ratings given at different stages of the course.
2.3.1 Level of subject knowledge
Students rated their current subject knowledge on a scale of 1 to 10, with 10 representing the highest level. From the 150 Beginning of Course respondents providing a response to this question, it appears that students felt that their subject knowledge specific to the SKE course they were studying, was adequate – 41% (61) gave a rating of 7 or above and 73% (109) gave a rating of 5 or above. Further analysis across different SKE courses does not reveal significant differences in ratings of subject knowledge, particularly within the medium ratings (5 to 7) at which around half of respondents on each course have rated their knowledge. There are higher concentrations of chemistry students rating at 5 and 6 and physics students
36.4% 22.4% 5.6%
20.9%
21.2% 19.7%
41.7% 26.6%
3.0% 3.9%
2.8% 3.2%
24.2% 32.9%
30.6% 30.4%
15.2% 21.1%
19.4% 19.0%
0% 10% 20% 30% 40% 50% 60% 70% 80% 90% 100% Chemistry
Mathematics Physics Total
Yes - as a teaching assistant Yes - for a few weeks in my local school Yes - on a summer school Yes - other
29
rating at either 4 or 7 whilst ratings from mathematics students appear to be more varied.
Figure 1117 Level of current subject knowledge by SKE subject - Beginning of Course Survey 2011/12 6 .5 % 9 .7 % 3 .2 % 2 2 .6 % 1 9 .4 % 1 6 .1 % 1 6 .1 % 3 .2 % 3 .2 % 4. 1% 1 3 .7 % 1 2 .3 % 19 .2 % 1 1 .0 % 2 3 .3 % 13 .7 % 1 .4 % 1 .4 % 3 .1 % 12 .5 % 1 8 .8 % 9 .4 % 15 .6 % 2 5 .0 % 1 2 .5 % 3 .1 % 0% 5% 10% 15% 20% 25% 30%
Rating of current subject knowledge at the beginning of the SKE course Chemistry Mathematics Physics
1. Lowest 10. Highest
At the end of the course, students were asked to reflect on their level of subject knowledge at the beginning of the course and provide a rating again. It appears that students’ perceived level of subject knowledge at the beginning of the course was lower than they had previously indicted. Whereas at the beginning of the SKE course, 41% (61) gave a rating of 7 or above for their level of subject knowledge, at the end of the course, this rating was just 16% (69). Indeed, nearly half of the End of Course survey respondents (49%, 214) gave a rating of 4 or below.
30
Figure 1218Level of subject knowledge at the beginning of the course by SKE subject - End of Course Survey 2011/12
In order to assess the impact of the SKE course in terms of subject knowledge enhancement, students also rated their level of subject knowledge at completion of the course. A clear pattern has emerged, with an overwhelming majority of students rating their subject knowledge much higher by the end of the course - 94% (407) of respondents rated 7 or above and 86% (373) rated 8, 9 or 10.
Figure 1319 Level of subject knowledge at the end of the course by SKE subject - End of Course Survey 2011/12
A further question about subject knowledge assessed students’ perception of the level of knowledge they felt they would require to successfully complete the PGCE. Again they were asked to rate this level using the scale of 1 (low level of subject knowledge) to 10
8 .4 % 1 5 .8 % 2 0 .0 % 1 4 .7 % 1 3 .7 % 1 7 .9 % 5 .3 % 2 .1 % 1 .1 % 1 .1 % 7 .2 % 1 4 .9 % 1 6 .2 % 2 3 .9 % 1 8 .0 % 1 2 .2 % 6 .3 % 0 .5 % 0 .9 % 3 .8 % 1 3 .5 % 2 3 .1 % 2 4 .0 % 1 8 .3 % 3 .8 % 9 .6 % 1 .9 % 1 .0 % 1 .0 % 0% 5% 10% 15% 20% 25% 30%
Rating of current subject knowledge at the beginning of the SKE course Chemistry Mathematics Physics
1. Lowest 10. Highest
1 .1 % 2 .1 % 5 .3 % 1 2 .6 % 3 4 .7 % 36 .8 % 7 .4 % 0 .5 % 0 .5 % 0 .5 % 0 .5
% 4.1% 8
.1
%
3
2
.9
% 40
.1 % 1 3 .1 % 1 .0 % 1 .0 % 1 .0 % 2 .9 % 3. 8% 5 5 .8 % 2 6 .9 % 7 .7 % 0% 10% 20% 30% 40% 50% 60%
Rating of subject knowledge at the end of the SKE course Chemistry Mathematics Physics
31
(high level of subject knowledge). As illustrated in the figure below, students clearly felt that high levels of subject knowledge were required. Overall, 94% (406) of the
respondents rated the subject knowledge requirement as 7 or above. The chart also suggests that physics students are more likely to rate the requirement at level 8, whereas more mathematics students rated at level 9.
Figure 1420Level of subject knowledge required to successfully complete the PGCE by SKE subject - End of Course Survey 2011/12
Comparing the differences in perceived level of subject knowledge for students on shorter and longer courses, does not reveal any considerable differences. Whilst one might expect those on shorter SKE courses to have a higher starting point in terms of their subject knowledge, this was not clearly shown in the data. There appears, however, to be a slight trend in this direction when comparing the results of the End of Course survey – slightly higher proportions of students on longer courses rated their subject knowledge as low at the beginning of the course and the reverse pattern is seen for those rating their subject knowledge as high. When rating subject
knowledge at the end of the SKE course, as before, there were significant improvements observed in the ratings overall. The extent of change in subject knowledge through studying on the SKE course in relation to the length of SKE course cannot be clearly determined however since the ratings are based on perceptions at different course periods.
1
.1
%
2
.1
% 5.3
% 4 .3 % 1 4 .9 % 2 4 .5 % 2 5 .5 % 2 2 .3 % 0 .5 % 0 .5 % 1 .4 % 2. 7% 1 4 .5 % 2 2 .6 % 3 6 .2 % 2 1 .7 % 1 .0 % 1 .0 % 1 5 .5 % 3 8 .8 % 2 7 .2 % 1 6 .5 % 0% 5% 10% 15% 20% 25% 30% 35% 40% 45%
Rating of level of knowledge needed to successfully complete the PGCE Chemistry Mathematics Physics
32
Table 721Proportion (percentage) of SKE students rating their level of subject knowledge by length of SKE course - Beginning and End of Course surveys 2011/12
Beginning of Course survey -
current subject knowledge
End of Course survey - subject knowledge at the beginning
End of Course survey - subject knowledge at the end
Rating
(1-10) 28 weeks
32 weeks
36 weeks
less than 1 month
1 - 3 months
4 - 6 months
over 6 months
less than 1 month
1 - 3 months
4 - 6 months
over 6 months
Low
(1-4)
11.1 53.9 27.4 34.2 50.0 48.7 52.9 2.6 3.6 1.0 1.2
Medium
(5-7)
72.2 30.8 53.9 55.3 42.9 46.3 41.0 5.3 17.8 15.0 11.4
High
(8-10)
16.7 15.4 18.9 10.6 7.1 5.0 6.0 92.1 78.6 84.1 87.5
2.3.2 Level of confidence in the subject
A further question explored students’ confidence in their chosen subject. Confidence was measured on a scale ranging from 1 (not confident) to 10 (highly confident).
Of the Beginning of Course survey responses from 148 students, a similar pattern was found to level of knowledge in that nearly half of the students tended to rate their
33
Figure 1522Level of confidence in subject by SKE subject - Beginning of Course Survey 2011/12
This process was repeated in the End of Course survey to establish if there had been any change in confidence in their chosen subject by completing the course. Of the 435 respondents answering this question, a majority (89%, 389) rated their confidence at 7 or above (78% rated at 8, 9 or 10). There has therefore been a clear improvement in the level of confidence in their chosen subject.
Figure 1623Level of confidence in subject by SKE subject - End of Course Survey 2011/12
Further confirmation of this was provided by an additional question which asked whether students’ level of confidence in their chosen subject had changed since starting the SKE course. The majority, 95% (413) said that it had changed – across the subjects, this was 97% of chemistry students, 94% of mathematics and 95% of physics students.
Furthermore, students were able to provide an explanation of how their level of
confidence in their chosen subject had changed since starting the SKE course. All but
0 .0 % 3 .6 % 7 .1 % 1 4 .3 % 2 5 .0 % 7 .1 % 1 0 .7 % 2 5 .0 % 3 .6 % 3 .6 % 0 .0 % 4 .1 % 1 2 .2 % 1 0 .8 % 1 7 .6 % 9. 5% 1 8 .9
% 21.6
% 2 .7 % 2 .7 % 2 .9
% 5.9
% 8.8
% 1 7 .6 % 5 .9 % 1 7 .6 % 1 7 .6 % 1 1 .8 % 8 .8 % 2 .9 % 0% 5% 10% 15% 20% 25% 30%
Rating of current confidence in SKE subject at the beginning of the SKE course
Chemistry Mathematics Physics
1. Lowest 10. Highest
1
.1
% 3.2%
1 2 .6 % 8 .4 % 3 0 .5 % 3 3 .7 % 1 0 .5 % 0 .5 % 0 .9 % 0 .5 % 1 .4
% 5.4
% 1 1 .3 % 2 5 .7 % 3 5 .1 % 1 9 .4 % 1 .9 % 2 .9 % 3 .8 % 1 5 .4 % 4 0 .4 % 2 6 .0 % 9 .6 % 0% 5% 10% 15% 20% 25% 30% 35% 40% 45%
Rating of confidence in SKE subject at the end of the SKE course Chemistry Mathematics Physics
34
one of the respondents (in total, 404 students responded) to this question said that the SKE course had had a positive impact on their level of confidence, with the majority of these saying it as significantly, greatly or much improved. In terms of the ways that it had improved their confidence, of those who provided information, these were the key factors they cited:
More confident in their ability to teach their specialist subject and to teach to a
higher level (e.g. some students referred to increased confidence to teach to A
level); ‘Before I started the course, I certainly wasn't capable of A level standard
maths. I now feel able to attempt any mathematical problem. GCSE level is a breeze. I feel very confident in my ability to teach at a GCSE level’.
Increased confidence in their knowledge and understanding of the subject
including better able to recall information accurately; ‘I am happier recalling
information without having to check it from a source first. I can explain in detail certain processes, using different comparisons etc for different levels’.
Increased confidence in their ability to convey topics more clearly and better able
to explain complex concepts and theories and to answer questions;’ Now I am
confident I would be able to answer most of the physics related questions they could ask me, or at least deal with it if I did not know the answer’.
More confident in the practical aspects of teaching including standing in front of
classes and laboratory and practical experiment work; ‘I have become more
confident in my ability to teach through working with others on the course’. Of the students who felt that their confidence had not changed since starting the SKE course, some were able to provide reasons for this (20 respondents overall, 6%):
The level of the course was given as the reason by around five respondents – all
but one of those thought it too high but one student felt it was not in-depth enough.
One student felt that it was due to poor communication and quality of teaching on
the course.
Just under ten respondents said that they had a good standard of subject
knowledge already and the course did not provide them with anything new.
A couple of students thought that the course had not met their expectations in
terms of subject content e.g. one student thought it would cover topics up to A level.
Two science students thought that the course had not covered their main subject,
biology.
2.3.3 Confidence to teach the subject
35
lower end of the scale (1 to 4) and slightly lower promotions rate at the higher end of the scale (8 to 10) compared to the other subjects.
Figure 1724Level of confidence in teaching the subject by SKE subject - Beginning of Course Survey 2011/12
2.4 Motivations and Expectations
2.4.1 Motivations for teacher training and subject specialisation
Motivation for entering the teaching profession
During the Beginning of Course survey, SKE students gave their reasons for wanting to become a teacher. The most common were:
To make a difference to young people (30%, 48).
For fulfilment in a second career and for the opportunity to influence young minds
(28%, 44).
Always wanted to be a teacher (19%, 30).
3 .6 % 1 0 .7 % 3 .6 % 7 .1 % 1 0 .7 % 2 1 .4 % 1 0 .7 % 2 1 .4 % 1 0 .7 % 1 .4 % 6 .8 % 1 1 .0 % 8 .2 % 8 .2 % 1 3 .7 % 1 7 .8 % 1 3 .7 % 1 3 .7 % 5 .5 % 3 .0 % 9 .1 % 6 .1 % 1 2 .1 % 9 .1 % 2 1 .2 % 1 8 .2 % 15 .2 % 6 .1 % 0% 5% 10% 15% 20% 25%
Rating of current confidence in SKE subject at the beginning of the SKE course
Chemistry Mathematics Physics
36
Table 825Motivations for entering the teaching profession - Beginning of Course Survey 2011/12
What is your motivation for wanting to be a teacher?
No. Per cent
I want to make a difference to young people 48 30.4
I am looking for fulfilment in a second career and relish the opportunity to
influence young minds 44 27.8
I have always wanted to be a teacher 30 19.0
I enjoy working with young people 23 14.6
It seemed a safe option during a recession 4 2.5
Other 4 2.5
The holidays 3 1.9
The pay 2 1.3
I know people who teach and they seem to enjoy it 1 0.6
Of the four students who had selected ‘other’, the reasons provided were enjoyment of the school atmosphere, promotion of science, contributing back into society and wanting a good profession and to refocus on science:
After some personal circumstances I did not want to pursue a career in law (my first degree) but still wanted a good profession. I had always enjoyed working with young people and I loved science at school especially
chemistry so the SKE course was an excellent opportunity for me to correct my mistake of not doing science at university level in the first place.
In terms of choosing a specific subject for their teacher training, the top three reasons were:
Enjoyment of the subject (35%, 55).
To pass on enthusiasm for the subject to young people (25%, 40).
37
Table 926Motivations for choosing to teach the subject - Beginning of Course Survey 2011/12
What is the main reason for choosing to teach this subject?
No. Per
cent
I enjoy the subject 55 34.6
I want to pass on my enthusiasm for this subject to young people 40 25.2
Better job prospects 24 15.1
I can’t teach the subject I studied for my degree and this is the next best
option 17 10.7
I always wanted to study this subject but was unable to study it to degree
level 6 3.8
It is a natural progression from my previous degree 6 3.8
Other 5 3.1
It was recommended to me by family and/or friends 3 1.9
The golden hello incentive 2 1.3
It was recommended to me by a careers advisor 1 0.6
Teachers I know recommended this subject - -
38
Table 1027Motivations for teaching the subject by SKE subject - Beginning of Course Survey 2011/12
Chemistry SKE students Mathematics SKE students Physics SKE students
I can’t teach the subject I studied for my degree and this is the next best option (33%)
I enjoy the subject (47%) Better job prospects (36%)
I want to pass on my
enthusiasm for this subject to young people (30%)
I want to pass on my
enthusiasm for this subject to young people (24%)
I enjoy the subject (19%)
I enjoy the subject (24%) Better job prospects (9%)
I want to pass on my
enthusiasm for this subject to young people (19%)
Better job prospects (9%) Other (5.3%)
I can’t teach the subject I studied for my degree and this is the next best option (13.9%)
Other reasons were also provided in the open text response options:
‘Getting paid to learn’.
‘Have completed 300 credits in a Geosciences Degree with The Open University, this has involved a significant amount of chemistry. Linking this with my past career I feel teaching is a logical choice’.
‘I believe it is one of the most important subjects for children to learn’.
‘I have always enjoyed maths and wanted to teach. Having worked in a secondary school for 7.5 years and seeing staff come and go in the maths department I decided with my age then it was a shortage area so would make me more employable’.
‘I took the wrong subject to degree level, and maths has always really been my subject of choice’.
39
Table 1128Reasons for enrolling on the SKE course by SKE subject - Beginning of Course Survey 2011/12
Reasons for enrolling on the SKE course Chemistry Per cent
Mathematics Per cent
Physics Per cent
It was a condition for my PGCE place 43.8 42.7 54.3
I didn’t feel my subject knowledge was sufficient 18.8 28.0 20.0
I wanted to learn more about how to teach the subject
before starting my PGCE 18.8 13.3 11.4
I’m not very confident about my knowledge in this subject and wanted to study more before starting my PGCE
15.6 10.7 11.4
I wasn’t very good at this subject at school, and wanted
to learn more before starting my PGCE 3.1 0.0 0.0
40
Figure 1829Reasons for enrolling on the SKE course by length of course - Beginning of Course Survey 2011/12
2.4.2 Expectations of the SKE course
Overall, expectations were varied at the beginning of the course. Over one-quarter of respondents (26%, 41) expected it to be a refresher to help them gain confidence in their chosen subject and 25% (39 respondents) expected to study the equivalent of the first year of a Bachelor Degree in the subject. Just over one-fifth (21%, 34) expected to study the equivalent of an A level in the subject. A relatively high proportion (18%, 29) stated that they expected to learn more about how to teach the subject.
3 6 .8 % 5 8 .3 % 4 7 .2 % 4 6 .8 % 15 .8 % 4 1 .7 % 2 2 .8 % 2 3 .4 % 5 .3 % 3 .3 % 3 .2 % 0 .8 % 0 .6 % 31 .6 % 1 3 .0 % 1 4 .3 % 1 0 .5 % 8 .3
% 12.2
% 1 1 .7 % 0 .8 % 0 .6 % 0% 10% 20% 30% 40% 50% 60% 70%
28 weeks 32 weeks 36 weeks Total
It was a condition for my PGCE place
I didn’t feel my subject knowledge was sufficient
41
Table 1230Expectations of the SKE course - Beginning of Course Survey 2011/12
What did you expect from the course?
No. Per
cent
To study the equivalent of an A level in the subject 34 21.4
To study the equivalent of a first year of a bachelor degree (undergraduate
certificate) in the subject 39 24.5
To study the equivalent of a bachelor’s degree in the subject - -
To build on the knowledge in the subject I already have from my degree 6 3.8
To learn more about how to teach the subject 29 18.2
A refresher course to help me regain my confidence in the subject 41 25.8
Other 11 6.9
42
Figure 1931Expectations of the SKE course by length of course - Beginning of Course Survey 2011/12
There were differences observed across the different SKE courses. For instance, those on a physics SKE course were more likely to expect to study the equivalent of an A level in the subject, whereas, those on the chemistry SKE course were more likely to expect to study the equivalent of the first year of a bachelor degree and those on the mathematics SKE course were more likely to expect it to be a refresher to help them regain confidence in the subject.
Figure 2032Expectations of the SKE course by SKE subject - Beginning of Course Survey 2011/12
15 .8 % 3 8 .5 % 2 0 .8 % 2 1 .7 % 5 .3 % 2 9 .6 % 2 4 .2 % 4 .8 % 3 .8 % 2 1 .1 % 1 5 .4 % 1 8 .4 % 1 8 .5 % 5 2 .6 % 3 0 .8 % 2 0 .8 % 25 .5 % 5 .3 % 1 5 .4 % 6 .4 % 7 .0 % 0% 10% 20% 30% 40% 50% 60%
28 weeks 32 weeks 36 weeks Total
To study the equivalent of an A level in the subject
To study the equivalent of a first year of a bachelor degree (undergraduate certificate) in the subject To study the equivalent of a bachelors degree in the subject
To build on the knowledge in the subject I already have from my degree To learn more about how to teach the subject
A refresher course to help me regain my confidence in the subject Other 18.2% 17.1% 36.1% 21.5% 36.4% 14.5% 27.8% 24.7% 9.1% 1.3% 2.8% 3.8% 15.2% 23.7% 13.9% 18.4% 18.2% 36.8% 16.7% 25.3% 3.0% 7.9% 2.8% 7.0%
0% 20% 40% 60% 80% 100%
Chemistry Mathematics Physics Total
To study the equivalent of an A level in the subject
To study the equivalent of a first year of a bachelor degree (undergraduate certificate) in the subject To study the equivalent of a bachelors degree in the subject
To build on the knowledge in the subject I already have from my degree To learn more about how to teach the subject
43
At the end of the SKE course, students were asked what they felt they had learned from the course and whether this was what they had expected to learn. For
comparison, results are provided below.
Figure 2133What students have learned from the SKE course by subject - End of Course Survey 2011/12
The majority (61%, 267) said that they had learned the equivalent of key stage 5 (A level) by completing the SKE course and just under one-fifth (19%, 82) of the End of Course survey respondents stated that they had learned equivalent to key stage 4 (GCSE). Some (14%, 61) felt that they had been working to first year undergraduate level while only a small minority felt that what they had learned was equivalent to higher levels than this.
A small number (13) of the respondents offered examples of what they had learned if they had selected ‘other’ rather than the options provided above. Their responses
ranged from key stages 4 and 5 to ‘Beyond A level, not quite 1st yr undergrad and
second year undergraduate’.
Some however, did not feel that they benefitted from the course:
My chemistry subject knowledge was already at and above most of the levels taught. I don't know what level we have been working at. Most of it has been above key stage 4 level, but almost none of it has been tailored toward the knowledge that a classroom teacher will need, and personally I feel it has been largely irrelevant 2 9 .5 % 5 8 .9 % 9 .5 % 2 .1 % 1 2 .2 % 6 0 .4 % 1 9 .4 % 2 .3 % 1 .4 % 4 .5 % 2 0 .2 % 7 0 .2 % 8 .7 % 1 .0 % 0% 10% 20% 30% 40% 50% 60% 70% 80% Equivalent to key stage 4
(GCSE)
Equivalent to key stage 5 (A
Level) First year undergraduate level or equivalent Graduate level or equivalent Post graduate study level or
equivalent
44
In some areas I have learnt to A level, others have been to a lower level than this due to the staff having a low than A level knowledge. The course obviously aimed to deliver to A level but failed on occasion
I feel I have learned nothing to equip me to teach secondary school maths. One of the modules we took was second year degree level but many of my SKE class failed this. I am no more equipped to teach secondary school maths than I
was before joining the course. It has been a waste of a year.
Looking across the different SKE courses, there are higher proportions of
mathematics SKE students who felt that they had learned their subject to the higher levels – 23% said that what they had learned was to first year undergraduate, graduate or postgraduate levels (compared to about 9% of chemistry and physics students).
Comparison of what students felt they had learned by the length of their SKE courses shows that key stage 5 is the most common level of learning among courses, apart from where they are less than one month in duration. Shorter courses of less than one month, according to SKE students, are more often pitched to key stage 4. The figure below also shows that longer courses which are 4 months or over in duration, are more likely to include elements of first year undergraduate levels of learning or higher. Note that some of the counts are low so these findings should be viewed with caution.
Figure 2234What students have learned from the SKE course by length of course - End of Course Survey 2011/12
68.4% 17.9%
15.9% 11.3%
18.9%
31.6%
78.6% 71.1% 53.6%
61.4%
10.0%
24.4% 14.0%
1.8% 0.7%
3.6% 2.5%
4.2% 3.0%
0% 10% 20% 30% 40% 50% 60% 70% 80% 90%
Less than 1 month 1 to 3 months 4 to 6 months Over 6 months Total
45
Of the 435 End of Course survey respondents, 86% (375), reported that what they had learned is what they had expected to learn on the course. Of the smaller proportions who felt that the course had not met their expectations, half of them (50%, 30) expected to learn the equivalent to key stage 5 (A Level). Similar proportions were found across the different subjects although slightly higher
proportions of mathematics students expected to learn equivalent to the first year of an undergraduate degree.
Table 1335Expectations of the SKE course - End of Course Survey 2011/12
Total Chemistry Mathematics Physics
No. Per
cent No.
Per
cent No. Per cent No.
Per cent
Equivalent to key stage 4
(GCSE) 14 23.3 3 25.0 9 24.3 2 22.2
Equivalent to key stage 5 (A
Level) 30 50.0 5 41.7 18 48.6 5 55.6
First year undergraduate level
or equivalent 12 20.0 2 16.7 9 24.3 1 11.1
Graduate level or equivalent - - - -
Post graduate study level or
equivalent - - - -
Other 4 6.7 2 16.7 1 2.7 1 11.1
Total 60 12 37 9
2.5 Barriers Experienced
This section explores the range of barriers that were perceived and/or experienced by SKE students. During the Beginning of Course survey, respondents were asked to indicate which barriers from a list of options, would be most likely to prevent them from enrolling on the SKE course. Respondents were able to select as many options as they wished. The most common barriers were associated with course
expenditure:
Fees for the course (39%, 123).
Reduced bursary (37%, 119).
46
proportion of responses and slightly higher for chemistry students compared to other subjects. Access to student loans seemed to be slightly more important as a barrier to mathematics students and less so for physics students.
It should be noted that these were perceived potential barriers that could have an impact should changes be made to current policy or practices. The findings suggest that should fees be introduced to SKE courses or bursaries reduced, this could have an impact on the number of enrolments.
Figure 2336 Barriers to enrolment on the SKE course by SKE subject - Beginning of Course Survey 2011/12
A similar question was asked at the end of the SKE course. Overall, a large majority (85%, 371) had not experienced any barriers to completing the course. Of the small proportion who had experienced barriers, 22% (21) noted barriers in relation to support they had received during the course and 15% (14) had noted barriers in relation to funding. The term funding could have been interpreted in a number of ways. The open responses (and interviews) suggest that respondents’ are referring to more general costs of being involved in training programmes (e.g. buying study
materials, travel). 2 9 .4 % 3 9 .4 % 4 0 .0 % 3 7 .4 % 4 4 .1 % 3 5 .5 % 4 0 .0 % 3 8 .7 % 7 .4 % 9 .7 % 4 .3
% 7.9%
1 .5 % 1. 9% 1 .4 % 1 .6 % 1 6 .2 % 1 1 .6 % 1 1 .4 % 1 2 .6 % 1 .5 % 1 .9 % 2 .9 % 1 .9 % 0% 10% 20% 30% 40% 50% 60%
Chemistry Mathematics Physics Total
47
Table 737Barriers experienced whilst completing the SKE course - End of Course Survey 2011/12
Barriers to completing the SKE course
No. Per cent
Barriers relating to funding 14 15.1
Barriers relating to childcare 10 10.8
Barriers relating to support during the course 21 22.6
Barriers relating to location 13 14.0
Barriers relating to the length of course 10 10.8
Other 25 26.9
Nearly 27% (25) had selected other barriers. Of these, a number of suggestions were made as to what might act as a barrier:
Workload and fitting the course in with other com