Understanding costs of
A level provision via the
decision making
process behind class
sizes
Research report
March 2017
Isos Partnership - Natalie Parish, Verity
Prime and Simon Day
Contents
List of figures 3
List of tables 4
Executive summary 5
Section 1: Purpose of the research 12
Section 2: Methodology 14
Section 3: What does the data show about average class sizes, the factors which
influence these and the cost effectiveness of delivery? 17 Section 4: How institutions make decisions about class sizes 28 Section 5: Actions taken by providers to increase class size and reduce costs 40
Section 6: Future scenarios 51
List of figures
Figure 1: Summary of options that providers may wish to consider 10 Figure 2: Summary of options that the Department for Education and Education Funding
Agency may wish to consider 11
Figure 3: Largest, smallest and average A level classes in 2015 to 2016 17 Figure 4: Average class sizes across the six subjects explored in the research, 2015 to
2016 18
Figure 5: Percentage reduction in average class size from year 12 cohort in 2014 to 2015
to year 13 cohort in 2015 to 2016 21
Figure 6: Relationship between average class size in 2015 to 2016 and number of
learners 22
Figure 7: Relationship between average class size (2015 to 2016) and size of institution –
school sixth forms 23
Figure 8: Impact of subject breadth on average class sizes (2015 to 2016) 24 Figure 9: The relationship between average class size (2015 to 2016) and estimated
costs per A level student 25
Figure 10: Relationship between average class size (2014 to 2015) and average point
score per A level pupil 26
List of tables
Executive summary
Over the last three years, A level providers have experienced a period of considerable change. This change has centred on the way in which post-16 provision is funded, the levels of per-pupil funding and expectations around qualifications and how they are structured. In this context, in July 2015, the Department for Education (DfE)
commissioned Isos Partnership to undertake research to explore the decision-making process about A level class sizes and to understand the impact that class sizes have on the cost-efficiency of A level provision.
The research team undertook fieldwork visits to 24 A level providers, covering a mix of school sixth forms, sixth-form colleges, further education (FE) colleges and a university technical college (UTC).1 The sample, although small, was well-balanced in terms of
geography, size, deprivation and attainment. As well as the qualitative data gathered through the fieldwork, each provider completed a template setting out key information on the structure of A level provision in their institution, class sizes across six key subjects and the cost of delivering their A level provision. Both the qualitative and quantitative data have been used to inform the findings in this report.
Key findings
Understanding the variation in class sizes (sections 3.1 to 3.4)
• There was considerable variation in average A level class sizes across the institutions in our sample. At one end of the spectrum an FE college was delivering average classes of 24 students across all of its A level provision. At the other end of the spectrum a school sixth form had an average class of eight. The biggest difference can be seen between FE colleges and sixth-form colleges, which operate at an average class size of just under 19 students, and school sixth forms, which operate at an average A level class size of just under 11 for all A levels.
• There were also considerable differences in average class size in the six subjects that formed a focus for this research. Unsurprisingly, providers were able to sustain consistently higher class sizes in core subjects, such as English and mathematics, than in less popular subjects such as modern foreign
languages.
• All the providers in the sample experienced significant decreases in class size between years 12 and 13 in some subjects. To some extent this is an inevitable consequence of the current structure of A level provision, in which students often intentionally move from four subject choices at AS level to three at A2 level. However, in a minority of providers it also reflects a high proportion of students dropping out of A level provision altogether before embarking on their studies in year 13.
• The minimum viable A level class size was judged, on average, to be 11.7 students by the providers in the sample. This was based on responses from four FE colleges, three sixth-form colleges and nine schools. The colleges, on average, judged the minimum viable size to be slightly larger than schools but there was a considerable range in both groups. It is interesting that average A level class sizes in 10 of the providers fell below the average reported minimum level. Delivering a large number of classes below a minimum financial threshold will ultimately affect whether the A level provision in the institution overall is affordable. Where the costs of delivering A levels exceeded the income there tended to be cross-subsidisation from other learning areas. Around half of the schools that took part in the research believed that they supplemented their post-16 funding from their pre-16 funding but very few could quantify this precisely.
• There is a strong correlation between the number of A level learners in an institution and the average A level class size. For example, there was a striking difference between the four sixth-form colleges, which all had more than 1,200 A level learners and average class sizes of around 20, and the school sixth forms, which have learner numbers ranging from 120 to just over 400 and an average class size of around 11. All but one of the school sixth forms that had more than 200 students delivered average class sizes of more than 11. Only one of the seven school sixth forms with around 150 or fewer A level learners delivered average class sizes of more than 11.
• The breadth of the curriculum offer in relation to the size of the student body is also a key factor in determining class size. In general, those providers that are offering fewer A level subject choices in relation to the number of students taking A levels are able to maintain bigger class sizes.
• There appears to be a reasonably strong negative relationship between the cost of A level provision per student and average class size (i.e. the smaller the class size, the higher the average cost). Certainly per student costs of more than £5,000 were predominantly (although not exclusively) found in those
factors influence achievement at A level, not least the quality of teaching and the prior attainment of students. However, the relationship between larger A level class sizes and better student performance appears to be stronger in school sixth forms than other types of provider.
The factors that providers take into consideration in determining
subject breadth and consequently class size (sections 4.1 to 4.2)
• Providers take into account a wide range of factors in determining the breadth of their A level provision and consequently the size of classes that they can deliver. These are student choice, student progression, the provider’s curriculum or educational vision, its staffing profile, financial considerations, pedagogical principles and physical constraints.
• All the providers that took part in this research, without exception, said that responding to students’ subject choices played an important part in
determining the breadth of their curriculum offer. For some, this was the principal, or indeed only, consideration. For almost all providers, a focus on
student choices went hand-in-hand with trying to match the pattern of provision on offer to their current staffing profile. Developing a curriculum offer that supported student progression was also described as an important factor by about half of the providers.
• While the majority of institutions made reference to financial considerations as part of their decision-making process around subject breadth and class size, finance was a determining factor for only around a third. In fact only one provider out of the 24, an FE college, said that finance was the primary
consideration in whether or not to offer a subject.
The barriers faced by providers in maximising class size (section 4.3)
Providers see the benefit, both pedagogically and financially, of achieving larger class sizes but a number of barriers prevent them from doing so.
• Competition for students is a key barrier to increasing class sizes for providers that are operating below their capacity. These providers often deemed it essential to continue to run very small classes in minority subjects in order to retain existing students or attract new ones. Many institutions in such circumstances felt that it was more financially advantageous to run a small class than not to attract the students in the first place.
leadership responsibilities or reduce their paid hours, it made much more sense to ask that teacher to teach a small A level class than to have unused teacher
capacity. This issue was particularly acute for school sixth forms for which there was little benefit in discontinuing an A level subject if the teacher was still required to teach GCSE.
• Unpredictability of student numbers hampered the efforts of some
institutions to maximise their class sizes. The first point of unpredictability was centred on student admissions. Students typically apply to multiple institutions and may not decide until after their results which offer they will take. This can leave providers with significantly smaller classes than they had anticipated. The issue was most prevalent among FE colleges and sixth-form colleges, but also affected a small number of school sixth forms. The second point of unpredictability was in the transition from year 12 to year 13. The reduction in class sizes caused by students moving from four to three subject choices was distributed unevenly across subjects. A minority of institutions, particularly those catering for more mixed ability intakes, were also contending with challenges in retaining students for the whole A level course, which represented a large inefficiency in provision. • A large number of providers, of every type, cited their organisational status
or brand as a barrier to discontinuing some minority subjects and thereby increasing class sizes. The subjects that were most often cited as falling into this category were modern foreign languages, further mathematics, music and some sciences. The latter tended to be in institutions that did not have a strong track record in delivering sciences but nonetheless aspired to offer an academic curriculum that paved the way to university.
Action already being taken by providers (sections 5.1 to 5.6)
Just under half of the providers in the sample had begun to make changes with a view to increasing class size and thereby efficiency. In some cases this was as a direct result of cost pressures. In other cases it was about strategically reshaping their A level offer in response to changes in their cohort, in student demand, or in the
performance of their institution. Providers have begun to take action in the following key areas:
a) More systematic application of thresholds
b) Collaboration with other institutions to deliver A level in subjects with low demand c) Increasing retention of students
d) Responding to the changing qualification structure to linear A levels e) Marketing and market analysis of student demand
• Although the majority of providers referred to minimum thresholds for A level class sizes, few applied these rigorously and systematically. Where providers applied minimum thresholds conscientiously and based their decisions on
evidence, this clearly contributed to maintaining larger class sizes. Typically, those institutions had worked out their financial break-even point for delivering A levels. This meant that they had a clear understanding of the smallest class size they could afford to run, without cross-subsidising either from other subjects or other age groups. However, many providers did not routinely review the cost of delivering A levels. The majority of providers viewed their budget as a whole and would carefully review spending at an institutional level. But only a minority had systems in place for separating out the cost of A levels and scrutinising these. • Just over half of the providers interviewed were collaborating in some form,
and four of the providers collaborated in ways which were at a relatively large scale and involved delivering learning across more than one institution. In those institutions where collaboration had really taken off, there were a number of common factors: they were located in areas where transport between institutions was straightforward and cost-effective; they had invested significantly in
overcoming the logistical barriers associated with common timetabling and subject blocking; and they all stressed the importance of communication at all levels. • Over half of the institutions were innovating in their approach to teaching
and learning at A level; however, none of them thought this would enable them to increase class size or reduce teaching time significantly. Providers were unanimous and adamant that while there was a wide range of innovative, challenging and cutting-edge approaches to teaching and learning that could be, and were being, tried, these were essentially to complement and enhance core teaching, not to replace it.
Opportunities and considerations for the future (sections 7.1
to 7.2)
The national context in which providers of A levels are working is one of financial pressure, competition for students in the higher ability range, and evolving demands in terms of both the structure and rigour of qualifications. In this challenging context, the debate about class sizes becomes very relevant. However, taking action to increase class sizes is not a simple matter. There are very real trade-offs that need to be taken into account. Systematic action to increase class sizes is likely to require some
Options for providers
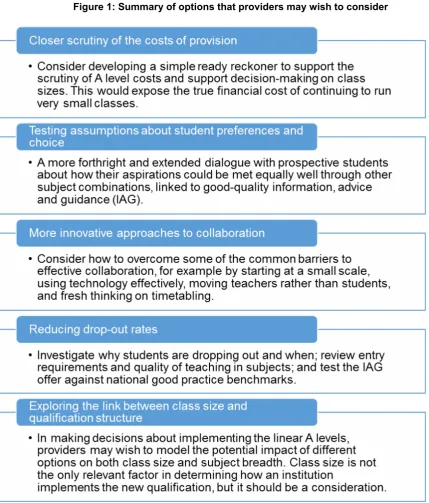
[image:10.595.63.493.152.656.2]As providers come under increasing financial pressure over the next few years they may wish to review the issue of class size as one means of lowering the costs of delivery. There is scope to learn from good practice across the sector.
Figure 1: Summary of options that providers may wish to consider
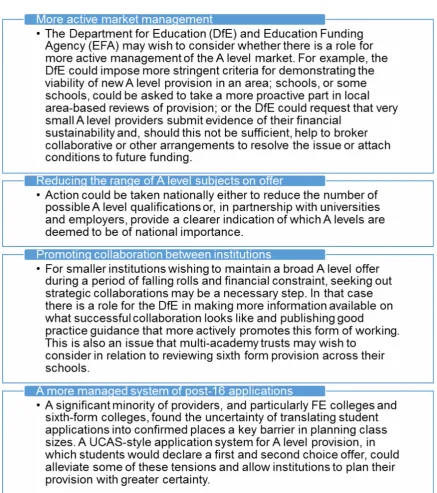
Options the Department for Education and Education Funding Agency
may wish to consider
and may contribute to their progress and the educational outcomes they achieve. However, the inevitable corollary of such a degree of choice is a greater prevalence of small classes and therefore higher costs. The question for policy-makers is the extent to which, in a period of both reducing national funding and a reducing 16 to 19 population until the 2019 to 2020 academic year, the higher costs of a choice-driven system can continue to be supported.
Section 1: Purpose of the research
1.1 Objectives of the research
1. The purpose of this research is to enable a better understanding of the decision-making process behind class sizes in 16 to 19 settings, and the impact this has on the cost of provision. The explicit objectives of the research were to:
a. Collect information about the costs faced by a range of providers for different qualifications in different settings and compare this with their funding.
b. Examine the drivers of class sizes in a variety of 16 to 19 institutions and whether a minimum class size is needed to offer academic qualifications and assess the implications for improving efficiency in delivery.
c. Examine the extent to which providers cross-subsidise between different qualifications to ensure they have what they regard as a sufficiently wide offer for their students.
d. Assess the extent to which decision-making processes vary between provider types (school sixth forms, sixth-form colleges and FE colleges) and whether other factors such as location, other local 16 to 19 provision and size of provider are important.
e. Assess the relationship between class size and curriculum breadth. f. Assess the extent to which class sizes differ for year 12 and year 13.
2. The research focused on A levels to enable meaningful comparisons across different types of institution delivering education to students aged 16 to 19 years old.
1.2 Context of the research
3. This research was carried out during a period of considerable change, both in terms of qualifications and funding.
4. The Isos research team visited providers in the autumn term of 2015. This coincided with the introduction of the first tranche of new AS and A levels in some subjects. Changes to A level content, the removal of modules, moving exams to the end of the qualification period and uncertainty about demand for the new qualifications were all adding a new degree of complexity for institutions making decisions about their curriculum offer and the consequent implications for class sizes.
Section 2: Methodology
2.1 Research design
6. In order to fulfil the research objectives set out above, the Isos team carried out fieldwork visits between September 2015 and January 2016 to 24 institutions delivering A levels. During each visit we conducted a semi-structured interview, generally with the headteacher or principal, the head of sixth form or curriculum and the finance lead to ensure a rounded perspective. The provider was also asked to complete a short template to gather common information about each institution in terms of its funding, performance, structure of qualifications and class size, in order to make statistical comparisons. Templates were returned by 23 out of the 24 providers. In addition, four hypothetical ‘future scenarios’ were used to explore how institutions might respond to changing circumstances and the impact these might have on class sizes. These were:
a. Future scenario 1: The planned changes to A level qualifications and structure. b. Future scenario 2: The opening of new A level provision in a local area
resulting in increased competition for students.
c. Future scenario 3: The closing of a large, mixed-ability post-16 provider in the local area resulting in increasing demand for provision for students with varied prior attainment.
d. Future scenario 4: The need to find additional funding efficiencies and to reduce costs of A level provision in the future.
7. The interviews with the providers and the analysis of the data collected were used to explore the following five key questions:
a. How do 16 to 19 institutions make decisions about class size when delivering academic qualifications? It was important to understand the criteria institutions use to make decisions as well as the factors outside the institution’s direct control. It was also important to test the impact of new A level and standalone AS level qualifications on institutions’ decisions and to explore the different drivers for class sizes in year 12 and year 13.
balance in class size between efficiency and impact in terms of student outcomes.
c. Do providers cross-subsidise between different study programmes, between different qualifications and between different phases? Within individual institutions, it was important to explore whether different programmes have different class sizes, costs and potential efficiencies, and whether
institutions subsidise more expensive qualifications from other parts of their budgets.
d. Are there varying patterns in the cost of provision across different types of provider? It was important to explore the differences in approach and costs across different types of providers, and whether the most efficient approaches are applicable to all or specific to some types of institution.
e. Are there other factors that affect cost and class size? These contextual factors could include the size of provider, location (e.g. urban or rural), other local provision, deprivation and students’ prior attainment. It was also important to identify any other drivers, such as the capacity of the institution to use its budget flexibly or difficulty recruiting certain subject teachers.
2.1.1 Sample of institutions
8. A detailed analysis of the institution-level data held by the EFA was carried out by the National Foundation for Educational Research (NFER) Centre of Statistics in order to identify the most relevant characteristics on which to base the sample. The sampling strategy produced a random sample of institutions based on:
• institution type – school with sixth form, including one UTC (15), sixth-form college (four), FE college (five)
• geography – to have a regionally representative sample of institutions • different levels of size, competition, deprivation and attainment
• Ofsted grade 2 or above.
9. The majority of providers visited were distributed across different regions of the country. However, five providers in a single local area with a high degree of local competition were also targeted in order to explore some of the dynamics between neighbouring institutions that might influence decision-making on class sizes.
2.1.2 Subject focus
10. The research focused in detail on six A level subjects to ensure that valid
schools and colleges. The choice of subjects – English, mathematics, chemistry, business studies, art and design and any modern foreign language – was informed by an intention to cover the following:
• the core subjects of English and mathematics • at least one science subject
• a comparison between more traditional academic subjects and those with a more vocational focus
• a comparison between subjects that are very popular and tend to attract large numbers and subjects that are chosen by a smaller number of students
nationally
• subjects that require different types of teaching techniques, such as subjects that:
o require equipment or are more technical o have a hands-on/practical dimension
Section 3: What does the data show about average
class sizes, the factors which influence these and the
cost effectiveness of delivery?
11. As set out in the methodology section above, the research collected class size and financial data from the providers that took part. This section explores how average class sizes vary across providers and across different subjects. It goes on to investigate whether there is a relationship between class size and different
institutional-level factors. Finally, it raises the question of whether class size has an impact on either the cost or effectiveness of delivering education. Given the small size of the sample relative to schools and other post-16 providers, the data and
conclusions set out here should be treated with some caution.
3.1 Average class size and range across the providers visited
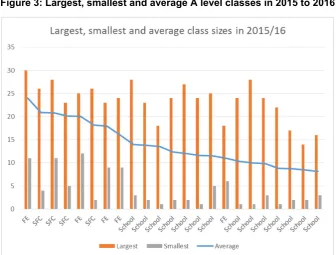
12. Figure 3 shows the largest, smallest and average (mean) A level class sizes, across [image:17.595.126.463.377.632.2]all A level subjects, delivered in the 2015 to 2016 academic year by the four sixth-form colleges, five FE colleges and 14 school sixth sixth-forms that returned data.2
Figure 3: Largest, smallest and average A level classes in 2015 to 2016
Sample size: 23 providers. Four providers were not able to provide average class size figures across their whole 2015 to 2016 A level cohort. In those cases, the average has been taken across the six subjects that formed the in-depth focus for this research.
2 For the purposes of reporting the data, the one UTC included in the sample has been referenced as a
13. This data shows a substantial difference in average A level class sizes across the sample group. At one extreme there is an FE college delivering average class sizes across all A level subjects of 24 students. At the other extreme is a school sixth form with an average of eight students across all subjects. In general, the biggest
difference can be seen between the FE colleges and sixth form colleges, on the one hand, operating at an average class size of just under 19 students, and school sixth forms, on the other hand, operating at an average A level class size of just under 11. However, even within the school sixth forms there is considerable variation, from the lowest average class size of eight to the highest of 14.
14. Largest and smallest A level class sizes are similarly varied (ranging from 30 students to one student) but are less uniformly distributed across types of provider. Seventeen providers delivered an A level class of five students or fewer. Three of these were sixth-form colleges and the remainder were school sixth forms. Many of these very small class sizes were year 13 classes – a phenomenon explored in greater detail in the next section. Nine providers delivered an A level class of 25 or more students, four of which were school sixth forms and the remainder were sixth-form colleges or FE colleges.
3.2 Average class sizes across the six subjects explored
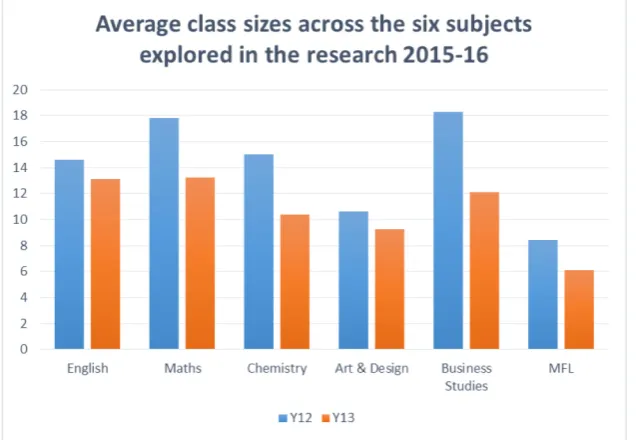
15. Six subjects formed an in-depth focus for this research: English, mathematics, [image:18.595.137.456.529.749.2]chemistry, art and design, business studies and a modern foreign language (French, Spanish or German). Figure 4 illustrates how average class sizes in year 12 and year 13 differed across these six subjects in the providers in the 2015 to 2016 academic year.
Figure 4: Average class sizes across the six subjects explored in the research, 2015 to 2016
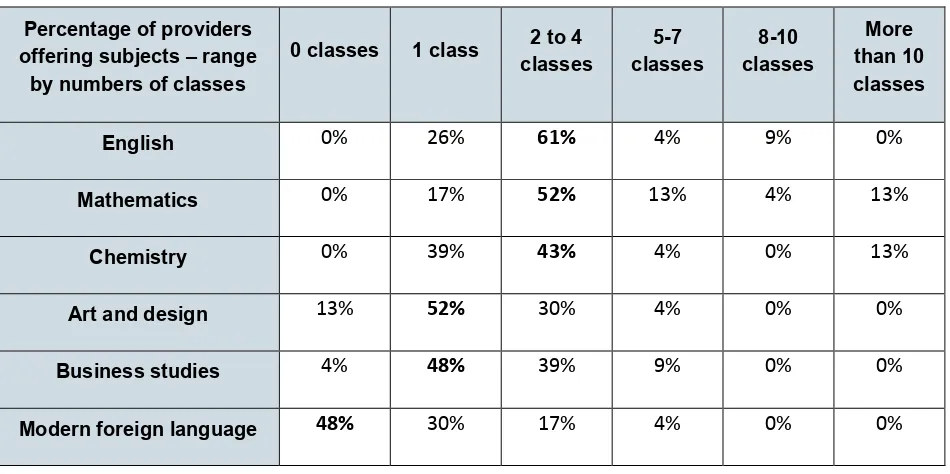
16. Two salient features are immediately apparent from Figure 4. The first is the difference in average class sizes in the core subjects, such as English and mathematics (13.9 and 15.5 respectively across both years 12 and 13), and less popular subjects such as modern foreign languages (an average of 7.3 across years 12 and 13). What these averages cannot reveal is the high student numbers in some subjects for some institutions versus the paucity in other subjects. Table 1 below shows how the number of year 12 classes in each of the six subjects offered by providers in 2015 to 2016 is spread.
Table 1: The distribution of numbers of classes across providers and subjects
Percentage of providers offering subjects – range
by numbers of classes
0 classes 1 class classes 2 to 4 classes 5-7 classes 8-10 than 10 More classes
English 0% 26% 61% 4% 9% 0%
Mathematics 0% 17% 52% 13% 4% 13%
Chemistry 0% 39% 43% 4% 0% 13%
Art and design 13% 52% 30% 4% 0% 0%
Business studies 4% 48% 39% 9% 0% 0%
Modern foreign language 48% 30% 17% 4% 0% 0%
Sample size: 23 providers
17. In subjects such as English, mathematics and chemistry, a minority of institutions, all of which were sixth-form colleges, had sufficient numbers of students to be able to run five or more classes simultaneously. In English and mathematics, the majority of providers were running between two and seven classes. Even the majority of school sixth forms, on average the smallest providers, were able to run more than one
English or mathematics A level class. By contrast, only 21% of providers were able to run more than one class in a modern foreign language and 34% in art and design. Those providers able to run multiple classes in these less popular subjects were a mix of schools and sixth-form colleges, determined perhaps more by the focus of their curriculum than the size of the institution.
wanted, have completed a one-year AS course and have no plan for progression or have changed their minds about what they want to do and want to start again. It is not possible to quantify from the data collected in this research what proportion of the reduction in class size from year 12 to year 13 is due to the reduction in the number of subjects that students study and what proportion is due to students dropping out of A level provision or the institution entirely. Anecdotally, it varied considerably between providers. Some reported very few students discontinuing their studies, but
emphasised that it was not always possible to predict which subjects students would choose not to continue beyond AS level. Three FE colleges and one large school sixth form, in contrast, anticipated that between 10% and 20% of their students might drop out of A level learning before commencing year 13.
19. The two subjects that, in the chart above, show the greatest fall-off in numbers between years 12 and 13 are mathematics and business studies. One can hypothesise why this is. Many providers explained that, unsurprisingly, in the transition from year 12 to year 13 students were most likely to discontinue their studies in subjects which they either found difficult, and in which they had not performed as well as other subjects, or in subjects which they did not deem to be critical to their further progress into higher education. Mathematics is an example of a subject where many students find that there is a considerable jump between GCSE and AS level in terms of the intellectual rigour it demands. They may therefore find the transition from AS to A2 similarly challenging. Business studies may be an example of a subject choice that is often taken as a fourth AS level, but which students may not always consider as critical as some other subjects in supporting entry to University. Students may therefore discontinue it at A2 level. A number of providers also reported seeing a pattern of more students taking economics in preference to business
studies.
Figure 5: Percentage reduction in average class size from year 12 cohort in 2014 to 2015 to year 13 cohort in 2015 to 2016
Sample size: 23 providers
21. Again, the variation in how subjects are affected by the transition from year 12 to year 13 is striking. It is also apparent that those subjects that typically run with higher numbers of classes in an institution are more able to absorb a fall in student numbers without this having such a significant impact on average class size. This can be seen by comparing English and chemistry. In both subjects the average reduction in
student numbers between 2014 to 2015 year 12 and 2015 to 2016 year 13 was around 30%, but in chemistry this translated into an average class size reduction of 3.3 students (or 24%), whereas in English the reduction was limited to 2.2 students (or 14%). This stands to reason – reductions in student numbers can be more easily managed across multiple classes, for example by reducing four classes to three and keeping average numbers high. To illustrate this, one large sixth-form college
reported that it had 174 students studying English in year 12 in 2014 to 2015, which dropped to 128 in year 13 in 2015 to 2016. The number of classes needed for English reduced from eight to five, and the average class size consequently increased from 22 to 26 students. The number of full-time equivalent teaching staff required to teach those classes reduced from 2.5 to 1.25.
3.3 Institutional factors that affect average class size
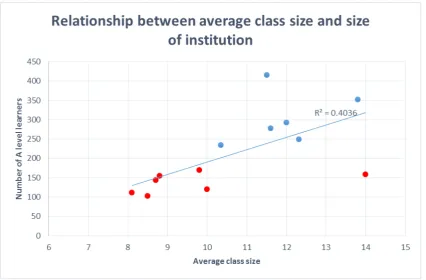
sizes between institutions. The first factor that appears to have a very significant impact on average class size is the size of the provider, as measured by the number of students studying at least one A level. The chart below shows the relationship between these two variables (the trend line shown is a statistical line of best fit with an R squared value of 0.48).
Figure 6: Relationship between average class size in 2015 to 2016 and number of learners
Sample size: 23 Providers. Sixth form colleges = red; FE colleges = yellow; school sixth forms = blue. Three providers did not submit the number of learners studying at least one A level in 2015 to 2016. In those cases the number of A level learners in 2014 to 2015 provided by the EFA have been used. Four providers were not able to give average class size figures across their whole 2015 to 2016 A level cohort. In those cases, the average has been taken across the six subjects that formed the in-depth focus for this research.
23. The chart shows a relatively strong correlation between the number of A level learners in an institution and the average class size that is delivered. For example, there is a very obvious difference between the four sixth-form colleges, which all have more than 1,200 A level learners and average class sizes of around 20, and the school sixth forms, which have learner numbers ranging from 120 to just over 400 and an average class size of around 11.
Figure 7: Relationship between average class size (2015 to 2016) and size of institution – school sixth forms
Sample size: 13 providers. One provider did not submit the number of learners studying at least one A level in 2015 to 2016. In this case, the number of A level learners in 2014 to 2015 provided by the EFA have been used. Three providers were not able to give average class size figures across their whole 2015 to 2016 A level cohort. In those cases, the average has been taken across the six subjects that formed the in-depth focus for this research.
25. The chart shows that all but one of the school sixth forms with more than 200
students delivered average class sizes of more than 11. Only one of the seven school sixth forms with around 150 A level learners or fewer did so. This threshold may be significant. According to the providers that took part in this research, the average minimum class size required to cover costs was 11.7 (albeit there was a significant degree of variation in the 16 providers that responded). Interestingly, guidance for schools and colleges published by the Association of School and College Leaders (ASCL) suggested that in 2013 to 2014 a minimum of 11 students would be needed per post-16 class to cover teaching costs, rising to 20 students for full cost recovery. 26. However, Figure 6 also shows that the size of institution is not the only variable
related to average class size. The experience of the FE colleges in the sample is informative in this respect. For example, one FE college had an A level cohort of 186 – very similar to the size of many school sixth forms – yet it delivered an average class size of 16, somewhat larger than any of the school sixth forms in the sample. Similarly, another FE college with just under 300 learners delivered an average class size of 20 – on a par with sixth-form colleges four times the size. Part of the
students taking at least one A level divided by the number of subjects). It does not explain all the differences seen between institutions, but generally it shows that providers which are offering fewer subjects in relation to the size of their student body are able to deliver larger average class sizes. The trend line is a line of statistical best fit, with an R squared value of 0.63, suggesting a strong correlation.
Figure 8: Impact of subject breadth on average class sizes (2015 to 2016)
Sample: 23 providers. Sixth-form colleges = red; FE colleges = yellow; school sixth forms = blue. Three providers did not submit the number of learners studying at least one A level in 2015 to 2016. In those cases, the number of A level learners in 2014 to 2015 provided by the EFA have been used. Four providers were not able to provide average class size figures across their whole 2015 to 2016 A level cohort. In those cases, the average has been taken across the six subjects that formed the in-depth focus for this research.
27. The analysis here suggests that the number of A level learners and the breadth of the A level curriculum offered (in relation to the size of the student body) can explain a large part of the variation in class size by institution, but they cannot explain all the variation. To do this one needs to understand the different motivations that inform decisions about class size and how these relate to both the type of institution and the context in which they are found. This is explored in greater detail in section 4.
3.4 The impact of class size on per student cost and
effectiveness
28. This final section of the data analysis attempts to tease out whether there is a
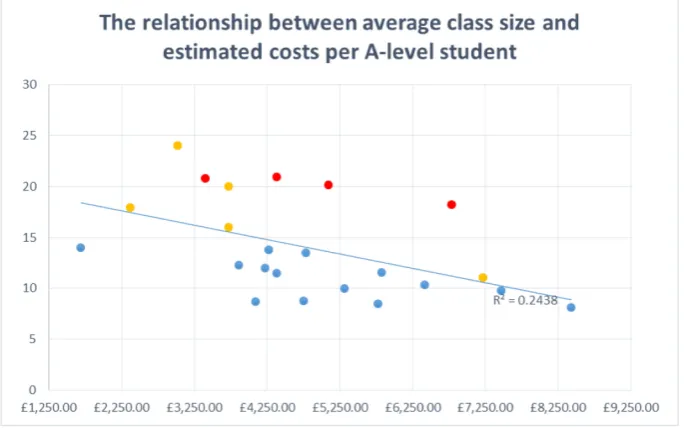
29. Looking first at the costs, Figure 9 plots the average class size of the providers in the sample against their estimated 2015 to 2016 per student costs for A level. The data on costs needs to be treated with some caution. No data is held nationally for the amount of post-16 funding which is allocated purely for the delivery of A levels. Data is held in relation to funding on an institutional basis, but for the majority of post-16 providers this includes funding for learners following a variety of different
qualifications. As part of this research, providers were therefore asked to estimate their A level spend. This was based on three elements:
a. estimated 2015 to 2016 A level teaching staff costs (calculated by multiplying the number of full-time equivalent teaching staff for A level by the average A level teacher salary within the institution)
b. estimated support staff costs (calculated by multiplying the number of full-time equivalent support staff for A level students by the average A level support staff salary)
c. estimated other costs (calculated by estimating a percentage of buildings, management, administration, assessment, equipment and other back-office costs that would be attributable to A level.)
[image:25.595.124.468.491.705.2]30. The total estimated spend for 2015 to 2016 was divided by the number of students in the institution taking at least one A level or AS level in the 2015 to 2016 academic year, in order to derive an annual per student A level cost.
Figure 9: The relationship between average class size (2015 to 2016) and estimated costs per A level student
31. Although the data on costs must be treated with caution, the chart suggests a
reasonably strong negative relationship between cost of A level provision per student and average class size (i.e. the smaller the class size, the higher the average cost). Certainly per student costs of more than £5,000 were predominantly (although not exclusively) found in those institutions delivering average A level class sizes of fewer than 12. Section 4.3 of this report attempts to examine some of the barriers to
[image:26.595.95.495.277.534.2]increasing class sizes, which may in turn explain the apparently higher per student costs in institutions with low average A level class sizes. The next chart compares the average point score per A level student (based on 2013 to 2014 published results) with the 2014 to 2015 average class size.
Figure 10: Relationship between average class size (2014 to 2015) and average point score per A level pupil
Sample size: 22. Sixth-form colleges = red; FE colleges = yellow; school sixth forms = blue. Five providers were not able to give average class size figures across their whole 2014 to 2015 A level cohort. In those cases the average has been taken across the six subjects that formed the in-depth focus for this research.
forms compared with other institutions. For school sixth forms there is a weak but positive correlation between class size and value added (R squared of 0.17), suggesting in sixth forms larger class sizes are weakly correlated with both higher attainment and better progress.
Section 4: How institutions make decisions about class
sizes
34. The previous section of this report highlighted the range of factors, from the size of institution to subject breadth and degree of competition, that appear to have an impact on the size of A level classes delivered in the providers who took part in this research. It also began to draw inferences about the relationships between some of these factors and both the cost and effectiveness of provision. This section of the report aims to explore what is happening to drive these data trends. It looks at how providers make decisions about class sizes, and why they make those decisions.
4.1 The principles that guide decision-making about class size
and subject breadth
35. It is very clear from the data analysis that there is a strong correlation between average class size and the number of subjects offered. In short, the more subjects that are offered in relation to the size of the student body the lower the average class size tends to be. It is therefore not surprising that when providers were interviewed about how they made decisions about class sizes their answers invariably started with a description of how they determined their A level curriculum offer in terms of the range of subjects available and then moved on to consider minimum and maximum class sizes. From the discussions, a number of core principles emerged which
providers referred to in helping to guide their decisions about the curriculum offer and class size. These were remarkably consistent across the range of providers.
4.1.1 Responding to student choice
36. All the providers that took part in this research, without exception, said that responding to the subject choices made by students played an important part in determining the breadth of their curriculum offer. For the large majority of providers it was the most important principle that they referred to and for a few it was the only thing that they emphasised. However, it was clear that the principle of responding to student choice meant quite different things to different providers.
described how their moral obligation to support the choices of their existing students was allied closely with their Christian ethos.
38. One sixth-form college and one FE college emphasised the importance they attached to offering students from across the community the opportunity to study A level
subjects or combinations that were simply not available from other local providers. They saw themselves as complementing a local offer that had become too narrow in some respects. The sixth-form college described the importance it afforded to offering minority subjects such as Latin, classics, physics and German, which were not widely available in other local sixth forms or colleges. The FE college described the social value of its relatively small and focused A level offer in catering for those students who were increasingly finding themselves unable to meet the entry criteria of local sixth forms but who nonetheless had an aspiration to study A level and had the aptitude to do so.
39. In one FE college, responding to student demand took quite a different form. For this institution, it was less about meeting the demands of a pre-identified body of students than about using sophisticated market analysis techniques to predict subjects in which demand was rising (or falling), looking at how well these demands were catered for in neighbouring institutions, and analysing learner travel times to develop a profile of subjects and a curriculum offer to which they aimed to recruit.
4.1.2 Supporting student progression
40. The second principle that providers referred to as guiding their decision-making, and which often went hand-in-hand with efforts to respond to student choice, was the need to support effective student progression. Five out of the 24 providers in the sample strongly emphasised how student progression influenced their initial subject offer and described how they aimed at the outset to guide students into combinations of subjects that both suited their individual abilities and gave them the right platform for progression to their destination of choice. It was a factor mentioned by around half of the providers. All but two of the providers described an ongoing process with
potential applicants, which extended up to results day and beyond, to negotiate, shape and influence their choice of subjects.
41. About half of the providers in the sample also described the trade-offs they made around both setting, and enforcing, entry requirements. All the providers recognised the importance of getting the right students on to the right course to maximise the chances of good student progression and achievement. However, many were also aware that in setting entry requirements too high they risked diminishing potential student numbers and recruiting class sizes that were well below capacity. Despite this trade off, the general trend tended to be towards rising rather than falling entry
setting higher entry requirements for students wishing to study four A levels rather than three, or by more rigorous application of entry requirements which had been set previously, but generally not adhered to.
4.1.3 Curriculum aspirations as an institution
42. In addition to providers’ commitment to offering a range of subjects that met student demand, some also described how they nurtured a particular institutional identity which frequently found its expression in the curriculum and range of subjects offered. In these cases, the providers in question might be less driven by year-on-year
changes in student preferences and might instead seek to attract students who subscribed to their specific educational vision. These might be influenced by
perceived national importance, strengths in teaching or insights into the needs of local communities and local and regional employers.
43. Two sixth-form colleges and two school sixth forms, for example, described their offer as strongly academic, with a focus on supporting progression to Russell Group
universities. Their core subject offer, therefore, was focused on the facilitating subjects. One school sixth form and one UTC had carved out a specific niche in science subjects with a view to supporting progression, on the one hand, into the study of medicine at university and, on the other hand, into science and engineering related careers. One FE college described its role as being an important player in the local and regional economy and how its offer had been influenced by identified
regional skills priorities. One other school sixth form described their passion for continuing to offer a strong arts-based curriculum, including music and performing arts. In serving a very deprived community they felt this was essential to provide a 16 to 19 educational offer that would compensate for some of the opportunities that would not be readily available in local community settings. These institutional
aspirations helped to guide providers in making sometimes difficult to decisions about which subjects to continue and which to stop.
St Dominic’s Catholic Sixth Form College in Harrow, London, has increased
student numbers by more than 300 since 2012. The college has managed to maintain a very broad A level programme, with 28 different subjects on offer. There is a strong emphasis on mathematics and science, but they have also seen a growth in
humanities, English and psychology as well. They see this breadth as critical to their success as it allows them to offer combinations of subjects that may not be on offer elsewhere. For example, students can study more unusual combinations such as physics, Latin, classics and German – a combination not widely available locally.
4.1.4 Staffing profile
progression and their adherence to an educational vision. Only a few examples were given of institutions which had, in the recent past, recruited a new member of staff specifically to deliver a subject that had not previously been offered. However, the influence that the staffing profile had on the institution’s approach to recruiting students and determining subject breadth differed quite considerably.
Woodhouse College, an oversubscribed sixth-form college in Barnet, described how they recruited students, as far as possible, in the right subject combinations to meet the profile of their teaching staff. They would not necessarily offer the place to the applicant with the highest points score if the subject combination of another strong applicant enabled them to better fill teachers’ capacity. Over the longer term, the college aims to modify its cohort of teachers so that it reflects student demand for subjects.In Barnet and Southgate College, an FE college also in Barnet,they set a tariff for each subject, based on market trends and existing staff capacity. They would then seek to recruit to that tariff. Daily phone calls and monitoring enabled them to track progress towards their targets.
45. For other institutions, the interplay between subject breadth at A level and staffing was more complex. Around a third of school sixth forms described the importance of offering teachers the opportunity to teach A level as a way of attracting the best staff, with subject specialist teaching from 11 to 18, and retaining existing staff. One coastal school, which was relatively isolated, said they would not be able to recruit teachers without offering the opportunity to teach A level. Another school gave an example of a teacher deciding to apply for posts in other schools because he did not have the opportunity to carry out sufficient A level teaching. For school sixth forms, subject breadth at A level was also often driven by the quality of teaching at key stage 4. For the many of the school sixth forms interviewed, the subjects that attracted the most students at A level were those delivered by the teachers who were the most engaging and achieved the best exam results at GCSE. This provided the school with areas of curriculum strength that were the core pillars around which they would base their A level offer.
4.1.5 Financial considerations
46. It was striking that while the majority of institutions made reference to financial considerations as part of their decision-making process around subject breadth and class size, this was a driving factor for only around a third. In fact only one provider out of the 24, an FE college, said that finance was the primary consideration in whether or not to offer a subject. In this case, the FE college said that it would only offer subjects at A level that could make a minimum 25%, and normally 50%
provider, their average A level class size, across the six subjects explored in depth for this research, was 16.
47. In contrast, two providers, one school sixth form and one FE college, said that they would only discontinue subjects for pedagogical reasons, for example if the teaching was of poor quality, the class size was not sufficient to stimulate debate and dialogue or the course requirements were not appropriate for their students. They would not discontinue a subject purely for financial reasons. One other school sixth form said “Our focus is on the students. If that means we have to take a financial hit then we will do so.”
4.1.6 Pedagogical considerations
48. The four factors, or principles, outlined above which providers told us guided their decision-making relate, in the main, to the range of subjects that providers offered and therefore by implication to the size of classes. Around half the providers also reported that, for pedagogical reasons, they believed that there was an optimum range for A level class size. Again, around half of the providers in the sample believed that A level classes of just three or four students did not deliver the best learning experience. Most described the importance of dialogue and small group work that would be frustrated in such a constrained learning environment. Five providers had looked in-depth at the research and were able to cite from an increasing evidence base that student progress at A level tended to be better in larger classes. Having said this, many providers felt that offering a subject, even at very low take-up levels, was better for the students than not offering it at all. Between 2014 and 2016, around a third of the 24 providers ran a year 12 A level class with fewer than five students in one of the six subjects explored as part of this research. Clearly, in the hierarchy of decision-making, for many providers student demand trumps all else.
49. Pedagogical considerations also apply in relation to the top end of A level class sizes. The vast majority of providers felt that A level classes became harder to teach when class sizes reached somewhere between 25 and 30 students. This was dictated by factors such as the ability of teachers to get to know all the students well, the fact that typically A level classes would be taught by one member of staff without any
classroom support (unlike pre-16 teaching where typically class sizes are bigger but the ratio of adults to learners in the classroom is smaller), and the volume of marking and assessment that a large class would generate. A few providers suggested that maximum class sizes might differ between subjects. One provider, for example, said that they would be willing to accept larger classes in subjects such as English,
50. One large sixth-form college expressed a very clear pedagogical principle that it was not so much a large number of students in a particular class that might impair the relationship between teacher and student, so much as the total number of students a teacher needed to get to know well across their entire teaching portfolio. In this instance most teachers taught five A level classes and it was felt that teachers would struggle to know more than 120 students, in total, really well. The sixth-form college therefore aimed to limit class sizes to a maximum of 24 and would either split classes that were around 26 or 27 students or would put additional support into the
classroom, for example through a teaching assistant. Another school sixth form said their decision-making on maximum class size was based on student feedback – some groups of students were very happy in a class of 30 and teachers were obviously delivering a good learning experience. In other classes they started getting complaints when numbers went above 20. They had to act to protect their brand and stop
students leaving so would move immediately to two classes.
4.1.7 Physical constraints
51. A further constraint that frequently applied to maximum class size was the physical capacity of the rooms available. This differed quite a lot between institutions. Some of the larger colleges and schools that used key stage 4 and key stage 5 room capacity interchangeably could comfortably accommodate up to 30 in a classroom. However, just under half of providers had classrooms for post-16 students which would not take more than 24. Even in some of the largest FE colleges they only had one or two rooms that could take more than 24 or 25 students, and these served the whole college so simply could not be used on a regular basis for A level classes. Indeed, one school sixth form pointed out that the Learning and Skills Council used to impose maximum class sizes on new-build classrooms, which means that many rooms are now restricting class sizes, sometimes to 22 students or fewer.
52. For a few providers, the physical constraints imposed by their building related not so much to individual class size as to their ability to offer more subjects. In these
providers, a lack of free classroom space at peak times meant that they could not offer additional A level subjects even if they had the demand and the teaching staff needed to deliver them.
4.2 The process that determines eventual class size
53. It is clear that there is a wide range of principles that guide institutions in making decisions about their A level offer and the size of classes that they will deliver, and the interplay and trade-offs between these can be quite complex. This complexity is
how they approached this process of establishing class sizes, the core elements of the process were very consistent across all types of provider that were interviewed. This is described in Figure 11.
Figure 11: Process for establishing A level class sizes
4.3 Barriers that impede providers in achieving the most
efficient class size distribution
54. The preceding sections have set out the range of different considerations that institutions apply in reaching decisions about class size (and its corollary, subject breadth). They have also described the process in which these decisions are lodged.
1. Set out subject offer 2. Student applicati ons 3. Plan the A level provision 4. Class sizes: max and min criteria
5. A level offer (before results)
6. Final A level offer (after results)
7. Flux in class sizes: 1st
6 weeks
A
le
vel
o
ffer
Institutions vary in the degree to which they carry out a strategic review of previous provision before setting out their offer. Some, typically larger, institutions carry out a highly forensic analysis of trends in demand, market share, and learner travel patterns. Others carry out a more limited review of subject quality, outcomes and take-up in recent years. A few simply start with their historic offer, plus indications gleaned from open days and discussions with prospective students of likely demand. Delivery of some subjects is ruled out at this stage.
All institutions go through a process of inviting student applications. There is some variation in the extent to which providers seek to direct those applications or give students a free choice. Some providers said that they only allowed students to apply for subject combinations in particular blocks, however this was the minority. Many providers, particularly school sixth forms who know their students well, have extensive dialogue with applicants to ensure that they were picking subjects that they were able to do and which worked well in combination.
Once applications have been received the process of allocating subjects to timetable blocks and to staff commences. School sixth forms will normally block teaching and subject time across the whole school, and many give priority to A-level teaching in terms of allocating staff capacity first. The timetabling and blocking process can be more complex for institutions which are offering collaborative A-level provision across more than one provider.
The blocking process gives providers an indication of the likely size of their A-level classes. At this point providers may decide that some classes are too small to run, either for financial or pedagogical reasons or that some classes are too big and need to be split. A very few providers described having hard and fast rules for discontinuing a subject. The majority of providers had notional thresholds for class sizes but would review each case on its merits.
Making the final offer frequently involves further negotiation with students. If, for example, a student wanted to take a subject which was not viable providers described how they would work with the student to find good alternatives which would enable them to make equally good progress towards their destination of choice. All providers made offers based on specific subjects but recognised that there was likely to be considerable flux between initial offer and final allocation of places.
The key variant at this point in the process was the rigour with which providers applied their entry requirements. Three factors tended to contribute to providers being looser in their application of requirements: where they were trying to fill capacity; where they knew the students well and were confident in their abilities and felt the exam result was not a true reflection; or where the requirement missed was not deemed crucial to the A-level subject choice, for example a maths and science candidate falling short on English.
However, one clear issue that arises out of the complexity is that providers see the benefit, both pedagogically and financially, of achieving larger class sizes but a number of barriers prevent them from doing so.
55. Through the research, providers were asked whether they had a figure for the minimum viable class size needed to cover the costs of delivery. Sixteen providers were able to answer that question and, although there was quite significant variation in their responses, the average minimum viable class size was 11.7, and 11 of the 14 providers answered between nine and 13. However, in around two fifths of institutions taking part in the research their average A level class size in 2015 to 2016 was lower than the average viable minimum. This suggests that for a large minority of institutions there are significant barriers preventing them from delivering as efficient an A level offer as they might wish. This section explores the most commonly experienced barriers to maximising class size.
4.3.1 Competition for students
56. For some providers, the need to attract additional students is acute. These providers can be categorised in two main ways. The first group are responding to external factors that determine the degree to which they have to compete for students.
Providers operating in areas where there is a high density of provision, often with new sixth forms having opened in recent years, where travel between institutions is
relatively straightforward and where there is a culture of seeking out the best provision rather than simply opting for the nearest provider find themselves very clearly competing for students. The second group are providers, most often school sixth forms, which are contending with internal factors which leave them significantly below capacity. These might be providers seeking to grow a sixth form from a low base without an established track record of post-16 provision to point to, or schools whose pre-16 intake is at the lower end of the ability spectrum and which
consequently experience a much lower throughput of students from their key stage 4 to key stage 5 provision, leaving them short on student numbers overall.
57. For those providers that do not have the luxury of being oversubscribed, or even at capacity, decisions around whether or not to continue a very small A level class become very difficult to make. Many providers that found themselves in this situation explained that they felt they had to do everything they could to retain existing key stage 4 students (in the case of school sixth forms) or attract students to apply from elsewhere, and if that meant offering a minority subject or an unusual combination of subjects they would do so. Many institutions in such circumstances felt that it was more financially advantageous to run a small class than not to attract the student in the first place. The argument in favour of running small classes becomes more
them to retain two students who would otherwise have opted for a different provider and who, alongside choosing geography, also studied A levels in mathematics and the sciences. So by offering one very small class, they were able to boost class sizes by two students in three other core classes.
4.3.2 Inflexibility of staffing
58. The second key barrier that prevents providers from discontinuing subjects with very low take-up is the inability to turn staff capacity off and on as demand fluctuates. Typically, the ability to employ staff flexibly, on part-time or sessional contracts, is greater in the further education sector than in schools as teachers’ terms and
conditions are less stringent and teachers are more likely to be dedicated solely to A level provision than teaching across multiple age ranges. However, even in those providers with the most flexibility in their staffing model the decision to make a member of staff redundant in order to realise the savings from discontinuing an A level subject was difficult as they had to weigh up the potential savings against the possibility of incurring recruitment costs should they wish to run the subject again in future.
59. In those instances where discontinuing an A level subject did not allow a provider to release teaching staff, redeploy their time to other teaching or leadership
responsibilities or reduce their paid hours, it made much more sense to ask that teacher to teach a small A level class than to have unused teacher capacity. Many school sixth forms, in particular, made the point that there is little benefit in
discontinuing an A level subject if the teacher will still be required to teach GCSE as it does not allow you to remove a teacher from the staffing roll and therefore does not result in any cost savings. In such circumstances there is little financial impact in continuing to run a very small A level class.
4.3.3 Unpredictability of student numbers
60. The third key barrier to maximising efficiency identified through our research was the unpredictability of student numbers. There are two points in the A level lifecycle where this is most acute: in the conversion of A level offers to student take-up and in the transition from year 12 to year 13.
61. The fact that students make multiple applications to post-16 providers and may only decide at the last minute which offer to take up posed a challenge to a significant minority of the providers who took part in the research. This was typically a bigger issue for FE colleges than school sixth forms, which tended to recruit most of their students from their pre-16 cohort and consequently had better information than other providers on eventual destinations. However, it was not exclusively a further
of students per subject as they did not know which offers were likely to be accepted. Another provider explained that they could expect their eventual student numbers to be 20% lower than the number of A level places they offered. This could often be the factor that tipped a subject from being viable to non-viable. It is, of course, much harder to decide not to run a subject after an offer to specific students has been made than before.
62. The second point of unpredictability is the transition from year 12 to year 13, and this affected providers of every type. Across the sample, over two-thirds experienced a drop of more than 25% in class sizes between year 12 and year 13 in either English, mathematics or chemistry – and these are facilitating subjects in which one might expect retention of students to be relatively higher. Across the sample as a whole in 2015-16, average class sizes were 24% smaller in year 13 than in year 12. To some extent this is the inevitable arithmetical consequence of students moving from four subjects down to three. In year 12, a student body of 200 will generate 800 places in classes; however, in year 13, with only three A2s, the same 200 students would generate only 600 places in classes.
63. Typically, the 25% reduction in places is not felt evenly across the subjects. Those subjects that are deemed to be critical for entry to higher education or particular career paths are generally more likely to be retained than those which students deem to be less critical to their chosen pathway. It is of course very difficult, and in many cases impossible, to discontinue a subject in year 13 in which students have invested a year of study and have ambitions to continue, even if the class size becomes very small indeed. Although all institutions know that there will be an inevitable reduction in class sizes from year 12 to year 13 and can plan for this, providers suggested that it can be very difficult to predict which subjects are likely to be most affected in any single year. They explained that many students would embark on four AS
qualifications without knowing which they would continue and which they would stop. Often they would make up their minds, or indeed change their minds, when they knew how well they had done in the AS examinations. Nonetheless, there is probably more that institutions could do to systematically model retention rates in different subjects over a number of years in order to improve their planning.
4.3.4 Organisational status or brand
65. The final key barrier that was highlighted by a large number of providers in the
sample, of every type, was the need to continue to offer certain subjects, even if these did not attract high numbers of students, because of their importance to the
institution’s brand. The subjects which were most often cited as falling into this category were modern foreign languages, further mathematics, music and some sciences. The latter tended to be in institutions that did not have a strong track record in delivering sciences but nonetheless aspired to offer an academic curriculum that paved the way to university.
66. Of the six subjects that were explored in depth through this research, it is perhaps no surprise that modern foreign languages attracted the smallest class sizes across the sample. Sixteen providers out of the sample were offering at least one modern foreign language. Across these, average class sizes were eight in year 12 and six in year 13. The largest class was 19 and the smallest class was just one.
4.4 How opportunities and barriers vary by type of institution
67. The barriers to maximising efficiency through class sizes described above apply toSection 5: Actions taken by providers to increase class
size and reduce costs
68. Comparing average class sizes across the providers in 2014 to 2015 and 2015 to 2016, there was a modest increase – from an average of 13.3 in 2014 to 2015 to an average of 14.0 in 2015 to 2016. This appears to be driven by a slight increase in both the average minimum and average maximum class sizes. The first rose from 3.5 to 4.3 and the latter increased from 22.9 to 23.3, at a time of a decreasing 16 to 19 student population. Providers were asked whether their decision-making process in relation to class sizes had changed at all in recent years. Just under half responded that they had begun to make changes with a view to increasing class size and thereby efficiency. In some cases this was as a direct result of cost pressures. In other cases it was about strategically reshaping their A level offer in response to changes in their cohort, in student demand, or the performance of their institution.
69. This section explores some of the effective actions that providers have already taken which have begun to increase class sizes, and in particular in reducing the number of very small classes. It also looks at the potential risks of some of these approaches, and options that providers had considered but discounted.
5.1 More systematic application of thresholds
70. The majority of providers (all but six) had notional minimum thresholds for class sizes but not all applied these systematically, due to competing factors in the decision-making hierarchy as explored in detail in paragraphs 35 to 51. However, the
systematic application of minimum thresholds in relation to class size was a common factor both in those providers that achieved larger average class sizes than might be expected given the size of their A level cohort and in those providers that have consciously looked to increase class sizes over recent years.
71. Typically those institutions that had really focused on their minimum thresholds for class sizes had worked out their financial break-even point for delivering A levels and therefore had a clear understanding of the smallest class size they could afford to run, without cross-subsidising either from other subjects or other age-groups. The example below describes how one sixth-form college had experimented with different
approaches to applying minimum class size criteria over the last few years.
standing. Now they have instituted a measured approach that combines some discretion over whether to discontinue a subject but still retains the rigour of questioning minimum thresholds in every case. Their current scrutiny o