DEHYDROEPIANDROSTERONE (DHEA) LEVELS AND
CERVICAL VERTEBRAL MATURATION STAGES AT
PRE-PUBERTAL, PUBERTAL AND POST-PUBERTAL STAGES OF
GROWTH
Dissertation submitted to
THE TAMILNADU DR. M.G.R.MEDICAL UNIVERSITY
In partial fulfilment for the degree of MASTER OF DENTAL SURGERY
BRANCH V
This is to certify that this library dissertation titled “EVALUATION AND COMPARISON OF SALIVARY DEHYDROEPIANDROSTERONE (DHEA) LEVELS AND CERVICAL VERTEBRAL MATURATION STAGES AT PRE-PUBERTAL, PUBERTAL AND POST-PUBERTAL STAGES OF GROWTH” is a bonafide work done by Dr. K. SANGEETH under my guidance during her postgraduate study period between 2014-2017.
This dissertation is submitted to THE TAMILNADU DR. M.G.R. MEDICAL
UNIVERSITY, in partial fulfilment for the degree of Master of Dental Surgery in Branch-V, Orthodontics & Dentofacial Orthopedics. It has not been submitted (partially
or fully) for the award of any other degree or diploma.
Dr. JAGDEEP RAJU, M.D.S., Dr.R.K.VIJAYAKUMAR,M.D.S.,
Guide & Professor, Professor & Head,
Department of Orthodontics, Department of Orthodontics,
Sri Ramakrishna Dental College and Hospital Sri Ramakrishna Dental College and Hospital Coimbatore – 641004 Coimbatore - 641004
Date: DR.V.PRABHAKAR, M.D.S., Place: Coimbatore Principal
I submit this study at the feet of God almighty.
I consider this opportunity given to me to do my post graduation in this prestigious institution under the able leadership of our respected Principal Dr.V.Prabhakar.M.D.S., and our Director Ltn Col. Dr. Muralimohan. M.D.S., as the most valuble one in my life.
Our Head of the Department, Dr. R. K.Vijayakumar. M.D.S., has made us always run the extra mile by setting the standards high. He himself has been our benchmark and I wish to pay my highest respects to him at this juncture. Thank you Sir.
My guide Dr. Jagdeep Raju. M.D.S., has been my guiding light throughout this 3 years of study. Despite his personal constraints he ensured that the study is completed in the best of manners and on time. Thank you Sir.
I am gratefully indebted to Dr. Pradeepkumar. M.D.S., for his insightful comments and encouragement throughout my post graduate study.
My heartfelt thanks to Dr. Fayyaz Ahamed. M.D.S., and Dr. Afrose Khanna. M.D.S., whose hard questioning made me put more effort in learning.
I would like to extend my appreciation to the assistance and support offered by
my colleagues, Dr. Khaniya Bharathan, Dr, Mohammed Yaseen, Dr.A.N. Indra, Dr. Neeraja Kurup, Dr, Mohnishkumar , Dr. Sindhu and Dr. Mohammed Bava.
I would like to extend my thanks to Dr. J. Sekkizhar. PhD., Assistant Professor, P.S.G. Institute of Management, for his expert guidance in completion of the statistical
Biomedical Research Centre, Namakkal for conducting the assay procedure in the most
precise and meticulous manner.
My sincere and heartfelt thanks to Dr. Ashwini Nehru. B.D.S., for her help in my clinical as well as academic work.
My family has been my strength, my inspiration and my backing. Without all their love, affection, understanding, tolerance and sacrifices, completion of this Post
Graduate course would have been a distant dream. I am immensely blessed to be part of such a divine family. Thank you family.
My loving sister, Dr.Mohanapriya M.D.S., has been the person I have looked up to in my career and academics. Though younger she has shown unparalleled maturity in helping me go through some of the toughest moments in my life. She was the reason I
S.No Title PageNo.
1. Introduction 1
2. Aims and Objectives 5
3. Review of literature 6
4. Materials and methods 32
5. Results 51
6. Discussion 57
7. Summary and Conclusion 64
S.No Title Page No.
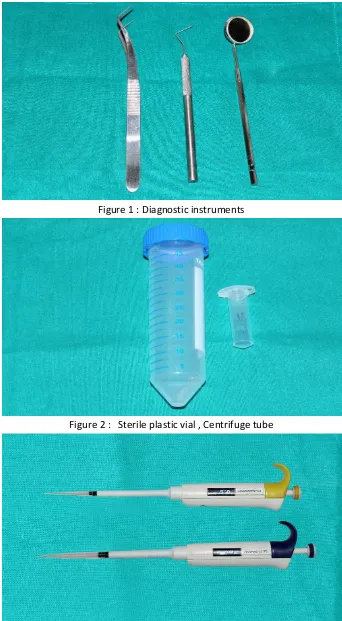
1. Diagnostic instruments 43
2. Sterile plastic vial , Centrifuge tube 43
3. Precision pipettes and disposable pipette tips 43
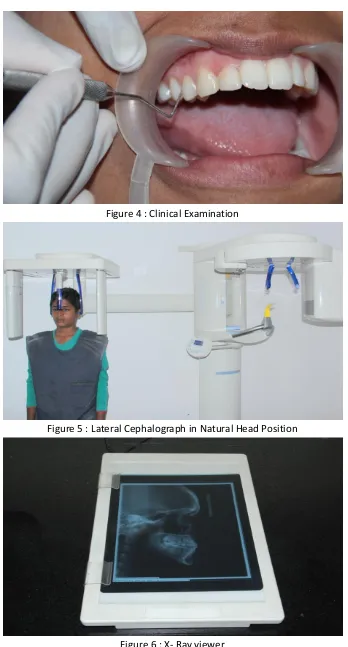
4. Clinical Examination 44
5. Lateral Cephalograph in Natural Head Position 44
6. X- Ray viewer 44
7. Cervical vertebral maturation stages 45
8. Saliva Collection 46
9. Thermo-sealed ice box with dry ice 46
10. Saliva vials thawing 46
11. Salimetrics DHEA assay kit 47
12. Reagents 47
13. Microplate 47
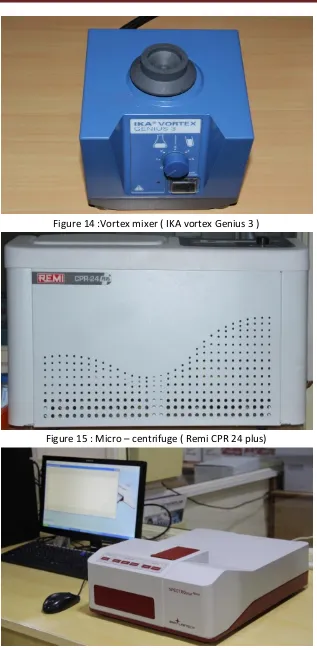
14. Vortex mixer ( IKA vortex Genius 3 ) 48
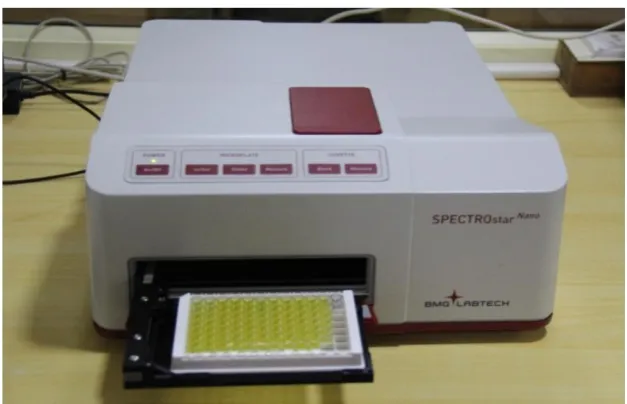
15. Micro – centrifuge ( Remi CPR 24 plus) 48
S.No Title Page No.
17. Vortexing 49
18. Pipetting 49
19. Centrifuging 49
20. Immunassay 49
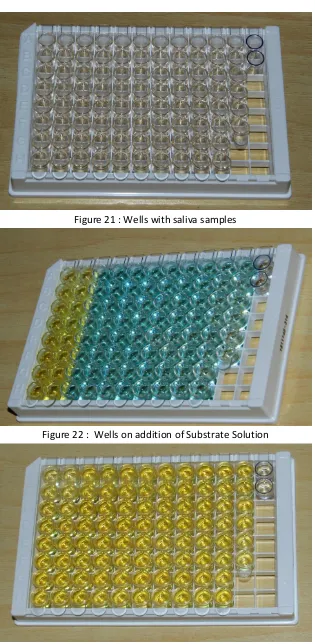
21. Wells with saliva samples 50
22. Wells on addition of Substrate Solution 50
23. Wells on addition of stop solution 50
24. Serial dilution method 37
25. Plate layout 38
26. Age and Gender distribution in the groups 51
27. Pre-pubertal DHEA levels 52
28. Pubertal DHEA levels 52
29. Post-Pubertal DHEA levels 52
30. Mean value of DHEA levels in all three groups 54
S.No Title Page No.
1. Results of ANOVA 53
2. Results of Tukey HSD 54
3. T test 55
4. Lower and and Upper bound values at a 95% confidence interval for mean
I hereby declare that no part of the dissertation will be utilized for gaining financial assistance for research or other promotions without obtaining prior permission from the Principal, Sri Ramakrishna Dental College and Hospital. In addition, I declare
that no part of this work will be published either in print or electronic without permission from the guide who has been actively involved in this dissertation. The author solely has
the rights for publishing the work with prior permission from the Principal, Sri Ramakrishna Dental College and Hospital, Coimbatore.
Principal Signature of candidate
Sri Ramakrishna Dental College and Hospital Coimbatore
NAME OF THE CANDIDATE Dr. K. Sangeeth
TITLE OF DISSERTATION Evaluation And Comparison Of Salivary
Dehydroepiandrosterone (DHEA) Levels And Cervical Vertebral Maturation Stages At Pre-Pubertal, Pubertal And Post-Pubertal Stages Of Growth
PLACE OF STUDY Sri Ramakrishna Dental College and Hospital
DURATION OF COURSE 2004-2017
NAME OF GUIDE Dr. Jagdeep Raju
[1]
Achieving a functionally stable and aesthetically pleasing alignment of the
dentition is the primary goal of any orthodontic treatment. The type of malocclusion, mechanotherapy used or the type and duration of retention are not the only factors which
influence this goal. One of the most important factors is the timing of treatment. The rationale of treatment is based on modification of growth during the greatest craniofacial growth period or the option of camouflage and orthognathic surgery at a later period.
Appropriately timed correction or interception is the key to success in rendering a harmonious occlusion 2,3,4,5,6,7,. This assessment of timing is based on the knowledge of
growth and development of the craniofacial complex.
As reported by Todd8, “Growth is increase in size and development is progress towards maturity”. The process of maturation is continuous throughout life - from
conception till death. Although maturation is a continuous process there are certain periods in the life of an individual where the greatest increments of growth occur. These
periods are called growth spurts9. The various growth spurts include the pre-natal growth spurt, post-natal growth spurt, mixed dentition growth spurt and pre-pubertal growth spurt. Among these growth spurts the pre-pubertal growth spurt plays a major role in
orthodontic treatment planning.
These growth spurts are closely related to the acceleration in the growth of
craniofacial structures. Since orthodontic and dentofacial orthopedic therapy involves not only the correction of dentoalveolar structures but of skeletal structures as well, utilization of the peak in growth becomes necessary. This peak is characterised by wide
[2]
The assessment of skeletal growth and maturation involves the use of several
biologic indicators including
increase in body height10
dental development and eruption11,12,13
cervical vertebral maturation14,15
skeletal maturation of the hand and wrist16,17,18
frontal sinus development.94
Certain biomarkers such as alkaline phosphatase19, Insulin like growth factor (IGF)20, Dehydroepiandrosterone sulphate (DHEAS)21 have also been attempted to be
used as maturity indicators.
The frequently used skeletal maturity indicator is the cervical vertebral maturation method as it uses the lateral cephalograph which is routinely required for
orthodontic diagnosis. This reduces the additional radiation exposure attributable to a hand-wrist radiograph.
The changes in the size and shape of cervical vertebra were identified and maturational standards were created by Don Lamparski22 in 1972 as a part of his university post graduate program. This was further developed as an index by Hassel and Farman28. McNamara, Bacetti and Franchi14 in 2005 modified the Cervical Vertebral Maturation (CVM) method.
This method is based on the anatomical changes of the 3 cervical vertebra (C2, C3 and C4) evaluated with the presence or absence of concavity at their inferior borders and the difference in shape of their bodies (trapezoid, rectangular horizontal, square and
[3]
Accordingly it is divided into 6 stages – CS1, CS2, CS3, CS4, CS5 and CS6.
Stages CS1, CS2, stages CS3, CS4 and Stages CS5, CS6 are considered as pre-pubertal, pubertal and post-pubertal stages respectively19,56.
Puberty is a neuroendocrinal event hosted by the hypothalamic-pituitary-adrenal axis (HPA). The adrenal glands secrete C19 steroids Dehydroepiandrosterone (DHEA)
and Dehydroepiandrosterone-Sulphate (DHEA-S). These steroids act as precursors for
androgens- testosterone and dihydrotestosterone by stimulating the pulsatile secretion of the gonadotrophin releasing hormone from the hypothalamus which in turn stimulates
the secretion of gonadotrophins by the pituitary23. DHEA is released into the circulation as the sulfated form – DHEA-S which constitutes of ninety-nine percent of circulating DHEA25. Dehydroepiandrosterone (DHEA) and Dehydroepiandrosterone-Sulphate
(DHEA-S) are often interconverted into one another, so it is commonly referred as DHEA(S).
Production of DHEA(S) is initiated by the fetal adrenal glands and proceeds through pregnancy. This results in high concentrations of DHEA(S) in the newborn. By age one, the fetal adrenal glands are replaced by definitive adrenal cortex which
produces a small quantity of DHEA(S). Thus the concentration declines during the first months of life and remains low.
The onset of production of DHEA(S) from the zona reticularis of the adrenal cortex starts at around the age of six. This is referred as adrenarche23.
The concentrations of DHEA(S) increases gradually reaching the peak at around
[4]
The conversion of adrenal DHEA(S) to dihydrotestosterone is mandatory to
stimulate secondary sexual characteristics like axillary and pubic hair growth i.e. the phenotypic result of adrenarche is pubarche23.
In some children with low birth weight, earlier DHEA(S) production resulting in premature adrenarche or higher DHEA(S) production resulting in exaggerated adrenarche have been noted25. Children with elevated DHEA(S) production may have
slightly advanced bone age and accelerated linear growth along with abundant axillary and pubic hair.
As these hormones play a major role in the initiation of puberty, it would be more appropriate to measure the level of this biomarker to assess the maturational stage of pubertal growth spurt.
DHEA and DHEAS are widely distributed throughout the body. They are present in brain, adrenals, spleen, kidneys, testes, liver, plasma and saliva. The salivary
concentrations are linearly related to the plasma concentrations38.
Salivary sampling to study the level of DHEA has the advantages of ease of collection and non- invasiveness particularly in younger individuals.
[5]
Aim :
The aim of the study is to assess and find a co-relation between the salivary
DHEA and the Cervical Vertebral Maturation Method in pre-pubertal, pubertal and post-pubertal stages of growth.
Objectives:
1. To assess the salivary DHEA levels of the subjects.
2. To assess the skeletal maturational stage of the subjects using the Cervical
Vertebral Maturation Index.
3. To co-relate between the salivary DHEA level and the Cervical Vertebral
Maturation Method of skeletal maturation assessment at pre-pubertal, pubertal
[6]
Jacques.R. Ducharme et al (1976)26 measured the plasma free dehydroepiandrosterone, androstenedione, testosterone, dihydrotestosterone, estrone, and estradiol by radioimmunoassay in 55 boys and 54 girls 3.5 to 16.3 years of age. Plasma
DHEA increased significantly between 6 and 8 years of age in girls and between 8 and 10 years of age in boys. A further significant increase was noted between 10 and 12 years of age in both sexes. Androstenedione rose significantly between 8 and 10 years of
age in girls and between 10 and 12 years in boys. In contrast, no significant increase in other hormones was noted prior to 12 years of age in both sexes.
They concluded that early rise in the course of pubertal development of the two sex steroids predominantly of adrenal origin, and its occurrence 1 to 2 years earlier in girls than in boys, as does puberty itself, suggest a possible role for these steroids in the
mechanisms involved in triggering the hypothalamic-pituitary-gonadal axis at puberty. Ross F. Vining et al(1983)27 examined the mode of entry of DHEAS into saliva. Their study shows salivary concentrations of lipid insoluble, conjugated steroid such as DHEAS is approximately 1 % of un-bound plasma concentrations. They conclude that the principal route of entry is through the tight junctions between the acinar cells i.e. the
ultrafiltration route. They also found an increased concentration of the hormone in saliva contaminated with plasma or gingival fluid. They noticed that the DHEAS concentration
is inversely related to the salivary flow rate.
Brent Hassel & Allan G Farman (1995)28 obtained the lateral cephalometric and hand-wrist radiographs from the Bolton-Brush growth centre and developed a
[7]
Patricia García-Fernandez (1998)29 did a study to determine whether the maturation of cervical vertebrae would correlate with the maturation indicated by hand-wrist X-rays in a Mexican population. The hand-hand-wrist radiographs were evaluated with
the Fishman system and the cervical vertebral development of the sample was evaluated by the Hassel and Farman method. The results showed no significant difference between the two techniques of assessing skeletal maturation in a Mexican population and thus can
be accepted as valid at the 95% level for both males and females.
Douglas A. Granger et al (1999)30 specified the guidelines for sample collection, storage, and preparation procedures for radioimmunoassay of DHEA in saliva. With regard to sample collection, they recommend to refrain from using cotton swabs or either version (i.e. untreated-cotton, polyester or citric-acid treated swabs) of
the Salivette device. If a sugarless flavourless gum is used as a stimulant then it has to be chewed for at least 3 min before sample collection. They recommend that fresh samples
are not to be processed and that the samples should be frozen first and thawed before assay to break down mucopolysaccharides. Even though their study shows that DHEA in saliva is robust to freeze–thaw they advise to keep freeze–thaw cycles to be a minimum.
Tiziano Baccetti et al (2000)2 performed a cephalometric study to evaluate the skeletal and dento-alveolar changes induced by twin block appliance in different skeletal
maturation stages in order to define the optimal timing for this therapy. The early treated group was in cervical maturation staging 1 & 2 and the late treated group consisted of people in cervical maturation staging 3 to 5 according to the evaluation method by
[8]
The results showed a 4.5mm per year overjet reduction in an early treated group
and upto 6mm per year in a late treated group and a remarkable correction in the molar relation in both the groups. Thus they show that late treatment with twin block starting
during or slightly after the onset of the peak in mandibular growth appears to be more effective than early treatment as it induces more favourable skeletal contribution.
Albert Michael et al (2000)31 sought to examine whether levels of dehydroepiandrosterone are abnormal in depression. Salivary DHEA and cortisol levels were analysed in 3 groups: Major depressives (44), partial or completely remitted
depressives (35), normal controls (41). They concluded that lowered dehydroepiandrosterone levels are an additional state abnormality in adult depression and dehydroepiandrosterone may antagonize some effects of cortisol and may have
mood improving properties.
Elizabeth A. Shirtcliff et al (2001)32 evaluated the susceptibility of immunoassays between direct saliva collection and by using cotton absorbent materials. Salivary assay results for testosterone, DHEA, progesterone, and estradiol are artificially high, and for sIgA artificially low, when samples are collected using cotton absorbent
materials. In contrast, results for salivary cortisol, DHEA–S, and cotinine are not affected by the use of cotton collection methods. It was shown that in DHEA the cotton
[9]
Koshi Sato et al (2001)33 developed a new system - Computer Aided Skeletal Maturity Assessment System (CASMAS) to automatically evaluate skeletal maturation in Japanese children. They used several methods to predict mandibular total length
(Condylion – Gonion) at final stage using skeletal maturation as an indicator. Bone age was calculated by both TW2 method and CASMAS method. The error was higher by CASMAS than TW2 method but the difference was not significant. They conclude that
this method may be a promising method because of its easy visual evaluation.
Tiziano Bacetti et al (2002)34 provided an improved version of cervical vertebral maturation method. This analysis consisted of visual and cephalometric appraisal of morphologic characteristics of the second, third and fourth cervical vertebrae in 6 consecutive Cephalometric observations. This new method presents with five
maturational stages Cervical vertebral maturation stage (CVMS) I through Cervical vertebral maturation stage V.
The pre-peak period is denoted by CVMS I and CVMS II. The peak in the mandibular growth occurs between CVMS II and CVMS III. The CVMS V is recorded atleast 2 years after the peak. The advantages of this new version are that the mandibular
skeletal maturity can be appraised on a single cephalogram by analysis of the cervical vertebrae which are visible even when a protective radiation collar is worn.
Toshinori Mito et al (2002) 35determined a regression formula to obtain cervical vertebral bone age based on ratios of measurements in the third and fourth cervical vertebral bodies and co-relating it with the TW2 method. The ratios of these parameter
[10]
Cervical vertebral bone age was given by the formula-0.20+6.20xAH3/AP+ 5.90
xAH4/AP4 + 4.74 x AH4/PH4 where AH -anterior vertebral body height, H – vertebral body height, PH - posterior vertebral body height, and AP- anteroposterior vertebral
body length on the third and fourth cervical vertebrae.
Paloma San Roman et al (2002)36 analysed the hand wrist radiographs and lateral cephalograph of 958 Spanish children from 5 to 18 years of age with Grave and
Brown classification for the hand wrist and Lamparski and Hassel- Farman method for Cervical Vertebral Maturation. They studied the changes in the concavity of the lower
border, height, and shape of the vertebral body and confirmed that concavity was the most accurate of the three parameters.
They propose that the Hassel and Farman classification can be used to estimate
the maturation stage in both males and females whilst the Lamparski classification is not sufficiently accurate in males and can be used only in females and can also replace the
wrist radiograph in the assessment of the maturation stage.
Kurt Faltin Jr. et al (2003)3 investigated the long term effects and optimal timing for Class II treatment with bionator appliance. Lateral cephalograms of Class II
patients were analysed in two groups. The early treated group consisted of 13 subjects in cervical vertebral maturation stage 1. The late treated group included 10 subjects in
cervical vertebral maturation stage 2. The cephalograms were assessed at three time periods at the start of treatment, at the end of bionator therapy and at long term observation after completion of growth.
The findings of the study indicated that the bionator therapy is more effective and stable when it is performed during the pubertal growth spurt. Optimal timing to start
[11]
F. Hucklebridge et al (2004)37 mapped DHEA secretory activity onto the diurnal cycle by measuring cortisol and DHEA in saliva samples collected at distinct time points over the diurnal cycle, synchronised to awakening. Both steroids, particularly DHEA,
showed stability across days of sample collection. A main distinction between cortisol and DHEA was that although DHEA was elevated in post-awakening samples compared with later in the day there was no evidence of an awakening stimulatory burst of DHEA
secretory activity. The secretory pattern of DHEA is very stable whereas cortisol secretory activity seems more sensitive to day-to-day variability.
Wattana Leowattana (2004)38 reviews the use of DHEAS as a new diagnostic tool. This article explains the physiology, metabolism and the various factors that influence the concentrations of the hormone. Increased concentrations of DHEAS were
to be found in patients with adrenal tumors, congenital adrenal hyperplasia and polycystic ovary syndrome. Undetectable concentrations of DHEAS are noted in patient
with adrenal insufficiency or panhypopituitarism. This article elaborates on the direct action of DHEAS as a neurosteroid exerting direct and differential effects on neuronal growth and development as well as the effect on immunity by enhancing natural killer
cell cytotoxicity in humans via locally generated immunoreactive insulin-like growth factor I.
[12]
Clare Netherton et al (2004)39 investigated basal levels of cortisol and dehydroepiandrosterone (DHEA), and their relation to gender and pubertal development, in healthy children and adolescents. Salivary cortisol and DHEA levels were examined in
129 normally developing subjects aged eight to 16 years. Saliva samples were collected in the morning and evening over four consecutive days. Pubertal stage was assessed using Tanner stage sketches, and subjects were grouped according to their general status
of pubertal development (pre-early puberty: Tanner stage III; mid-post puberty: Tanner stage II). Results showed that mean levels of salivary DHEA were greater in
mid-postpubertal boys and girls than in pre-early pubertal boys and girls.
Johanna Assies et al (2004)40 examined salivary morning and evening levels of cortisol and DHEA-S in 13 medicated, unipolar, non-psychotic depressed patients and 13
healthy volunteers. Diurnal declines in cortisol and DHEA-S levels were found in both depressed and control groups. In patients compared with controls, DHEA-S was
significantly elevated, in conjunction with normal cortisol levels. DHEA-S may be a more sensitive indicator of depression and symptom severity than cortisol in medicated but still clinically depressed patients.
Katie T. Kivlighan et al (2004)41 examined the impact of blood leakage due to microinjury to the oral cavity on the measurement of salivary hormones. Saliva samples
were collected before, immediately after, and then every 15 min for 1 h following vigorous tooth brushing. Blood in saliva was quantified by visual inspection of discoloration, Hemastix reagent strips to detect hemoglobin, and an immunoassay for
transferin. Results showed that group average measurements of salivary DHEA were largely unaffected by microinjury. However, Visual inspections of sample discoloration
[13]
The authors advocate screening the participants should be screened for events in
their recent history that could cause blood leakage into saliva by asking questions related to teething, shedding teeth, open sores, and injury. They also recommend avoiding
Sampling saliva within 45 min of microinjury to the oral mucosa and a systematic inspection of the samples at the point of collection, and if visibly contaminated with blood, excluding those samples from analyses.
Tiziano Baccetti et al (2005)14 introduced a modified version of the Cervical vertebral maturation method. He analysed the morphology of the bodies of the second,
third and fourth cervical vertebrae in 6 consecutive cephalometric radiographs of 30 orthodontically untreated subjects. This new method comprised of 6 maturational stages, cervical stage 1 (CS1) through cervical stage 6 (CS6). CS1 and CS2 are pre-peak stages,
the peak in mandibular growth occurs between CS3 and CS4. CS5 and CS6 denote the post-peak stages. He provides this method to identify optimal treatment timing for
dento-facial Orthopaedics.
Carlos Flores-Mir et al (2006)42 assessed the correlation between Fishman maturation prediction method (FMP) and the CVM in 79 subjects and found a
moderately high correlation value and may be high enough to use either of the methods indistinctively for research purposes and not for the assessment of individual patients.
[14]
Paola Gandini (2006)43 compared the Bjork index of hand-wrist bone analysis and Baccetti et al CVM method and found a concordance rate of 83.3%. The results also show a correlation of CVMS 1 with Bjork stage 1 – 3, CVMS I , CVMS II with Bjork
stage 4, CVMS III with Bjork stage 5, CVMS IV with Bjork stage 6&7 and CVMS V with Bjork stage 8&9. They confirmed that the vertebral analysis and a lateral cephalograms is as valid as hand-wrist bone analysis with the advantage of reducing the
radiation exposure of growing subjects.
Tancan Uysal et al (2006)44 investigated the relationship between chronologic age and the maturation of cervical vertebrae in a Turkish population and found a high correlation co-efficient. They concluded that in subjects of Turkish origin the cervical vertebrae stages method can be used as a maturity indicator in daily orthodontic
diagnostic practice.
Peter Gallagher et al (2006)45 compared the accuracy of cortisol and DHEA measurement by examining the association between plasma levels, saliva collected by passive drool method and saliva collected using a citric acid-treated salivette device. Their study showed that DHEA levels of saliva samples collected using the unstimulated
collection method correlated with plasma levels.
DHEA collected using the salivette device did not correlate significantly with
[15]
A.Wayne Meikle et al (2007)46 sought to determine the adrenal steroid concentrations in children from 7 to 17 years of age. Tanner stage was determined in each child by physical examination. 11-DeoxyCortisol, pregnenolone,
17-hydroxypregnenolone, 17-hydroxyprogesterone and testosterone were quantified by liquid chromatography-tandem mass spectrometry. Androstenedione and Dehydroepiandrosterone sulfate were measured by immunoassay. Except for 11-
deoxycortisol, all of the steroids exhibited an increase in concentration after age 7-9 years in both boys and girls. 11-Deoxy Cortisol, which is made exclusively in the adrenal
cortex, declined with age and Tanner stage.
This study suggests that a rise in gonadal function and decreased efficiency of llß-hydroxylase with age may contribute to an increase in the remaining steroids.
Testosterone concentrations increased more dramatically in boys, but increases were seen with each Tanner stage in girls.
Ryun-Sup Ahn et al (2007)47 studied the correlation of DHEA in serum and saliva. Blood and saliva samples were collected between 10 and 11 am from 359 volunteers between 21 and 16 years of age. DHEA levels did not start to decline
significantly until 40s, declined significantly in 50s with a further decline in 60s. The relative DHEA ratio of serum to saliva was similar throughout the ages examined.
Robert L. Matchock et al (2007)48 correlated the levels of cortisol, testosterone, and DHEA across pubertal development using Tanner criterion of genital and pubic hair stage for boys and breast and pubic hair stage for girls. DHEA was found to be lower at
pubertal stage 1 than stages 3 & 4 with no sexual differences. DHEA showed significant
diurnal variation with highest values in the morning. Seasonal effects were not found for
[16]
Douglas A. Granger et al (2007)49analysed the prevalence, stability, and impact of blood contamination in children’s saliva on the measurement of cortisol, testosterone,
and dehydroepiandrosterone. Participants were 363 children (47% boys; ages 6–13
years) from economically disadvantaged families who donated saliva samples on 2 days in the morning, midday, and late afternoon. To index the presence of blood (and its components) in saliva, samples were assayed for transferrin.
They conclude that blood contamination in children’s saliva samples is rare, and
its effects on the measurement of salivary hormones are small. The authors advice to
avoid sampling saliva within 45 min of microinjury to the oral mucosa. They also recommend that samples should be systematically inspected at the point of collection and if visibly contaminated with blood they should be excluded from analyses.
Elizabeth Shirtcliff et al (2007)50 examined salivary DHEA responses to a public speaking task (PST) and parent–child conflict discussion paradigm in adolescents.
Results showed that DHEA levels were higher in girls than boys, and in older and more physically developed adolescents, indicative of DHEA’s function during pubertal
maturation. DHEA levels increased during the PST, indicating responsiveness of DHEA
to acute stressors.
Across both tasks, girls with internalizing problems showed sharper rises in
[17]
Tiziano Baccetti et al (2007)51 studied a large cross-sectional population of 1091 of male and female untreated subjects at six consecutive developmental periods (CS1through CS6) according to the cervical vertebral maturation method. The findings
of the investigation indicate that the timing for orthognathic surgery in Class III patients, as well as the appropriate “surgical age” for other procedures in dentistry (eg, implants in the mandibular arch), should be considered also with particular attention in the light of
the findings of the present study that indicate mandibular growth continued into young adult ages in males and females with Class III malocclusion.
Yan Gu and James McNamara Jr(2007)52 after a longitudinal cephalometric implant study of 20 subjects substantiated that the peak mandibular growth was between the stages CS3 to CS4 and that mandibular remodelling and condylar rotation continue to
occur over a relatively long period even after the growth spurt.
Li-Li Chen et al (2008)53 gave a quantitative cervical vertebral maturation assessment for adolescents with normal occlusion.QCVM (Quantitative cervical vertebral maturation) were divided into 4 stages: QCVM I to QCVM IV. They concluded that H4/W4 (ratio of height/width of the 4th cervical vertebra), AH3/PH3 (ratio of
anterior height to posterior height of 3rd vertebra) and @2 (anteriosuperior angle between the inferior border of the 2nd vertebra to the straight line joining the posterioinferior and
anteroinferior points ) can be used as decisive parameters.
They established an equation to accurately estimate CVM : CVMS = -4.13 +3.57 x H4/W4 + 4.07 x AH3/PH3+0.03x@2. The definition of each stage was in QCVM I,
[18]
Tiziano Baccetti et al (2008) 13 assessed the relationship between the eruption of the permanent maxillary canines and skeletal maturity in subjects with different skeletal relationships in sagittal and vertical planes. 152 subjects were divided into prepeak
(before pubertal growth spurt, cervical stage CS1 andCS2), peak (during the pubertal growth spurt, CS3 and CS4), and postpeak (after the pubertal growth spurt,CS5 and CS6) groups.
The study concluded that the eruption of the permanent maxillary canine can occur at any stage in skeletal maturation before the end the pubertal growth spurt
(CS1-CS4), with hyperdivergent subjects more frequently having prepubertal canine eruption. Tiziano Baccetti et al (2008)54 investigated the role of treatment timing on the effectiveness of vertical-pull chincup therapy in conjunction with a bonded rapid
maxillary expander (RME) in growing subjects. Both the treated and the untreated samples were divided into prepubertal and pubertal groups on the basis of cervical
vertebral maturation. Treatment of increased vertical dimension with the RME and VPCC protocol appears to produce better results during the pubertal growth spurt than before puberty, although the absolute amount of correction in the vertical skeletal
parameters is limited.
Hessa Abdulla Alkhal (2008)55 investigated the co-relation between chronologic age, cervical vertebral maturation and Fishman’s skeletal maturity indicators in a
southern Chinese population and confirmed that CVM is valid indicator of skeletal growth during the circum pubertal and has a high correlation with the HWM. They also
[19]
Lorenzo Franchi, Tiziano Baccetti et al (2008)56 did a diagnostic performance study to analyse the relationship between the circum-pubertal phases of the dentition (early mixed, intermediate mixed, late mixed, early permanent) and the CVM method. A
variable diagnosis of pre-pubertal stage 1 (CS 1) in the early mixed and the intermediate mixed dentitions, pubertal stage 3 in the late mixed and early permanent dentitions were obtained. They conclude that the early mixed dentition phase shows a strong diagnostic
value for the identification of pre-pubertal skeletal maturity, whereas the intermediate mixed dentition phase had a low diagnostic value for the same pubertal stage. So they do
not support the use of late mixed dentition or permanent dentition as a valid indicator for the onset of pubertal growth spurt.
Mohammed I. Masoud et al (2008)57measured mean blood spot IGF-I levels in a cross-sectional study of 83 patients (44 female,39 male) on recall to begin orthodontic treatment, in active treatment, or in post treatment follow-up. Results showed Mean
blood spot IGF-I levels were significantly higher in the late pubertal stages than in the prepubertal, earlypubertal, and postpubertal stages.
Linear correlation showed that IGF-I levels had a significant positive correlation
with cervical skeletal maturity from the prepubertal to the late pubertal stages, and a significant negative correlation from the late pubertal to the postpubertal stages. In the
postpubertal stage, IGF-I levels had a negative linear correlation with increasing time since the onset of puberty and with chronological age. They concluded that blood spot IGF-I could be used as a skeletal maturity indicator and might be useful in detecting
[20]
Shuhei Izawa et al (2008)58 investigated dehydroepiandrosterone (DHEA) secretion in response to acute psychosocial stress and the relations of DHEA secretion to cortisol secretion, cardiovascular activity, and negative mood changes. Collections of
saliva, measurements of blood pressure and heart rate, and assessments of negative mood by visual analog scales were conducted before, during, and after delivering a speech and performing a mental arythmatic task in front of audience. Acute psychosocial stress
significantly increased salivary DHEA level by an average of 60% immediately after. The results indicated that an acute increase in DHEA concentration under stressful
situations might be partly mediated by the activity of hypothalamus–pituitary–adrenal axis and could have some significance in the improvement of negative mood.
Gerald L. Brown et al (2008)59 performed a small pilot study to demonstrate the feasibility and relevance of using salivary assessment of biological markers in studies of aggressive behaviour. 5 males of age 18-30 provided saliva samples at 20:00, 02:00,
08:00 hours. Results showed lowest DHEA levels at 20:00 hours, slightly higher at 02:00 h and highest at 08:00 h. Thereby they demonstrated the feasibility of using salivary collection and assays to assess the biological markers.
Toshihiro Ansai et al (2009)60 investigated the associations between those levels and periodontitis in never-smokers and smokers of elderly subjects. Cortisol and DHEA
levels in saliva were determined in 171 subjects (85 males, 86 females), with clinical examinations including probing depth (PD) and clinical attachment loss (CAL) also performed. Results showed that smoking had effects on cortisol and DHEA levels, and
those were significantly associated with severe PD and CAL in never smokers. Their conclusion was that assessment of hormone levels may be a useful screening method for
[21]
Athina Chatzigianni et al (2009)61 evaluated the cervical vertebrae shape by geometric morphometrics to find the predictive power of vertebral shape on skeletal maturation. They concluded that the vertebral shape is strongly correlated to skeletal age
but does not offer better predictive value than chronologic age.
Tiziano Baccetti et al (2009)5 evaluated the effect of timing in relation to skeletal maturity on the outcomes of Phase 1 non-extraction therapy of Class 2
Malocclusion. 3 groups of patients before pubertal growth spurt, during pubertal growth spurt, after pubertal growth spurt were treated using head gear combined with fixed
appliances and Class II elastics.
Results showed that Class II treatment before or during the pubertal growth spurt induced favourable skeletal changes i.e., restriction of maxillary advancement in
pre-pubertal patients and enhancement of mandibular growth in pre-pubertal patients in addition to the dento-alveolar changes. The greatest amount of dento-skeletal correction occurs in
patients treated during the pubertal growth spurt.
Ricky W. K. Wong et al (2009) 62 to evaluate the validity of the CVM, co-related the hand-wrist and lateral cephalometric radiographs of 400 Chinese subjects.
They noticed that all patients in cervical vertebral stage 3 of the CVM corresponded to stages MP3-FG or MP3-G (around the peak of the growth spurt) in the HWM and
confirm CVM as a valid indicator of skeletal growth during the circumpubertal period, providing information for timing of growth modification.
Daniel B. Gabriel et al (2009)63 say that in the CVM method shows methodological flaws that can lead to inflated levels of reproducibility. They do not recommend the CVM method as a strict clinical guideline for the timing of orthodontic
[22]
Malgorzata Kuc-Michalska & Tiziano Baccetti (2010) 64 examined the pre-treatment lateral cephalometric records of 218 skeletal Class I or Class III subjects and calculated the duration of pubertal peak from average chronological age intervals
between stages CS 3 and CS 4 of the Cervical vertebral maturation and found that the pubertal growth spurt was longer in Class III subjects than in subjects with normal skeletal relationships. The greater increase in mandibular length in Class III subjects
might be associated with the longer duration of the pubertal peak.
Luci Mara Fachardo Jacqeira et al (2010)65 compared the three cervical vertebral evaluation methods : Hassel-Farman, Baccetti Et Al and Seedat-Forsberg and observed 95% agreement between the them. They suggest that the method proposed by Baccetti et al is the best followed by the Hassel-Farman method and the Seedat-Forsberg
method.
Piotr Fudalej and Annie Marrie-Bollen(2010)66 sought to assess the effectiveness of CVM method to predict circumpubertal craniofacial growth in the post peak period. Craniofacial growth was evaluated by measuring condylion to Gnathion, Condylion to Gonion, Gonion to Gnathion, Sella to Gnathion, Nasion to Menton,
Anterior nasal spine to Menton and Sella to Gonion from the end of treatment to the end of follow-up for about ten years. They concluded that the CVM method was only
modestly effective in detecting amount of post peak circumpubertal craniofacial growth. Ingrid Rozylo et al (2010) 67studied Polish children and compared dental age and cervical vertebral maturity and found a moderate but statistically significant
correlation. The teeth showing highest correlation with CVM were the second premolars and canines in female and male subjects respectively. The central incisor demonstrated
[23]
With these findings they confirmed that both dental and skeletal maturity should
be assessed if the skeletal maturity of a growing child is to be relevant to clinical practice. The findings also indicate the usefulness of dental calcification stage as a
simple first level diagnostic test for skeletal maturity
Bhadrinath Srinivasan et al (2011)21 performed a cross-sectional study to evaluate serum levels of dehydroepiandrosterone sulphate, during the pre-pubertal,
pubertal and adult stages of skeletal maturation based on the methods of Björk and Grave and Brown of assessing hand – wrist radiographs. The levels of the DHEAS of each
individual were measured using quantitative enzyme- linked immunosorbent assay and correlated with the corresponding stages in their hand – wrist radiograph.
This study was performed on 60 subjects (30 females and 30 males) aged from 7
to 30 years. There was a gradual increase in the hormonal level with progressing skeletal age. The adult group showed the highest DHEAS level and the pre-pubertal group the
lowest. Serum levels of DHEAS showed a constant increase from pre-puberty to adulthood, and at the same level of skeletal maturation, both females and males had similar hormone levels. They concluded that DHEAS is associated with growth during
the pubertal growth spurt andcan be a valuable tool in assessing skeletal maturation. Elizabeth C. Prom-Wormley et al (2011)68 conducted a study on Genetic and environmental effects on diurnal dehydroepiandrosterone sulfate concentrations in middle-aged men. Saliva was collected from 783 middle-aged men. Samples were taken at multiple specified time points across two non-consecutive days in the home and one
day at the study sites. There was a consistent diurnal pattern for DHEAS concentrations in both at-home and day-of-testing (DOT) measures, which was the highest at awakening
[24]
The significant heritability estimates later in the day reflect time-specific genetic
effects for DHEAS, compared with prior twin and family designs studies which frequently used averaged morning-only measures. Additive genetic influences on
DHEAS concentrations were consistent between at-home and DOT measures.
Perinetti et al (2011)69 evaluated the diagnostic performance of dental maturity for identification of skeletal maturation phase using positive likelihood ratios (LHR).
Dental maturity was assessed through the calcification stages from panoramic radiographs of the mandibular canine, first and second premolars and second molar.
The results show that the developmental status of these teeth might only be useful in diagnosis of a pre-pubertal growth phase, reliable differential diagnosis between the two pre-pubertal stages, i.e., CS 1 and CS 2 is not possible.
Trenton S. Nestman et al (2011) 70 identified that the weakness of the CVM method arises from difficulty in classifying the vertebral bodies of C3 and C4 as
trapezoidal, rectangular horizontal, square or rectangular vertical. This was done by evaluation of the morphology of the cervical vertebrae C2 through C4 from 30 cephalometric radiographs using questions to 10 practicing orthodontists trained in the
CVM method. They conclude that the CVM method has an overall poor reproducibility and they do not support its use as a strict clinical guideline for the timing of orthodontic
treatment.
Maria Rita Giuca et al (2012) 71 compared skeletal maturation in obese patients and in subjects of normal weight. According to the carpal analysis obese subjects showed
a high mean discrepancy between skeletal and chronologic ages compared with normal weight subjects. Obese subjects had a significantly higher cervical vertebral maturation
[25]
To account for the earlier growth in obese patients with skeletal discrepancies
they proposed to perform earlier examinations and treatments than in normal weight subjects.
Sushilkumar et al (2012) 72 investigated whether second molar calcification stages can be used as a reliable diagnostic tool to determine skeletal maturity. Panoramic radiographs and lateral cephalograms they used to estimate dental maturity with
Demirjian index (DI) and skeletal maturity with Hassel-Farman method (CVMI).
They found a highly significant association between DI and CVMI. DI stage E
corresponded to stage 2 of CVMI (Pre-peak) and DI stages F & G corresponded to stages 3 & 4 of CVMI (Peak) and DI stage H corresponded to stages 5 & 6 of CVMI (End of pubertal growth spurt).
They found that the appearance of each CVMI stage was consistently earlier in female than in male however the DI stages were more advanced in male subjects as
compared with female subjects in relation to CVMI stages. Thus they conclude that the mandibular second molar DI stages are a reliable indicator of skeletal maturity.
Ramy Abdul Rahman Ishaq et al (2012)20 evaluated the applicability of insulin-like growth factor I (IGF-I) blood level as a maturation indicator by correlating it to the cervical vertebral maturation index. A lateral cephalometric radiograph and a blood
sample were taken from 120 subjects for assessing the cervical vertebral maturation and IGF-I serum level respectively.
Results showed that the IGF-I mean value at each cervical vertebral maturation
stage was statistically different from the mean values at the other stages. The highest mean values were observed in stage 4, followed by stage 5 in males and stage 3 in
[26]
Guiseppe Perinetti et al (2012) 19 evaluated the gingival crevicular fluid (GCF) protein content and alkaline phosphatise (ALP) activity and co-related it to stages of skeletal maturation. The total GCF protein content was similar between the different
growth phases. On the contrary, the total ALP activity showed a peak for the pubertal growth phase.
The normalized GCF- ALP activity was only poorly associated with growth
phase. No differences were seen between the maxillary and mandibular sites, or between the sexes, for any GCF parameter. The results show that the total GCF protein content is
not sensitive to the growth phase; however, GCFALP activity has potential as a diagnostic aid for identification of the pubertal growth phase in individual subjects when expressed as total, but not normalized values.
Rodrigo Cesar Santiago et al (2012)73 conducted a systematic review of 23 studies to evaluate the quantitative and qualitative accuracy and reproducibility of the
CVM method. Analysis showed a moderate to high statistically significant correlation between the CVM and the hand-wrist maturation methods. There was a moderate to high reproducibility of the CVM method. They conclude that the assessment of skeletal
maturation stages has serious methodological failures and better designed studies with adequate accuracy reproducibility and correlation analysis should be performed.
A. Oskis et al (2012)74 examined differences in the diurnal patterns of cortisol and DHEA secretion in healthy adolescent girls. Fifty-six healthy females aged 10–18 years provided saliva samples at 0 and 30 min (morning samples) and 12 hour
post-awakening on 2 consecutive weekdays. They found that unlike the cortisol pattern, characterised by a marked awakening response, a significant rise in DHEA concentration
[27]
Jennifer L.J. Heaney et al (2012)75 examined the relationship between ageing, physical function and the diurnal rhythms of cortisol and dehydroepiandrosterone (DHEA). Participants were 36 community dwelling older adults aged between 65 and 86
years old. Salivary cortisol and DHEA were measured over the course of one day: immediately upon awakening, 30 min later, and then 3 hr, 6 hr, 9 hr and 12 hr post-awakening. There were no interactions between function scores and sex for either
cortisol or DHEA. Older participants exhibited lower DHEA levels. DHEA secretion appears to be most reduced in the morning period resulting in a flatter diurnal rhythm
among the oldest old.
Mary E. Saczawa et al (2013)76 examines the relationship between pubertal status and individual cortisol and DHEAS levels as well as with the cortisol/DHEAS
ratio. Tanner staging of pubic hair growth was used to rate the pubertal status. Morning salivary cortisol and urinary DHEAS levels were obtained for 267 young adolescents at
three time points, each approximately one year apart. They concluded that pubic hair development was a significant predictor of change over time in DHEAS but not cortisol.
Iva A.E. Bicanic et al (2013)77 measured the salivary cortisol and dehydroepiandrosterone sulfate (DHEAS) in 52 female adolescent rape victims with post-traumatic stress disorders (PTSD) and 37 healthy adolescents at 0, 15, 30, 45 and 60
min after awakening, both under basal conditions and after 0.5 mg dexamethasone administration. Compared to age-matched controls, adolescent rape victims with PTSD showed significantly reduced cortisol and DHEAS levels. No group differences for the
[28]
Mohammed Zahid Hussain et al (2013)78correlated serum PTHrP levels to the 6 skeletal maturation stages. Peak serum PTHrP levels did not correlate with early pubertal stages characterized by maximum growth increments. They conclude that
validity of using serum PTHrP levels as biomarkers in predicting peak growth velocity is questionable.
Giuseppe Perinetti et al (2013) 79 performed a diagnostic performance assessment of combined canine and second molar maturity for identification of growth phase. The diagnostic performance of the dental maturity for identification of specific
stages of skeletal maturity was found to be limited. The developmental status of the mandibular canine and the second molar was found to be useful only in the diagnosis of pre-pubertal and post-pubertal growth phases.
The combination of the maturational stages of these two teeth provides a slightly improved diagnostic performance for the identification of pubertal growth phase but
remains unsatisfactory.
Kervin B. Mack et al (2013) 80 assessed the relationship between Body Mass Index (BMI) percentile and skeletal and dental maturation. Raw BMI scores were
calculated by using height and weight data. The raw BMI score, age and sex were used to obtain the BMI percentile value for each subject with age and sex- specific growth
charts. BMI percentile categories were designated: Less than Fifth BMI percentile – Underweight; Fifth to Eighty fifth percentile - normal weight; Eighty fifth to ninety fifth percentile – overweight and greater than the ninety fifth percentile – obese. Skeletal
maturation was assessed by the CVM method and dental age with the Demirjian assessment method. The results showed advanced CVM stage and dental age in subjects
[29]
Raphael Patcas et al (2013)81 compared the radiation doses of a lateral cephalogram radiograph with and without thyroid shield and a hand-wrist radiograph. Thermoluminescent dosimeters were placed at 19 different sites in head and neck of a
tissue-equivalent human skull. The effective doses were calculated using 2007 International Commission on Radiological Protection recommendations. The effective dose for conventional lateral cephalogram without a thyroid shield was 5.03
microsieverts (μSv), with a thyroid shield was 3.30 μSv and that of a conventional hand-wrist radiograph was 0.16 μSv.
This study demonstrates that, based on the overriding ALARA (As Low As Reasonably Achievable) principle, the assessment of skeletal maturation of cervical vertebrae on a lateral cephalogram is to be questioned and the use of a thyroid shield is
strongly to be advocated. If an evaluation of skeletal age is necessary, an additional hand-wrist radiograph seems much more justifiable than removing thyroid shield, which
would cause highly vulnerable thyroid tissue to be exposed to direct radiation.
Nayak et al (2014)82 investigated the relationship between salivary IGF-I and cervical vertebral maturation. The Salivary IGF-I levels and salivary secretion rates were
lowest at QCVM skeletal stages previously associated with acceleration phase of mandibular growth. Highest levels were found at high velocity stage. After this there was
gradual drop in salivary IGF-I levels and secretion rate at deceleration and completing velocity stages. Relatively high levels in decelerating velocity stage may be an indication of residual skeletal growth. There was a negative correlation between patient age and
[30]
Shahla Momei et al (2014) 83 re-assessed the agreement between CVM and HWM in patients with short stature. They studied 76 persons with familiar short stature and 102 persons with non-familiar short stature. Based on the findings of this study they
concluded that CVM can be a reliable method of determining skeletal maturation in patients with short stature. The reliability was greater for girls in the familial short stature group and for boys in the non-familial short stature group.
Vandewalle S et al (2014)84 studied the association of adrenaline derived steroids with skeletal maturation, areal and volumetric bone mineral density (aBMDand
vBMD) and bone geometry in healthy prepubertal and early pubertal boys. Ninety-eight healthy male children and adolescents were divided into 65 prepubertal (Tanner genital stage 1) and 33 early pubertal ( Tanner genital stage 2). DHEAS was determined by
immunoassay. Whole body and lumbar spine aBMD and bone area were determined by dual-energy X-ray absorptiometry.
Trabecular (distal site) and cortical (proximal site) vBMD and bone geometry were assessed using peripheral QCT. Skeletal age was determined by X-ray of the left hand. Results showed that the DHEAS is positively associated with bone age in
prepubertal and early pubertal children, independently of age. There are no associations between the adrenal-derived steroids and the studied parameters of bone size or BMD.
Tue Soeborg et al (2014)85 evaluated the influence of sex, age, pubertal development and oral contraceptives on dehydroepiandrosterone (DHEA), DHEA sulfate (DHEAS) and few other steroids. 1798 serum samples from healthy volunteers were
[31]
Their findings indicated a higher concentration of DHEA and DHEAS in males
than in females at any given age whereas the DHEA/DHEAS ratio was higher in females than in males. They also found that all steroid metabolite concentrations were positively
[32]
Materials used in the study
1. Mouth mirror, Periodontal probe, Tweezer
2. X- Ray machine ( Sirona Orthophos XG5) 3. X-Ray film ( Konica Minolta)
4. X-Ray Viewer
5. 50 ml sterile plastic vials (labelled) 6. Transporting thermo-sealed ice box
7. Coolant gel packs and Dry ice 8. - 4° C Domestic freezer 9. -20°C Lab Freezer
10. Micro – centrifuge ( Remi CPR 24 plus) 11. Centrifuge vials
12. Precision pipettes and disposable pipette tips 13. Vortex mixer ( IKA vortex Genius 3 )
14. Deionized water
15. Beaker
16. Absorbent paper
17. Salivary DHEA assay kit (Salimetrics)
18. Immunoassay analyzer (Spectrostar Nano microplate reader)
[33]
Approval
Approval for the study was obtained from the Ethical Committee of Sri Ramakrishna Dental College and Hospital, Coimbatore.
Sample Size Calculation
A power analysis estimated the sample size to be 66 to detect meaningful differences between the groups at a power of 80% and significance of 0.05.
Sample Size
Sample for the study comprises of 66 subjects of both sexes with an age
distribution between 9 and 18 years segregated into 3 groups of 22 each. Sample Selection
Subjects were selected according to the following inclusion and exclusion criteria.
Inclusion criteria
Age Range: 9- 18 yrs
Good general health Good oral hygiene
Full mouth bleeding score ≤ 25% ( according to Perinetti et al19 ) Exclusion criteria
Subjects with systemic diseases
Subjects under any medication Gingivitis and Periodontitis
Oral ulcers
Subjects with mobile deciduous teeth
[34]
Methodology
The subjects and their parents were informed about the procedures that would be undertaken in the study and a signed consent form was obtained from them. (Annexure
I). Oral screening of the subjects was performed during the first clinical examination using a mouth mirror, periodontal probe (Figure 4) and the gingival bleeding index was noted in the examination form. (Annexure II)
Lateral cephalograms of the selected subjects were taken in natural head position (Figure 5) with the cephalostat in the Sirona Orthophos XG5( Sirona, Munich, Germany)
X-ray machine at 73kV, 15 mA and an exposure time of 9.4 seconds using medical film (Konica Minolta).
The X- rays were mounted on the X-Ray viewer (Figure 6) and visual assessment
of the skeletal maturity was performed with the Cervical Vertebral Maturation method given by Bacetti and Franchi 14. The Cervical Vertebral maturation method14 constitutes of analysis of the morphology of the bodies of the second (C2- the odontoid process), third (C3) and the fourth (C4) cervical vertebrae. The two factors studied include
1. Presence or absence of a concavity at the lower border of the body of C2, C3, and C4; and
2. Shape of the body of C3 and C4.
Based on these parameters the cervical vertebral maturation stages are distinguished as the following six stages. CS1, CS2, CS3, CS4, CS5 and CS6. (Figure 7)
[35]
The subjects belonging to each of the 6 stages were segregated and then clustered
into 3 groups of 22 subjects each with each group representing one of the 3 growth phases – Group 1 : Pre-pubertal group – Subjects belonging to CS1, CS2
Group 2 : Pubertal group – Subjects belonging to CS3, CS4 Group 3 : Post-pubertal group –Subjects belonging to CS5, CS6
Each of the groups had a uniform distribution of 11 males and 11 females to
eliminate gender bias.
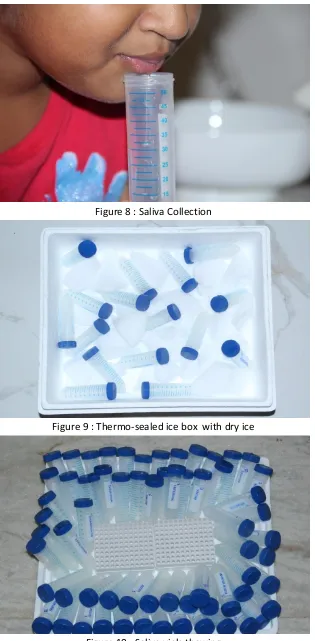
Saliva Collection Procedure
Saliva was collected in labelled plastic vials at a standard time of 10 am in order to exclude the diurnal variation in the salivary DHEA levels as shown by Robert L. Matchock et al.48 (Figure 8)The following instructions were given to the subjects before collection of the saliva sample.
Instructions to the patients86:
1. Refrain from eating and drinking with the exception of water within 60 min
prior to collection
2. Rinse mouth with water to remove food residue 3. Swallow to increase hydration
4. Wait for 10 min after rinsing to avoid dilution of the sample
5. Allow saliva to pool in the mouth (thinking about favourite food might help) 6. Drool passively into the plastic vial up to the 1mm mark (Saliva might foam
so the level of saliva has to reach the mark not the foam)
Storage
The samples were refrigerated at -4°C immediately after collection (within 30
[36]
avoid bacterial growth in the specimen. Transfer from the domestic freezer to the
laboratory was done in insulated ice box packed with dry ice (Figure 9).
Assay
On day of assay, the saliva samples were thawed completely by holding at room temperature for 30 min (Figure 10). Then they were vortexed for 10 sec at speed 4 in IKA vortex Genius 3 (Figure 14) to disperse the salivary components (Figure 17). 1 ml
of each sample was micropipetted (Figure 18) with fixed volume micropipette into numbered 1.5 ml capacity centrifuge vials (Figure 2). Centrifuging at 3000 rpm for 15
minutes at 1500g relative centrifugal force (RCF) performed in Remi CPR 24 plus refrigerated centrifuge (Figure 19) provided a clear supernatant. This removes mucins and other particulate matter which may interfere with antibody binding and thereby
affecting the results.
Saliva samples were refreezed as soon as possible after adding to the assay plate
and re-centrifuged each time they are thawed. Multiple freeze-thaw cycles were avoided86.
Reagent preparation
All the reagents in the Salimetrics DHEA Immuno Assay kit (Figure11 and 12) were brought to room temperature .The microtitre plate (Figure 13) was also brought to
room temperature with the foil pouch sealed.
Wash buffer 1x was prepared by diluting Wash Buffer Concentrate (10X) 10-fold with room-temperature deionized water (100 mL of Wash Buffer Concentrate (10X) to
[37]
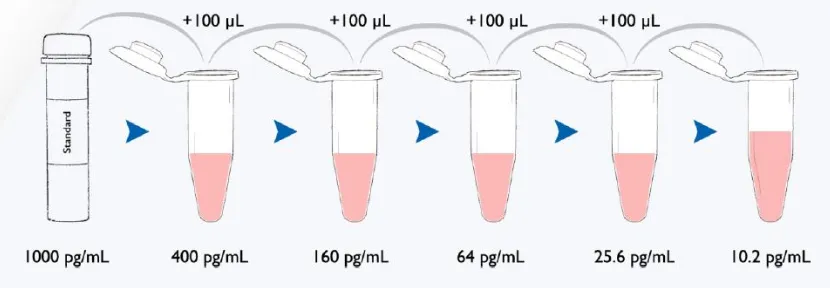
Preparation of serial dilutions of the DHEA Standard :
Five polypropylene microcentrifuge tubes were labelled S2 through S6.
150 μL of assay diluent was pipetted into tubes S2 through S6.
Serially dilution of the standard 2.5X was done by adding 100 μL of the 1000
pg/mL standard (tube 1) to tube S2 and mixed well.
After changing pipette tips, 100 μL was pipetted from tube S2 to tube S3 and
mixed well.
[image:46.595.100.515.327.471.2] The procedure was continued for tubes S4, S5, and S6.
Figure 24: Serial dilution method
[38]
Assay Procedure
[image:47.595.71.553.133.356.2]The plate layout was determined as below.
Figure 25: Plate layout
The micro-titre plate was taken out of the foil pouch. The desired number of
strips was placed in the strip holder (Figure 13). The remaining strips were broken apart and placed back in the foil pouch. The foil pouch with unused wells and desiccant was
resealed and stored at 2-8°C.
Step 1 : 18 mL of assay diluent was pipetted using the micropipette into the disposable tube
Step 2 : 50 μL of standards, controls, and saliva samples were pipetted into appropriate wells. (Figure 22)
Step 3 : 50 μL of assay diluents was also pipetted into 2 wells to serve as the zero. Step 4 : 50 μL of assay diluents was pipetted into each NSB well.
Step 5 : The enzyme conjugate was diluted 1:1500 by adding 12 μL of the conjugate to
the 18 mL tube of assay diluent. The diluted conjugate solution was immediately mixed and 150 μL was added to each well using a micropipette.
1 2 3 4 5 6 7 8 9 10 11
A 1000Std 1000Std Smp-1 Smp-9 Smp-17 Smp-25 Smp-33 Smp-41 Smp-49 Smp-57 Smp-65
B 400 Std 400 Std Smp-2 Smp-10 Smp-18 Smp-26 Smp-34 Smp-42 Smp-50 Smp-58 Smp-66
C 160 Std 160 Std Smp-3 Smp-11 Smp-19 Smp-27 Smp-35 Smp-43 Smp-51 Smp-59
D 64 Std 64 Std Smp-4 Smp-12 Smp-20 Smp-28 Smp-36 Smp-44 Smp-52 Smp-60
E 25.6 Std 25.6 Std Smp-5 Smp-13 Smp-21 Smp-29 Smp-37 Smp-45 Smp-53 Smp-61 Ctrl-H
F 10.2 Std 10.2 Std Smp-6 Smp-14 Smp-22 Smp-30 Smp-38 Smp-46 Smp-54 Smp-62 Ctrl-H
G Zero Zero Smp-7 Smp-15 Smp-23 Smp-31 Smp-39 Smp-47 Smp-55 Smp-63
[39]
Step 6 : The adhesive cover provided was placed over the plate. The plate was placed on
a plate reader and shaken for 5 minutes and incubated at room temperature for a total of 3 hours.
Step 7 : After 3 hours the plate was washed 4 times with 1X wash buffer by pipetting 300 μL of wash buffer into each well and then discarding the liquid over a sink. After
each wash, the plate was thoroughly blotted on paper towels before turning upright.
Step 8 : 200 μL of TMB Substrate Solution was added to each well with a micropipette. (Figure 22)
Step 9 : The plate was placed in the plate reader and shaken for 5 minutes and incubated in the dark (covered) at room temperature for an additional 25 minutes. 50 μL of Stop
Solution was added with a micropipette. All the wells turned yellow (Figure 23).
Step 10 : The bottom of plate was wiped with a water-moistened paper towel and wiped dry. The plate was read in a Spectrostar Nano microplate reader, (B.M.G.Labtech
GmbH, Germany) at 450 nm within 10 minutes of adding Stop Solution.(Figure 20) Calculations
1. The average optical density (OD) was computed for all the duplicate wells
2. The percent bound (B/Bo) for each standard, control, and saliva sample by dividing the OD of each well (B) by the average OD for the zero (Bo) was calculated.
3. 4-parameter non-linear regression curve fit was done to obtain a standard curve.