South-East Queensland Irrigation Futures
Research and Development Support
Progress Report
A.D. McHugh and J. Eberhard
National Centre for Engineering in Agriculture
University of Southern Queensland
Toowoomba
NCEA Publication
1004089/09
21 December 2011
ii
Disclaimer
While the National Centre for Engineering in Agriculture and the authors have prepared this document in good faith, consulting widely, exercising all due care and attention, no representation or warranty, express or implied, is made as to the accuracy, completeness or fitness of the document in respect of any user's circumstances. Users of the report should undertake their own quality controls, standards, safety procedures and seek appropriate expert advice where necessary in relation to their particular situation or equipment. Any representation, statement, opinion or advice, expressed or implied in this publication is made in good faith and on the basis that the National Centre for Engineering in Agriculture, its agents and employees, and Queensland Department of Environment and Resource Management are not liable (whether by reason of negligence, lack of care or otherwise) to any person for any damage or loss whatsoever which has occurred or may occur in relation to that person taking or not taking (as the case may be) action in respect of any representation, statement or advice referred to above.
Published in December 2011 by the National Centre for Engineering in Agriculture, Toowoomba. Material from this publication may not be used unless prior written approval has been obtained from the National Centre for Engineering in Agriculture and Queensland Department of Environment and Resource Management.
This document should be cited as follows:
McHugh, A.D. and Eberhard, J., 2011. South-East Queensland Irrigation Futures Research and Development Support Project, Progress Report 2011. National Centre for Engineering in Agriculture Publication, 1004089/09, USQ, Toowoomba.
Acknowledgements
This work was principally funded by the Queensland State Government through its Department of Environment and Resource Management as part of the South-East Queensland Irrigation Futures program and the University of Southern Queensland. Many of the activities undertaken within this project were conducted in collaboration with staff from; Growcom Ltd, Queensland Turf Producers Association, Nursery and Garden Industry Queensland, Queensland Dairy Organisation and their associated clients. The involvement of these staff and organisations is gratefully acknowledged.
iii
Key Achievements Horticulture
Provided crucial evidence for the need for spatial variability of soil prior to selection, purchase and commissioning of irrigation systems.
Developed innovative proximal sensors for real time irrigation adaptive control
Packing shed energy audits can conservatively save 10% of energy consumption with minimal investment.
Energy efficiency options, especially for refrigeration, are virtually unknown by participating farmers.
According to farmers they need education in Conservation Agriculture (CA), spatial technologies, machinery design and economics of converting to CA.
Dairy
Extensive soil variability and uniform irrigation application has had an adverse impact on fodder production.
Variable rate irrigation simulations indicate >20% water savings through not irrigating laneways, tracks, non productive zones and gullies.
Development of proximal sensors to monitor real time irrigation performance and crop responses. Tests show that data can be reviewed remotely, analysed locally, downloaded by ftp or transmitted by 3G/4G technology.
Turf
Identified significant issues with irrigating and land surface management that are impinging on the performance of the turf harvester, i.e. decreased WUE.
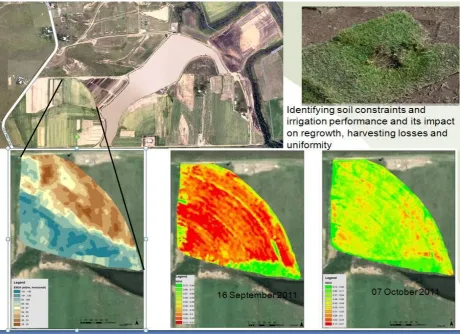
Turf regrowth from September is non-uniform and appears directly related to soil conditions and the soil gradation from the top of the slope to the gully regions. Sensors would indicate that water logging in the heavy soil (low slope) and the lack of soil moisture on the upper slopes contribute equally to poor turf production. Data suggests that this centre pivot irrigator would be an ideal candidate for VRI. Irrigator mounted real time proximal sensors (under development) will confirm irrigation and crop performance.
Generally turf harvesters do not come equipped with yield monitors and/or GPS systems, although the manufacturers in Australia admit that they should. We have adapted a high resolution RTK GPS sensor to track the harvester (2cm accuracy) and other sensors to detect ejected turf. When the site is harvested in February all the elements gathered through EM38 surveys, weekly NDVI surveys and soil sampling about a turf loss point will be brought together to identify the cause and possible remediation.
Nursery
The PWBS has been upgraded with 15kg sensors, water proofed and software improved as per the client‟s request. Within a few clicks, following downloading, IDO‟s can confidently display data to the grower on site and in a format that is flexible and informative.
Irrigation data suggests that 30% of applied water to the potted plant is subjected to drainage. In addition to the irrigation water that does not enter the pot this is a considerable amount of non productive water that requires recycling and re-pumping.
iv
Contents
1. Introduction ... 1
2. Priority Activities 2010-2011 ... 1
2.1. Horticulture ... 1
2.1.1. On Growcom designated farm(s) conduct research on the application of precision irrigation, utilising proximal sensors and adaptive control strategies. ... 1
2.1.2. Further develop, refine and assist with the packing shed water / energy audits process to provide opportunities for the application of alternative energy sources. ... 1
2.1.3. On farm dam storage performance and seepage mitigation... 1
2.1.4. Scope GHG emission mitigation under CA/CT farming systems. ... 1
2.2. Dairy ... 1
2.2.1. On the QDO demonstration farm conduct research on the application of precision irrigation, utilising available proximal sensors and adaptive control strategies. 1 2.3. Turf ... 2
2.3.1. On the QTPA designated farm conduct on-farm research trial to demonstrate the linkages between on-farm management and turf production (WUE). ... 2
2.4. Nursery ... 2
2.4.1. Application of precision irrigation technology to designated Nursery sites. ... 2
2.4.2. On NGIQ designated sites provide information on managing in-field variability, resource management and climate change mitigation. ... 2
3. Detailed activities... 3
3.1. Horticulture ... 3
3.1.1. Precision Irrigation... 3
3.1.2. Water productivity under LM & CP irrigation on variable soils. ... 3
3.1.3. Packing shed energy audits ... 4
3.1.4. On farm dam storage performance and seepage mitigation... 5
3.1.5. Scope GHG emission mitigation under CA/CT farming systems. ... 6
3.2. Dairy ... 8
3.2.1. The application of precision irrigation, utilising available proximal sensors and adaptive control strategies... 8
3.3. Turf: ... 11
3.3.1. Demonstrate the linkages between on-farm management and turf production. 11 3.4. Nursery ... 14
3.4.1. Application of precision irrigation technology to designated Nursery sites. ... 14
1
1. Introduction
Over the period 2010-2013 the project sought to provide specialist research support resources based on the tools and technology previously identified to the industry and NRM groups of SEQ, as well as new tools identified in collaboration with industry groups. The scope and activities of the R & D program is directed by the priorities of the SEQIF stakeholders. These are identified through the annual consultative process and ongoing review by the project steering and management committees established by SEQIF. Specific project milestones and outcomes are formulated and approved annually under the SEQIF steering committee in accordance with Schedule 2 of the contract.
Following the 2010-2011 annual report minor adjustments and clarification of activities was required to cope with the changing landscape and stakeholder requirements. A revised synopsis of stakeholder priorities and activities are outlined below in accordance with discussions and reviews undertaken during the reporting process.
2. Priority Activities 2010-2011
2.1. Horticulture
2.1.1. On Growcom designated farm(s) conduct research on the application of
precision irrigation, utilising proximal sensors and adaptive control strategies.
2.1.1.1.A soil survey for optimum deployment of instruments and identification of variability constraints.
2.1.1.2.Determine water productivity on vegetable production under LM & CP irrigation on variable soils.
2.1.1.3.Develop complementary soil and productivity spatial layers and determine the linkages with irrigation performance data.
2.1.1.4.Monitor seasonal crop and irrigation performance to identify opportunities for productivity gains
2.1.2. Further develop, refine and assist with the packing shed water / energy audits process to provide opportunities for the application of alternative energy sources.
2.1.2.1.Conduct level 2 energy audits on 3 farms.
2.1.3. On farm dam storage performance and seepage mitigation.
2.1.3.1.Conduct dam seepage surveys.
2.1.4. Scope GHG emission mitigation under CA/CT farming systems.
2.1.4.1.Scoping activities for promotion and demonstration of CA in Horticulture. 2.1.4.2.Identification of collaborators (farmers)
2.1.4.3.Identification of limitations to adoption 2.1.4.4.Identify appropriate monitoring activities
2.2. Dairy
2.2.1. On the QDO demonstration farm conduct research on the application of precision irrigation, utilising available proximal sensors and adaptive control strategies.
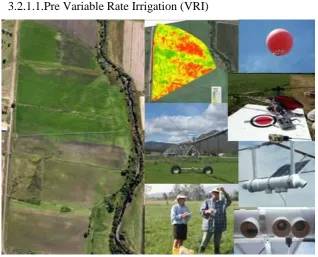
2.2.1.1.Pre Variable Rate Irrigation (VRI): Understand the current variability in soil, topography, fertility, grazing management and yield. Development and deployment of irrigator mounted sensors.
2 2.2.1.3. Model whole of field response based on point measurement (Dry matter/yield) and spatial data (EM38 – determination of soil moisture change, NDVI – crop response to soil constraints and fertiliser). Develop strategies/scenarios to cope with variability and to increase pasture performance.
2.3. Turf
2.3.1. On the QTPA designated farm conduct on-farm research trial to demonstrate the linkages between on-farm management and turf production (WUE).
2.3.1.1.Utilising NutriCalc, field losses and proximal sensors (Cone penetrometer, NDVI & EM38) to determine production responses to soil condition, fertiliser and irrigation application.
2.3.1.1.1. Utilising real time yield losses (from harvester) spatially determine the location and assigned causality (agronomy, compaction, irrigation) to the losses.
2.3.1.1.2. Encourage farmer to conduct soil and sod analysis to determine nutrient removal rates and record in NutriCalc.
2.3.1.1.3. Record fertiliser application, quantity and type in NutriCalc.
2.3.1.1.4. Utilise NDVI to understand spatial variability of fertiliser response. 2.3.1.1.5. Utilise EM38 to determine spatial variability of irrigation responses.
2.3.1.1.6. Link spatial mapping, fertiliser management, irrigation application, soil condition to yield losses.
2.4. Nursery
2.4.1. Application of precision irrigation technology to designated nursery sites.
2.4.1.1.Deployment, evaluation and development of portable weight based sensing (PWBS) system.
2.4.1.2.Motivation for additional PWBS systems (advanced, cheaper & with remote access). 2.4.1.3.Development of the user interface and data outputs
2.4.1.4.Analysis and interpretation of PWBS data to motivate for broader adoption of effective precision irrigation control.
2.4.2. On NGIQ designated sites provide information on managing in-field variability, resource management and climate change mitigation.
2.4.2.1.Conduct level 2 energy audits on five (5) NGIQ identified production nurseries in SEQ.
2.4.2.1.1. Utilise EnergyCalc to record and report energy use. If required, further develop and refine EnergyCalc for particular processes.
3
a
.
b
.
3. Detailed activities
3.1. Horticulture
3.1.1. Precision Irrigation.
3.1.1.1.Soil survey.
Services were not required in this reporting period
3.1.2. Water productivity under LM & CP irrigation on variable soils.
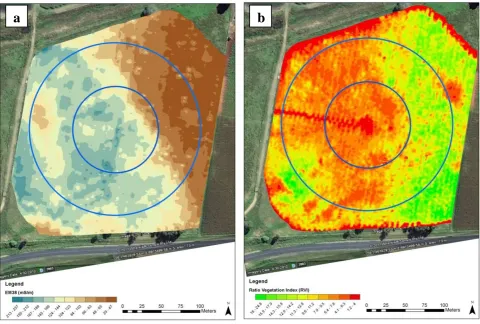
We have investigated irrigation and crop performance at a newly installed CP near Kalbar. We have identified significant soil variability (Figure 1) which dissects the pivot and has caused considerable irrigation scheduling and production issues under the current operational scenarios. Figure 1a is the EM38 survey which shows a significant change from heavy clay (blue) to a lighter soil (brown) from west to east.
The resultant NDVI survey (Figure 1b) of the recent bean crop clearly indicates a crop response to the variable soil conditions. Green indicates higher crop vigour compared to the red areas, which is indicative of crop stress due to limitations in the heavier soil. The solution is to manually manage the western half of the pivot differently than the eastern section, i.e. less water more often.
A sensor array (Figure 2) has been developed and constructed which attaches to the pivot and provides real time crop and irrigation performance data. These sensors which include temperature, crop height, Vis and IR will track crop performance during and after irrigation. The information can
[image:7.595.56.537.316.640.2]4 be manipulated onboard and/or remotely. Canopy temperature will assess irrigation effectiveness and requirement. NDVI and crop height gives an indication of crop vigour and growth.
Other surveys will be conducted concurrently with a Growcom irrigation system assessment.
3.1.3. Packing shed energy audits
Energy audits have been conducted at three packing sheds, two in the Lockyer Valley and one in the Fassifern Valley. One in the Lockyer Valley is complete, while the other two are in progress.
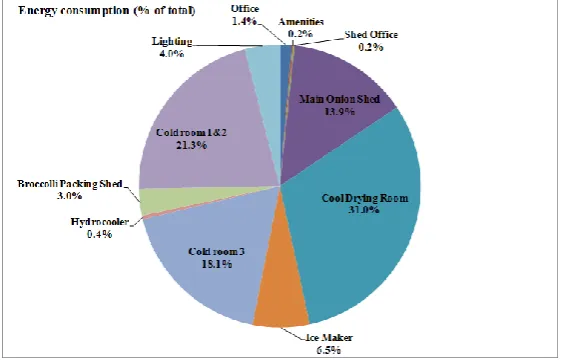
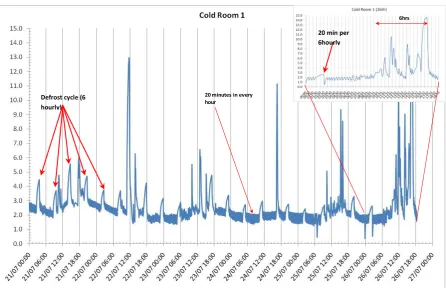
Each audit process involved 2 interviews and 2 walkthroughs; One to audit the equipment and another to understand the operations and equipment run times. Typical disaggregation of consumption is shown in Figure 3 which also shows main consumption is from refrigeration. Temperature sensors were placed in refrigeration systems to assess performance and electricity consumption (Figure 4). This data is indicative of inefficiencies such as cyclic defrost and excessive run times.
What is common to all sites was the level of poor understanding of the electricity account. With the appropriate knowledge substantial savings can be made by negotiating the various charges/tariffs, especially the more complex and expensive network charges.
Activities such as load shedding, shifting
and shaving are concepts that are of
particular interest to the managers who currently have little understanding of the options for possible savings, if implemented. One farmer, with an installed generator, can immediately save 11% ($9600) off his annual electricity bill by running it for less than 2 hours per day (Figure 5b).
Generally refrigeration systems are basic in design and often consume >60% of the electricity (Figure 3). Therefore consideration for modernisation and high technology controllers should be a priority. It would appear that even new installations are well behind efficiency and technology standards of the USA and Europe (Figure 5a). For example high efficiency refrigerants such as ammonia are not used, on-demand defrosting and variable pressure heads are also not employed. Therefore considerable efficiencies can be gained through modernisation and advanced refrigeration technology.
[image:8.595.56.393.70.231.2]The audits are extensive, in that they propose changes that offer10-20% savings with little to no costs. With investment into infrastructure considerably more savings can be achieved and these are
Figure 2. PA in Horticulture - Spatial and real time crop performance data for adaptive control and variable rate technology. Sensors include crop canopy temperature, Vis & IR (NDVI), crop height 3/4G telemetry coupled with a mini computer to log data and transmit to; PC, the cloud or irrigation controller.
[image:8.595.54.337.460.640.2]5
6hrs
20 minutes in every hour
20 min per 6hourly defrost
Defrost cycle (6 hourly)
a b
also discussed and laid out in terms of what is available and the return to capital, e.g.….LED lighting systems, solar power, refrigeration upgrades, variable speed evaporator motors, insulation, shade,
load shedding etc.
3.1.4. On farm dam storage performance and seepage mitigation.
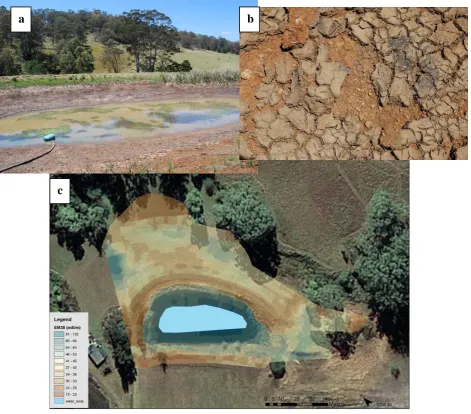
[image:9.595.63.510.119.407.2]Dam wall and floor integrity surveys in Lowood and Palmtree (Figure 6a) identified zones of possible failure and or extent of leaks. The process has provided graphic evidence of mitigation requirements when coupled with evaporation and seepage data conducted by Growcom. The process
Figure 4. Refrigeration operation indicating defrosting cycles which occur for 20minutes in every 6 hour whether it is required or not. Compressor run times can be excessive and evaporators run 24/7.
[image:9.595.54.506.460.637.2]6
a b
c
involves an extensive survey usually by handheld devices (EM38 and GPS) and conversion of the data into spatial representations of the site (Figure 6c). Often information from sites such as
Nearmap and Google earth are used to enhance the graphics. The information has been extremely
useful in targeting leak mitigation, but more importantly targeting potential risks of leaks and breaching such as those indicated in Figure 6b&c. The clay seal on the dam floor Figure 6b is typical of conditions found when the dam is allowed to dry out, and on refilling it tends to leak.
Scope GHG emission mitigation under CA/CT farming systems. 3.1.4.1.Scoping activities for promotion and demonstration of CA. 3.1.4.1.1. Identification of collaborators (farmers)
Three farmers, Ed Windley (Harrisville), Linton Brimblecombe (Forest Hill) and Rob Hinrichsen (Kalbar) have collaborated closely in scoping activities, especially in promotion of CA.
3.1.4.1.2. Identification of limitations to adoption
[image:10.595.64.536.169.583.2]7 From the 5th WCCA inc 3rd FSD Brisbane, Sept 25-29 2011: Congress Workshop Report which was written and convened by John McPhee, University of Tasmania and Jack McHugh, University of Southern Queensland. The workshop was attended by ~80 people, (~25% growers, ~50% R, D & E). The objectives were:
To identify and make recommendations on the priority issues for research, development and adoption of controlled traffic and zero/reduced tillage practices in intensive vegetable production.
Convenor presentations covered the barriers to, and opportunities for, controlled traffic and reducing tillage in vegetable production, before three growers spoke on their experiences in implementing controlled traffic in their production systems.
The facilitated discussion produced the following outcomes and recommendations.
Outcomes: CTF implementation challenges
Current practices are ingrained in culture – growers have a system that “works” and are reluctant to trial a system that may require major equipment and cultural changes which are difficult to reverse if they can‟t get the system working
Growers are not sure how the change will affect factors like planting configuration, nutrition etc.
Lack of compatibility in mechanisation (particularly harvesters) across a diversity of crops and an absence of machinery development in the market place
lack of knowledge/expertise amongst growers in relation to spatial technologies (e.g. guidance, mapping etc.) and equipment modifications
maintaining tractor stability on compacted wheel tracks
the change is perceived to be uneconomical for small farm sizes
Very limited economic case studies are available to demonstrate the costs and benefits of change. Many of the costs of not changing do not have an immediate impact (e.g. soil degradation)
there is no defined industry leadership to encourage the change
Research, development, extension and adoption challenges;
RD&E projects only attract short-term funding, growers are interested in long-term evaluations
machinery integration to accommodate crop diversity and use of contractors
lack of business, agronomic and economic modelling and case studies built on statistically relevant yield information
changes to agronomy to capitalise on reduced preparation time and altered cropping frequency
lack of „on farm‟ trials and demonstration sites
Recommendations:
More education and demonstration on spatial technologies in relation to controlled traffic and vegetable production in general
Extension of the costs and benefits of CTF, including analysis of the real costs of not changing (e.g. environmental costs through land degradation and erosion)
Case studies and demonstration sites to track economic impacts and for extension activities
Collaboration (government, CMA/NRM groups, growers, consultants) to share experiences and agronomic advice
Collaboration (government, CMA/NRM groups, growers, machinery companies) to develop modifications and re-design of machinery to allow equipment integration.
3.1.4.1.3. Identify appropriate monitoring activities
8 In a PA study in collaboration with CTF solutions and Growcom we have conducted NDVI surveys of the impact of irregular planting. The data appears to indicate that there are differences in crop performance, emergence and possible relationship to PA or the lack thereof (Figure 7)
3.2. Dairy
3.2.1. The application of precision irrigation, utilising available proximal sensors and adaptive control strategies.
3.2.1.1.Pre Variable Rate Irrigation (VRI)
[image:12.595.57.501.129.340.2]Throughout this last rye grass season we have conducted soil analysis and site characterisation and correlated that to EM38 data. Aerial and ground surveys have identified zones of variable crop performance and target areas for subfield monitoring (Figure 8). Grazing strategies and dry matter measurements in the target sub field level have identified yield responses to grazing pressure and soil/water constraints (Figure 9). The purpose of which is to provided base line information to program the VRI e.g. soil data, and DM response data to further enhance the spatial information. The integrated soils and yield data provide the basis on which the VRI can be initially programmed and finetuned as more data becomes available from the existing and future crops e.g. NDVI (Figure10).
Figure 7. Onion production near Kalbar. Onions planted too close to the bed edge or planted irregularly can be exposed by irrigation and rainfall erosion.
[image:12.595.46.365.442.699.2]9 Irrigator mounted sensors have been developed and are currently under test. Proximal sensors provide real time data on irrigation and crop performance so that subsequent irrigation applications can be adapted to optimise performance. Sensors include crop temperature, crop height, Vis and NIR. As the irrigator rotates, real time data is logged and or streamed to a PC, cloud or controller (future condition) so that the farmer can monitor performance remotely.
10 3.2.1.2.Post VRI: Measurement of response in dry matter and soil moisture and water use
The VRI controller has had some problems in that it would not upload commands/maps. A new unit has arrived and will be installed at Pat Daley‟s earliest convenience.
3.2.1.3.Model whole field response and develop strategies/scenarios to cope with variability and to increase pasture performance.
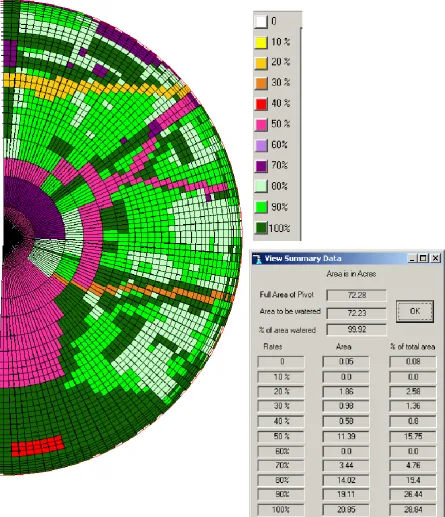
Some irrigation strategies have been developed; these include irrigation exclusion zones (Figure 11) and irrigations based on soil water holding capacity. When zones are excluded such as farm roads, lane ways, non productive zones etc, Water savings will be in the order of 20%, as well as reduced wheel rutting, increased field traffic-ability and improved weed control.
[image:14.595.80.530.85.416.2]Of particular interest are the changes required to the pumping system to cope with multiple sprinkler shutdown. Pat Daley is working on a solution that will include pressure cut-off switches. We have plans in place for a student to investigate an appropriate hydraulic solution for VRI systems.
11
3.3. Turf:
3.3.1. Demonstrate the linkages between on-farm management and turf production.
3.3.1.1.Utilising NutriCalc, field losses and proximal sensors to determine production responses to soil condition, fertiliser and irrigation application.
[image:15.595.82.528.54.572.2]Extensive discussion with the managers has revealed a number of issues around land management (soil surface level, traffic), harvesting sequence, irrigation practices, erosion, harvester performance which are all inextricably linked, some of which are outside the scope of RADS, but we have plans in place for a student to address some of these issues around the harvester.
12 Currently, losses from the harvester (Figure 12) range from 5-10% of total yield, which impacts heavily on WUE and production costs. Sensors have been acquired and preparations have been made to mount them on the harvester. Sensors include a beam breaker to monitor ejected turf and an RTK GPS, with 2cm accuracy, to locate where the particular piece of turf grew in the field.
Fertilisers, irrigations and basic farm information have been entered into NutriCalc, thus once the turf is harvested, the amount and type of inputs, including irrigation, will be recorded against yield and the nutrients that were exported offsite.
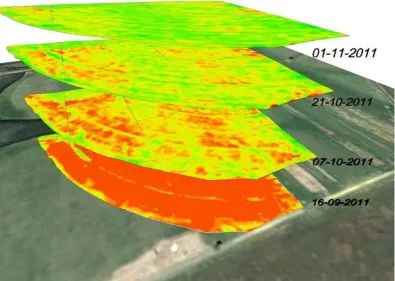
[image:16.595.64.526.136.470.2]Weekly NDVI surveys (Figure 13 & 14) are providing crop growth responses to irrigation and nutrient inputs and soil constraints. The time-series spatial layers have identified zones of poor growth which are linked to the irrigation and/or soil limitations. Initial EM38 survey is complete and identified considerable difference in soil condition from the top of the field to the gully and waterway (Figure 12). Irrigation performance will be tracked during irrigation with a sensor array mounted on the machine. As with Dairy and Horticulture it will allow the various managers to monitor performance, assess crop responses and identify constraints, and other erosion/runoff conditions (Figure 13).
13
Figure 13. Examples of soil and turf cutting conditions (left) and wheel rutting from pivot (right) creating erosion and traffic-ability issues
[image:17.595.82.478.400.681.2]14
3.4. Nursery
3.4.1. Application of precision irrigation technology to designated Nursery sites.
3.4.1.1.Deployment, evaluation and development of portable weight based sensing (PWBS) system. The Portable weight based sensor system has been previously deployed at 5 nurseries including a stint in regional Queensland. Data has not been perfect due to load cell overloading and moisture ingress. Consequently it has been refurbished with 15kg load cells, water proofed, new software and more user friendly graphic interface and analysis tool as requested by the client.
3.4.1.2.Motivation for additional PWBS systems (advanced, cheaper & with remote access).
Investigating the use of wafer thin flexi-force sensors, adaptors and data logging with 4G capability for around $1500 plus consumables and labour (Total ~$2000). This represents a >50% reduction in costs on the prototype and may facilitate broader adoption and use of the technology.
3.4.1.3.Analysis and interpretation of PWBS data.
[image:18.595.57.531.247.634.2]The system is providing unique data sets (Figure 15) on daily crop water use, peak demands, and the effect of irrigation on micro-climate temperature and onset of plant stress over a range of plant types in open air and protected environments. Drilling down into the data sets reveals the partitioning of irrigation water into drainage and crop water use allowing the irrigation manager to accurately assess the performance of the irrigation. In this instance the data (Figure 16) shows that 30% of the applied
15
Irrigation Drainage (300g)
Crop water use 700g
Crop water use 400g
water and entering the potted plant is drainage water. With the addition of the water that does not enter the pot, a significant amount of water will require recycling and re-pumping. Similar in-depth analysis of other sites have and will provide further linkages to pumping requirements, energy consumption, water losses and productivity.
3.4.2. Provide information on managing in-field variability, resource management and climate change mitigation.
3.4.2.1.Resource management
Dam Evaporation and seepage presentation was conducted at a recent NGIQ workshop. This has led to the installation of evaporation and seepage monitoring equipment to identify significant water losses in a buffering dam.
3.4.2.2.Conduct level 2 Energy audits of Five NGIQ identified production nurseries.
[image:19.595.85.515.144.456.2]Nurseries have been identified and we are waiting for their agreement to conduct the audits and in some cases review changes, if any, arising from previous audits.