2
About the authors
Whitney Crenna-Jennings is a Senior Researcher for Mental health, Wellbeing and Inclusion at the Education Policy Institute. Whitney is the principle author of the publication, ‘Vulnerable children and social care in England: a review of the evidence’. Before joining EPI Whitney graduated with an MSc in Social Epidemiology from UCL in 2015.
Jo Hutchinson is Director for Social Mobility and Vulnerable Learners at the Education Policy
Institute. Jo’s previous publications include ‘School inspection in England: Is there room to improve?’ and ‘Divergent pathways: the disadvantage gap, accountability and the pupil premium’. Jo was a co-author of ‘Closing the gap? Trends in educational attainment and disadvantage’, ‘Grammar schools and social mobility’ and ‘Educational Outcomes of Children with English as an Additional Language’. Prior to joining EPI, Jo spent ten years as a statistician at the Department for Education.
Acknowledgements
Alex Howard was a 2018 summer research intern at the Education Policy Institute. Alex is completing his A-levels this year in London.
3
About the Education Policy Institute
The Education Policy Institute is an independent, impartial, and evidence-based research institute that promotes high quality education outcomes, regardless of social background. We achieve this through data-led analysis, innovative research and high-profile events.
Education can have a transformative effect on the life chances of young people, enabling them to fulfil their potential, have successful careers, and grasp opportunities. As well as having a positive impact on the individual, good quality education and child wellbeing also promotes economic productivity and a cohesive society.
Through our research, we provide insight, commentary, and a constructive critique of education policy in England – shedding light on what is working and where further progress needs to be made. Our research and analysis spans a young person's journey from the early years through to entry to the labour market.
Our core research areas include:
Benchmarking English Education
School Performance, Admissions, and Capacity
Early Years Development
Vulnerable Learners and Social Mobility
Accountability, Assessment, and Inspection
Curriculum and Qualifications
Teacher Supply and Quality
Education Funding
Higher Education, Further Education, and Skills
4 Published October 2018 Education Policy Institute.
5
Contents
Foreword ... 6
Executive summary ... 7
Introduction ... 10
Methodology ... 11
Part 1: Access to mental health services ... 13
Referrals to child and adolescent mental health services ... 13
Referrals rejected or deemed inappropriate ... 14
Reasons for rejected referrals... 17
Thresholds for access to treatment ... 18
Procedures for children and young people not accepted into specialist treatment ... 20
Early intervention and lower tier services ... 21
Part 2: Waiting times ... 24
Part 3: Data quality and transparency gaps ... 28
Conclusion ... 30
6
Foreword
The Education Policy Institute is an independent, impartial and evidence-based research institute which aims to promote high quality education outcomes for all, through analysis that both informs and influences the policy debate in England and internationally.
Over recent years there has been increasing understanding of the importance of young people's mental health, as well as rising concern about the apparently increasing demand for such services and difficulties for some young people in accessing support.
Unfortunately, in the past a proper understanding of the existing patterns of demand and service provision has not been possible due to the lack of regular, reliable, and consistent reporting of mental health demand and service access. Policy makers have pledged to improve the collection and publication of mental health data to inform debate and lead to more informed policy making. But promises about improved data and accountability have not, so far, been matched by the delivery of consistent and transparent data reporting. The Education Policy Institute has sought to improve the understanding of children's mental health prevalence and access issues by securing data from individual service providers and publishing this, as far as possible at a consolidated national level. This latest report looks at the increased demand for children's mental health services; what
proportion of those referred for support are not accepted and how they are then treated; and what changes to service availability are emerging.
It is a cause of great concern that a large proportion of providers continue not to be able to make available the basic information which we have requested, and in some cases the variation in reported data from year to year also raises questions about both reliability and possible changes in the basis of collecting and reporting data. This indicates to us that the government needs to do much more to ensure reliable and transparent reporting of mental health demand and access. Until we have this much improved data, we cannot be sure whether service standards are improving or deteriorating, and we cannot know whether vulnerable young people are getting the support they need.
As ever, we encourage comment and feedback on our report from all those interested in this important area of policy and delivery.
David Laws
7
Executive summary
Based on prevalence estimates from 2004, only a quarter of children with a diagnosable mental health condition are currently in contact with CAMHS.1 The government’s target of 70,000 additional children in treatment would increase this to a third. Meanwhile, evidence suggests the prevalence of mental health difficulties among children and young people has risen over the last 15 years.2-4 This report is the third in an annual series providing results from Freedom of Information (FOI) requests to providers of specialist child and adolescent mental health services (CAMHS) in England. We report on indicators of access to specialist services in the latest year, and, for the first time, on changes to support services provided by local authorities (LAs) for children with mental health difficulties who are not accessing specialist treatment.
Part 1: Access to child and adolescent mental health services
According to newly collected data, the number of referrals to specialist CAMHS has increased by 26 per cent over the last five years. By contrast, the population of young people aged 18 and under increased by 3 per cent over the same period – indicating that the rate of referrals has increased substantially. The government’s 2018 prevalence survey will provide the first detailed and robust national assessment of levels of mental health difficulty at clinical levels since 2004 and is due to be published this month. This will provide the best information on underlying need to add further context these referral numbers.
Our data shows that between one fifth and one quarter of children referred to specialist services are deemed inappropriate for specialist treatment. The proportion of rejected referrals was rising until 2015, and due to low response rates in areas with previously high rates of rejection we cannot be sure that there has been any real improvement in 2018. A conservative estimate of the number of rejected referrals in the latest year is 55,800, but the true number will be higher than this due to providers that did not respond. There is also wide variation between providers, with some rejecting approximately half of all referrals and some reporting that they rejected fewer than one per cent of young people referred this year. There is no consistent measure of how many young people are not accepted into treatment making it difficult to compare across providers. Some may only offer certain tiers of services, include a wider category of young people in their response or filter referrals to other services in ways that result in them not being recorded as ‘rejected.’
8 CAMHS on the assumption it must be dealt with by social care authorities, effectively excluding the most vulnerable children from specialist mental health treatment.
Overwhelmingly, providers reported no or limited follow-up after a referral was deemed inappropriate – only a minority contacted other services deemed more appropriate and a small minority checked whether the young person had accessed other support. These findings emphasise concerns about what happens to children referred to, but not accepted into, specialist treatment. There is no national data collected on these children and young people, and no consensus on who is responsible for supporting young people with mental health problems, but without access to specialist treatment. The fact that self-harm is not always sufficient to trigger access to specialist services clearly signals that wider preventive services are needed.
However, new data shows that there are not always good alternative services in place for young people not accepted into specialist treatment. A quarter of local authorities who responded to our FOI request (27 of 111) reported decommissioning or no longer providing services related to young people’s mental and emotional well-being: these included sixteen community-based universal or early intervention services, thirteen school-based
programmes to support children with mild to moderate mental health difficulties, and examples of family counselling and mental health support for looked-after children, those living with domestic abuse and other vulnerable or at-risk young people. Where good alternative services are in place, those referring young people, like teachers and GPs, may not be aware of them.
Part 2: Waiting times for treatment
The average median waiting time reported in 2017-18 was 34 days to assessment and 60 days to treatment. However, there is wide variation across providers; the longest median wait reported was 188 days and the shortest was 1 day. Waiting times across providers are not necessarily comparable, as some providers may only offer certain specialist services.
Maximum waiting times to assessment in 2017-18 averaged 267 days, and to treatment, 345 days. Some of the longest waits may be due to individual reasons like a young person not being able to attend appointments.
Previous EPI research has highlighted that these waiting times can also be due to a lack of capacity. Indeed, the average median waiting time to treatment remains over twice as long as the waiting time standard to be piloted in trailblazer areas following the government’s green paper on children and young people’s mental health.
While it is difficult to compare performance between years given data quality issues, there appears to have been progress since 2012 in reducing the longest waiting times. Nevertheless, there remains a significant postcode lottery in waiting times to treatment, and some unacceptably long delays for treatment.
9
The quality of the data provided to us make it very difficult to accurately assess service quality and whether provision is changing across the country. Provider data is too often incomplete or unreliable. Several providers which had previously sent us their data reported that they were unable to this year. In some cases, these were providers with very high referral rejections. Private providers are exempt from the Freedom of Information Act, meaning that we cannot obtain data from them in relation to public services they provide.
At the national level, the improvement indicators published quarterly by the NHS are not fit-for-purpose and do not accurately reflect what matters for service quality. They do not capture the level of need across the country and link this to outcomes for children, and do not provide any information on specialist staffing levels or training that are essential for meeting demand. The risk of weak data definitions, with no universal service eligibility criteria, leading to ‘gaming’ of waiting time standards may be beginning to materialise – with one example of increased thresholds for access to eating disorder treatment appearing in this year’s FOI responses.
Conclusion
Referrals to child and adolescent mental health services have risen significantly in recent years. In response, the government has chosen a reactive approach: to focus on improving specialist provision for the most acute cases. There are no credible signs that this strategy is meeting current levels of demand.
Meanwhile, some areas have lost early intervention services supporting children and young people’s emotional and mental health and wellbeing, including those for children that receive statutory support.
Timely and high-quality specialist care will always be necessary, and more needs to be done to ensure it is in place across the country. A successful approach must include:
1. A concerted strategy to build up the capacity of the CAMHS workforce. 2. Ensuring that funding is in line with current prevalence estimates and that all
committed funding is ring-fenced for CAMHS and reaches frontline providers. 3. The introduction of new national compulsory data reporting on key access and
outcome measures. Accountability measures must be accompanied by consistent and stable thresholds for access to treatment across all providers.
However, the wider focus must be on taking demand out of system. There is a strong link between disadvantage, adverse child experiences including maternal mental ill health and contact with social services, and mental health difficulties.5 As such, an effective wider strategy would include:
1. A concerted child poverty reduction strategy.
2. Ensuring access to high quality early intervention services in all areas.
10
Introduction
Since 2015, the Education Policy Institute has been investigating the state of child and adolescent mental health services (CAMHS) in England. This year, we report on service access indicators in 2018 and the ‘treatment gap’ – the high number of children referred to specialist services but deemed inappropriate for specialist intervention – identified by our previous research.
First, this section provides general information on CAMHS and the national ‘transformation’ of services that began in 2015.
The network of services known as CAMHS is generally organised into four tiers:i
Tier 1: universal services, including primary care, health visiting, early years services, and school nurses
Tier 2: targeted services, including youth offending teams, primary mental health workers, and school and youth counselling (including social care and education)
Tier 3: specialist outpatient treatment
Tier 4: highly specialised inpatient units and intensive community services
Children and young people experiencing mental or emotional health difficulties are generally identified by universal services, e.g. their GP or at school, or by a parent or carer, who consult Tier 1 agencies. The young person or family is then referred to specialist CAMHS if deemed necessary. Commissioning and provision of CAMHS involves multiple agencies. Specialist services (Tiers 3 and 4) are commissioned by NHS England and local Clinical Commissioning Groups (CCGs). Lower level services can be commissioned by a combination of CCGs, local authorities, schools and/or agencies responsible for other children’s health services. Providers of child and adolescent mental health services include NHS trusts and foundation trusts, voluntary and independent agencies, and LAs and schools for those with lower-level mental and emotional health needs.
In 2015, with the goal of achieving parity of esteem between physical and mental health, the government launched a strategy for ‘transforming’ CAMHS provision by 2020-21, including specific targets of:
treating at least 70,000 additional children and young people;
treating 95 per cent of children with eating disorders within one week for urgent cases and four weeks for routine cases;
eliminating inappropriate inpatient placements; and
adding 1,700 therapists and supervisors to the CAMHS workforce.
A total of £1.4 bn was committed over the five years. In order to receive funding, local areas published transformation plans, led by CCGs and involving commissioners and providers across relevant sectors, detailing their strategies to improve children and young people’s mental health in their area.
11 Since then, the government has announced additional plans focused on boosting mental health support in schools and improving referral pathways, including incentivising schools to identify a mental health lead, establishing mental health support teams for groups of schools and colleges, and introducing a four-week waiting time standard for any treatment. These are to be rolled out to at least a fifth to a quarter of the country by the end of 2022-23.
The evidence is clear that effectively addressing mental ill-health in children and young people would reduce the burden of mental health problems across society. According to one estimate, the cost of mental health problems to the UK economy is between £70 and £100 bn per year.6 Mental health problems are strongly associated with poor labour market outcomes and a reduced life expectancy of up to 20 years.7,8 Three quarters of lifelong mental health conditions are established by age 18.9
However, based on prevalence estimates from 2004, only a quarter of children with a diagnosable mental health condition are currently in contact with CAMHS.1 The government’s target of 70,000 additional children in treatment would increase this to a third. Meanwhile, existing evidence suggests the prevalence of mental health difficulties among children and young people has risen over the last 15 years.2-4 Findings from the latest prevalence survey for children and young people will be published later this year. There is no data collected nationally on the number of children and young people with difficulties that do not meet diagnostic thresholds.
Over the last three years, EPI research has identified important barriers to improving provision for children and young people, including wide variation in the quality of local transformation plans, funding not reaching frontline providers, a significant proportion of referrals to specialist treatment being deemed inappropriate and a postcode lottery in waiting times for treatment.
Methodology
This year, we sent a Freedom of Information request to 60 public child and adolescent mental health services providers (all those we identified) across England. We received 54 responses by August 31st, a response rate of 90.0 per cent. Of these, one cited an exemption due to the risk of prejudicing a procurement process.
We also sent an FOI request to all 152 local authorities and received 111 responses by August 31st, a response rate of 73.0 per cent.
We asked CAMHS providers for:
1. Their threshold criteria documents for acceptance into their services;
2. The number of referrals to their services over the last five financial years for which figures were available;
3. The proportion of referrals deemed inappropriate or rejected in the last financial year;
4. The median and maximum waiting times to assessment and treatment in the last financial year;
5. Reasons for referrals to their services being rejected. Response options included:
12
duration of condition not long enough (please state if you have a specific time limit)
condition or situation not suitable for CAMHS service intervention (e.g. child does not have a diagnosable mental health condition)
service lacks capacity to support the patient at this time
existence of co-morbidity which excludes support from your service (e.g. substance misuse)
young person over the age of 18
other (please state).
6. Their procedure for referrals not accepted into specialist treatment. Response options included:
No action taken once referral is rejected or deemed inappropriate;
Inform referrer that young person was not accepted into treatment;
Signpost young person/parent/carer/young person’s school/young person’s GP to another service that is more appropriate;
Contact signposted agency on behalf of the young person/parent/carer;
Follow-up with young person/parent/carer/school/GP about whether the young person is accessing the signposted service or another service; and
Other (please state).
We asked local authorities to list the services they had stopped commissioning or providing over the last eight years, in the areas of:
promoting children and young people’s mental wellbeing;
preventing CYP mental health difficulties; and
interventions for CYP mental and emotional health.
We also analysed the ‘Mental Health Forward View ‘Dashboard,’ an NHS dataset with indicators along which the performance of Clinical Commissioning Groups (CCGs) against improvement targets is measured.
13
Part 1: Access to mental health services
Referrals to child and adolescent mental health services
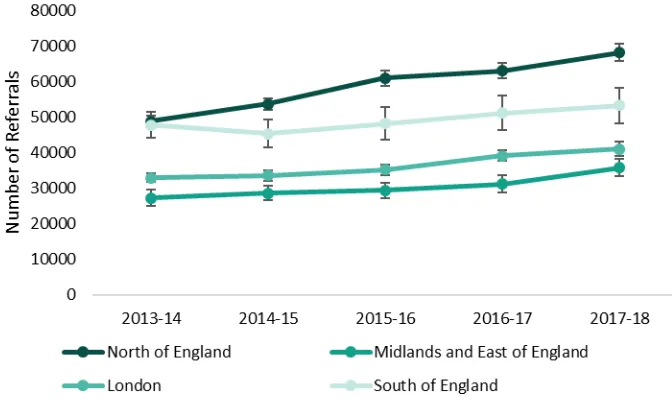
[image:13.595.93.429.266.470.2]Providers were asked to report the number of referrals to all services for each of the last five financial years for which figures were available. Thirty-three provided comparable data for the last five years (a response rate of 55.0 per cent), providing data across four regions. As seen in Figure 1, there has been a substantial increase in number of referrals to CAMHS among these providers. Nine providers reported comparable referral numbers for a subset of these years; among these, five reported an increase over time.
Figure 1. Number of CAMHS referrals by region
Note: Error bars indicate 95 per cent confidence intervals.
Based on our data, the number of referrals to specialist CAMHS has increased by 26.3 per cent over the last five years: 39.4 per cent among providers in the North of England, 31.0 per cent in the Midlands and East of England, 24.6 per cent in London, and 11.4 per cent in the South. By contrast, the proportion of children and young people aged 0 - 18 has increased by 3 per cent over that period, meaning the rate of referrals has increased significantly.10
This increase may be due, in part, to a rise in the number of individuals seeking treatment for mental health difficulties related to a reduction in stigma and better screening and identification of mental health problems. However, evidence points to a rise over time in the prevalence of mental health difficulties, specifically common mental health disorders, among children and young people, particularly among girls. One provider in the Midlands noted a ‘considerable rise in the number of
14
Referrals rejected or deemed inappropriate
Providers were asked what percentage of referrals to CAMHS had been rejected or deemed inappropriate in the last financial year. Forty-five providers responded to this question (a response rate of 75.0 per cent).
On average, 21.1 per cent of referrals to specialist CAMHS were rejected or deemed inappropriate. Applying this rejection rate to the numbers of referrals reported to us this year by 50 providers that responded to this question (264,733), we estimate that at least 55,800 children were referred to but not accepted into specialist services. This is a significant under-estimate of the real number as we did not receive referral data for all providers.
This represents a drop of five percentage points from last year.11 There are several possible reasons for this decrease. First, the same providers did not reply each year. As seen in Figure 2, two that did not respond this year, despite successive follow-ups, had among the highest proportion of rejected referrals in 2017. In addition, a number of providers with high rejection rates last year reported a large decrease in the proportion of referrals rejected or deemed inappropriate this year. We asked these providers what they thought might be the reason for the decrease; one replied that the drop was due to a review of their CAMHS referral criteria, and another that referrals are ‘no longer rejected’ and instead filtered through a paediatric panel into another service. Some other possible reasons include:
Inconsistent data collection and reporting, linked to the lack of strong national mandated data reporting requirements or data validation processes.
15 Figure 2: Comparing responses for ten providers with the highest rejection rates in 2016-17
Provider Proportion of referrals
rejected from CAMHS (2016-17)
Proportion of referrals rejected from CAMHS (2017-18)
Norfolk and Suffolk NHS Foundation Trust
64.1% 0.0%
Hertfordshire Partnership 63.5% No response
Nottinghamshire Partnershipii 61.0% 20.2%
South Staffordshire and Shropshire 58.7% Now part of Midlands Partnership, which reported 13.5% of referrals rejected
Cambridgeshire and Peterborough 58.3% No response
Cornwall Partnership 54.9% 51.7%
Berkshire Healthcare 53.4% 44.9%
Rotherham, Doncaster and South Humber
40.2% 21.0%
Dorset Healthcare 40.0% 33.0%
Sussex Partnership Sussex CAMHS 40.0% 40.7%
We are reporting a rejection rate of between one fifth and one quarter this year due to the uncertainty resulting from these data completeness and accuracy issues.
The raw data submitted indicated a 21.1 per cent rejection rate in 2017-18, but if we impute last year’s data to eight providers that did not respond this year, and to one provider that reported an implausible drop (from 64.1 to 0 per cent), this results in a rate of 24.2 per cent, which is well within the 95 per cent confidence interval for last year’s responses. Many providers reported relatively consistent figures from 2012-13 to 2016-17 so it is plausible that these would not have changed drastically in the latest year.
Given the potentially biased response within the raw data, we believe the adjusted 2017-18 figure with imputed figures for missing or suspect responses is the better estimate, meaning it is uncertain whether there has been any real reduction in rejection rates, although the central estimate
represents a small reduction.
16 Figure 3: Mean percentage of referrals rejected or deemed inappropriate
[image:16.595.74.442.396.620.2]Figure 4 shows the smaller spread of data this year compared to previous years, due to the high level of non-response from providers with the highest rejection rates in 2016-17. The percentage of rejected referrals this year ranged from 51 per cent to negligible.
Figure 4. Distribution of referrals rejected or deemed inappropriate since 2012-13
Note: Chart shows distribution of responses from providers. Dots indicate outliers, tails indicate the 5th and 95th percentile and box edges indicate the 25th and 75th percentile.
As seen in Figure 5, there is some regional variation between providers. It is clear from the data that the proportion of rejected CAMHS referrals are consistently higher in the South of England and relatively low in London. However, the drop between this and last year in the North and the
Midlands and East is mainly due to non-response being more concentrated among providers in these regions, as well as several providers reporting a large decrease between years. There is no consistent
17 measure of how many young people are not accepted into treatment making it difficult to compare performance across providers.
Figure 5. Regional variation in referrals rejected in 2016-17 and 2017-18
Reasons for rejected referrals
Twenty-four providers reported their reasons for rejected referrals in 2017-18; fourteen reported they did not hold or record this information. As seen in Figure 6, the most common reasons selected were:
Condition not serious enough to meet threshold for access to service;
Condition or situation not suitable for CAMHS intervention (e.g. child does not have diagnosable MH condition); and/or
18 Figure 6. Reasons for referrals being rejected or deemed inappropriate in 2017-18
This mirrors EPI research from previous years which found that the most common reason providers did not accept referrals was that they did not meet thresholds for specialist treatment. According to one provider this year:
‘There are constraints on many of the wider services which can mean that cases not meeting CAMHS criteria are referred to CAMHS due to lack of alternatives. This can lead to frustration for families who feel that there is nowhere to turn for support and intervention.’
One provider stated that they offer services for children and young people aged up to 16 years. It was not clear from their response what provision is in place for 16- to 18-year olds in this area. One provider, of Tier 4 (inpatient) services, cited lacking capacity as a reason for not accepting referrals – which could result in inappropriate placements of young people including into adult wards or into out-of-area units.
Thresholds for access to treatment
Providers were asked to provide their threshold and referral criteria documents used to filter referrals to their services. We analysed the documents from 41 providers and found examples of strong exclusion criteria for treatment, including:
Services that only accept self-harm referrals if accompanied by another mental health condition, like anxiety, depression or suicidal ideation.
Weight thresholds for community specialist treatment for eating disorders, commonly between 10 and 15 per cent deficit from an ‘ideal weight.’ This contravenes NICE guidelines, which state that single measures like BMI should not be used to determine whether to offer treatment for an eating disorder.
Services requiring that the young person engage with early intervention services through schools, GPs or the voluntary sector, and in some cases provide evidence of doing so, along with waiting a certain length of time, before they would be accepted into specialist
19
Services that did not provide support for children with family issues, and that instructed the referring party to encourage parents to resolve problems before referring the child to specialist treatment.
Referrals for mental health difficulties that are associated with a normal reaction to recent life events e.g. parental separation or divorce, bereavement or abuse. Previous EPI research has highlighted that children coping with loss and attachment issues often would benefit from therapeutic interventions, however may not meet thresholds based exclusively on mental health diagnosis.12 As there is no agreed definition for a ‘normal’ reaction to experiences like these, it is likely that many children miss out on the support they require.
Mental health difficulties like anxiety, or challenging behaviour, that are only present in one area of life, e.g. at school or at home. Only if the difficulties are present in multiple domains in a significant way would a child be accepted. As noted in our previous report, given that children with school-related issues would be referred by their school, this suggests a lack of suitable support for these children.
Comparing threshold criteria obtained this year with documents obtained in 2016, we found that one provider had significantly increased their threshold for treatment for anorexia, from
approximately the fifth percentile, meaning that the service would accept a young person in the lowest five per cent of the weight distribution for their age group, to the second, meaning that the young person would have to be in the bottom two per cent to be treated. This may be related to the introduction of the national waiting time standard for eating disorder treatment in 2016, and underscores the concern that services lacking capacity may raise thresholds to comply with national standards. Waiting time standards are only meaningful if there is a consistent and stable threshold for treatment across providers, otherwise figures may be easily manipulated in order to comply with standards.
Many providers specified that certain young people’s mental or emotional health needs should be met by other services, for example:
Young people engaging in mild to moderate self-harm as a coping strategy for strong emotions and difficult experiences and not associated with an underlying mental health condition. School nurses, counsellors or other school staff were deemed to be responsible for responding to these children.
Young people who are homeless, or those who have parents with problems including domestic violence, illness, dependency or addiction, as their needs will be met by children and young people’s services.
As highlighted in previous EPI research, difficulties faced by children and young people often do not fit into clear diagnostic boxes and therefore do not meet service criteria.12 These exclusion criteria highlight that, in many areas, children that do not neatly match a diagnosis or fit into an available service may not receive the help they require.
These criteria also raise concerns about effective support for children with multiple interlinked vulnerabilities, whose needs fall under the remit of different services. Experiences like
20 In addition to providing their referral criteria, one provider of inpatient services noted serious infrastructure issues, including:
Isolation, i.e. not being located with any other inpatient mental health facilities, meaning that support in the event of an incident would be limited;
Absconding risk and being situated next to a train station with high speed trains running through it; and
Static ligature risks that cannot be removed and must be monitored daily.
This raises questions about quality of inpatient care across the country; previous EPI research has highlighted that, on average, inpatient units fail to meet seven per cent of the minimum standard for quality of care.14
There were also many examples of services that had adopted or were in the process of adopting a tier-free model of care under a single point of access, meant to improve access to care and reduce waiting times. Thirteen providers reported they had a single point of access, meaning that young people could come to one place to get access to support or treatment; research has shown that well-designed and managed single points of access result in more timely referrals.15 Several more providers stated they had or were in the process of implementing a tier-free model focused on the needs and preferences of young people and their families. These models may be more inclusive, but we are not able to effectively assess their impact on outcomes without further research.
Procedures for children and young people not accepted into specialist treatment
Child and adolescent mental health services continue to be characterised by a significant ‘treatment gap’ – the large proportion of children referred to specialist treatment but then deemed not to meet thresholds. Some of these children may have difficulty accessing support due to a lack of information about alternative services in their area, or a shortage of early intervention provision.
CAMHS providers were asked about their procedure for referrals deemed inappropriate for specialist treatment. Forty-four providers answered the question. Figure 7 presents the breakdown of actions taken. The most common response was to inform the referring party and signpost the young person, their family or the referrer to a service deemed more appropriate (thirty-one providers did both). Twenty-three reported contacting the signposted agency on behalf of the young person, and eight reported following up with the young person or their carer/school or GP about whether they were accessing the signposted service. Four providers reported in some cases taking no action following a referred young person not being accepted into treatment.
21 Figure 7: Action taken in response to rejected referrals in 2017-18
One provider highlighted:
‘No one in CAMHS is denied treatment. Clients are signposted to other services
(voluntary/external) if the clinician feels they would benefit from those services more than going through CAMHS and are always encouraged to come back if they still feel that they want more help.’
In order for this to be effective, high quality inter-agency working and effective lower-tier or early intervention services must be in place. One provider highlighted that their response to inappropriate referrals depended on local arrangements, while another noted:
‘Since school systems have become more independent via academies, etc. […] the referrals process and engagement with school environments has become more challenging.’
The lack of clarity of referral pathways in some areas means that it can be difficult for young people and their families to access the right support. Recognising this, some providers had modified their approach. One stated that:
‘All referrals that do not meet CAMHS criteria are no longer rejected, instead they are taken to a multi-disciplinary paediatric panel and assessed into the most appropriate service.’
Another reported that signposting referrals had historically created ‘disjointed approaches to care’ and in response was introducing a single point of access working with Tier 2 providers and local authorities.
Early intervention and lower tier services
22 Of the 111 local authorities (LAs) who responded to our FOI request (a response rate of 73.0 per cent), 27 reported de-commissioning services they deemed to be related to the mental health and wellbeing of children and young people over the last eight years (Figure 8).iii
Figure 8. LA services related to children and young people’s mental health and wellbeing
Response category Number of LAs
Have not decommissioned or stopped providing 39
Have decommissioned or stopped providing 27
Don't hold information, not applicable or referred to CCG or NHS trust 15
Poor quality response or unclear 11
Have increased investment 9
CCG or other agency now provides the service(s) 6
Replaced by different service offer 3
FOI exemption cited 1
Of those services no longer available, those in the category of early help (including support for young people with mild to moderate mental health problems, and behavioural and emotional issues, activities for children and young people supporting the early identification and prevention of mental health issues, and early years therapeutic support) were most reported, followed by programmes focused on children in school, including those displaying emotional or behavioural difficulties and mental health issues including anxiety. Several LAs also reported no longer providing services such as counselling for vulnerable children, including those in care, care leavers and those who had
experienced trauma, including domestic violence (Figure 9).
Figure 9. Types and number of services no longer offered by number of LAs
In most cases, LAs did not specify why these services were no longer offered; one explained that two school-based programmes had previously been funded by ‘external grants that have been since been
cut as part of central government cuts for local government.’ In other cases, they may have been
deemed ineffective, or other services may have taken their place; many LAs, however, specified in their responses if services they no longer provided or commissioned had been taken over by another agency. Nine authorities reported increasing investment in specific services addressing young people’s mental and emotional wellbeing, while others mentioned the general increase in CAMHS investment via Clinical Commissioning Groups and transformation plans.
iii This does not include LAs that listed services they no longer commissioned or provided that had been re-commissioned by another agency.
Type of service
Number of services no longer available
Number of LAs that no longer commission or provide service
Community-based universal and early intervention 16 10
School-based early intervention 13 9
Support for vulnerable young people 6 5
Support for looked after children 5 4
Family support services 6 4
Advocacy 1 1
[image:22.595.73.544.433.577.2]23 There have been considerable changes to the system over this period, including the creation of CCGs and the transfer of public health responsibilities to LAs in 2013. Many LAs reported that CCGs were responsible for commissioning services related to children and young people’s mental health and wellbeing, belying the role that other local services - related to families, vulnerable young people and those with moderate emotional health difficulties, for example - play in supporting mental and emotional health. It is concerning that some LAs do not see their responsibility for public health as including responsibility for public mental health. The responses indicate wide variation between LAs in their understanding of mental and emotional health provision, and which agencies are responsible for the mental health and wellbeing of children at every degree of severity.
24
Part 2: Waiting times
Once children are deemed to meet the threshold for specialist treatment, it may be a long time before treatment starts. Last year, our analysis found very wide variation in length of time to treatment between providers across the country.
This year, we again asked providers to report their maximum and median waiting times to first appointment and to start of treatment in the last financial year. First appointment is often an assessment appointment, and research has shown there can often be a significant wait from
assessment to start of treatment.20 However, some providers specified that they considered the first appointment to be the start of treatment.
Forty-seven providers responded to the question about median waiting times to first appointment or assessment and forty-six to the question about waiting times to treatment (response rates of 78.3 and 76.7 per cent respectively). Four providers that reported their median waiting times last year did not answer the question this year – reasons included that they record the information, but not in an
easily reportable format, or that compiling it would exceed the FOI time exemption. Figure 10 presents the average median waiting times for the last six years. The average median
[image:24.595.87.471.424.629.2]waiting time to treatment in 2017-18 was 60 days. While there is substantial variation from year to year, and performance worsened over the last financial year, there appears to be a general slight downward trend in median waiting time to treatment over time.
Figure 10. Average median waiting times for CAMHS (days)iv
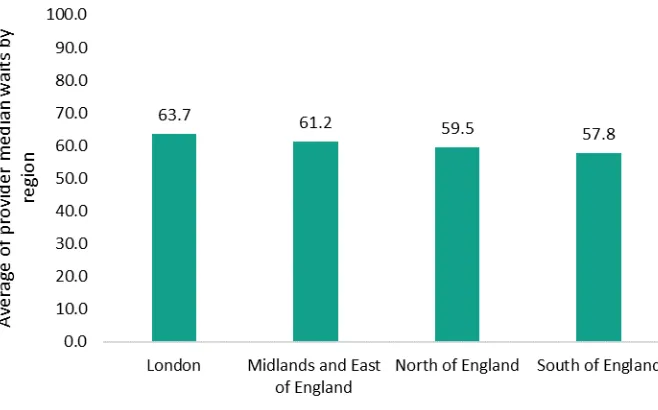
As seen in Figure 11, there is some variation between regions in average median waiting times for treatment, with young people in London waiting the longest for treatment. Regional averages mask wide variation within regions, which was also the case in 2016-17. Between providers, median
25 waiting time for treatment varied from 1 to 188 days. It is unclear whether waiting times are
[image:25.595.89.418.127.332.2]measured differently across providers, making it difficult to compare performance. Figure 11. Regional averages for median waiting times for treatment
[image:25.595.64.525.394.573.2]Figures 12 and 13 show the ten providers with the shortest and longest median waiting times for treatment this year, with last year’s figures for comparison.
Figure 12. Ten providers with the shortest median waiting times to treatment in 2017-18
Provider Median wait to treatment (days)
For comparison: 2016-17 figures
Sussex Partnership Sussex CAMHS 29 37
Isle of Wight 28 14
Lincolnshire Partnership 28 58
Somerset Partnership 26 25
Rotherham, Doncaster and South
Humber 23
75
Southern (eating disorder service) 20 -
Midlands 15 -
Norfolk and Suffolk 6 14
South Tyneside* 6 85
Greater Manchester (Tier 4 inpatient) 1 -
26 Figure 13. Ten providers with the longest median waiting times to treatment in 2017-18
Provider Median wait to treatment (days)
For comparison: 2016-17 figures
Alder Hey 188 -
Northumberland, Tyne and Wear 145 21
Worcestershire 127 14
Birmingham and Solihull 126 -
Sussex Partnership Hampshire* 124 120
Leeds Community Healthcare 111 49
South West London and St. George's 92 28
Dudley 90 -
Leicestershire Partnership 86 21
Barnet, Enfield and Haringey 82 -
*This provider was only able to report the mean and not the median waiting time.
Thirty-nine providers responded with their maximum waiting times until assessment and thirty-eight responded with their maximum wait to treatment (response rates of 65.0 and 63.3 per cent
respectively).
We calculated the mean of maximum waiting times across all providers. It is important to note that the figures provided may include some outliers or represent one person – some maximum waits are due to patients not being available for appointments, or the provider not receiving enough
information from the referring party.
Six providers who responded to this question on last year’s FOI request did not provide data this year. Reasons for this, where they were provided, included ‘that the data quality is poor and
therefore misleading,’ that it would require extensive service validation which would entail work
exceeding the appropriate limit specified for FOI requests, and the information was recorded but not in an easily reportable format.
Figure 14 shows that average maximum waiting times both to assessment and treatment have fallen significantly over time.v
v For providers missing data this year, we assigned data provided to us in 2016-17. This resulted in 10 ‘imputed’ cases for average maximum waiting time to assessment and 9 for average maximum waiting time to
27 Figure 14. Average maximum waiting times for CAMHS (days)
508
419 368 359
266 267
761
682
539
608
489
345
0 200 400 600 800 1000 1200
2012-13 2013-14 2014-15 2015-16 2016-17 2017-18
N
u
m
b
er
o
f d
ay
s
28
Part 3: Data quality and transparency gaps
As research has consistently highlighted, gaps in data availability and a lack of transparency are key barriers to high quality mental health care for children and young people.21
In order to improve these areas, NHS Digital began publishing national and local level information on children and young people’s mental health services in January 2016.22 NHS England has established a quarterly data release called the ‘Mental Health Forward View Dashboard’ to chart progress against national targets.23 The 11 dashboard indicators are:
A CCG improvement score based on: whether CCGs have updated and republished their Local Transformation Plans, access and waiting times for eating disorder services, quality assessment network membership, the development of collaborative commissioning plans for specialist CAMHS, the publication of joint agency workforce plans, and CAMHS spending increase.
The number of children and young people (CYP) receiving at least two contacts in NHS-funded community services.
The number of new CYP under 18 receiving treatment in NHS-funded community services.
The proportion of CYP with eating disorders seen within one week (urgent).
The proportion of CYP with eating disorders seen within four weeks (routine).
The total number of bed days for CYP under 18 in CAMHS inpatient wards.
The total number of admissions of CYP under in 18 in CAMHS inpatient wards.
The total number of CYP bed days under 18 in adult inpatient wards.
The total number of CYP under 18 in adult inpatient wards.
The total planned spend on CYP mental health, excluding learning disabilities and eating disorders.
The planned spend on CYP eating disorder treatment.
Since NHS England has only been collating and publishing this data since 2016, and only for some indicators, it is not yet possible to accurately measure progress over time. The latest data release shows that in Quarter 4 of 2017-18, nationally:
78.9 per cent of CYP with eating disorders requiring urgent care were seen within one week.
79.9 per cent of those with eating disorders who require routine treatment were seen within four weeks.
53 young people aged 18 or younger were being treated in adult inpatient wards.
£640.5 million committed to CYP mental health, excluding learning disabilities and eating disorders.
The wide variation in other indicator data between releases suggests they are not reliable. Moreover, there are significant gaps in the list of chosen indicators, including no data on:
Outcomes against treatment: unlike the adult mental health ‘Dashboard’, the CYP indicators do not include recovery rates or information on types of treatment.
Waiting time standards for all mental health conditions: the inherent problem with
29 that resources may be diverted and young people requiring treatment for other conditions may receive poorer quality care as a result.
The CAMHS workforce: this makes it impossible to measure progress against the
government target of 1,700 additional therapists and supervisors by 2020-21. Previous EPI research has found recruitment difficulties in NHS mental health trusts as well as a
deterioration of workforce standards in inpatient care.14 This remains a crucial shortcoming of the national CAMHS ‘transformation’ so far.
Children and young people with a clinically significant mental health condition not accessing CAMHS and those with lower level needs.
Finally, poor data quality at this level is a barrier to transparency across the whole system, as independent providers are not obliged by law to response to FOI requests.
[image:29.595.73.528.318.441.2]While public CAMHS providers are obliged to respond to these requests, this report highlights clear issues with the data collected and reported by providers. Many could not provide data in response to our questions about basic access indicators (Figure 15).
Figure 15. Levels of non-response by CAMHS providers for each FOI request question
FOI question Proportion of non-responders
Number of referrals 2012-13 to 2017-18 45.0% Percentage of referrals rejected 2017-18 25.0% Reasons for not accepting referrals 2017-18 60.0% Threshold and referral criteria 2017-18 31.7% Protocol for rejected referrals 2017-18 26.7% Median waiting times to treatment 2017-18 23.3% Maximum waiting times to treatment 2017-18 36.7%
30
Conclusion
The demand for child and adolescent mental health services has risen significantly in recent years. Despite substantial investment, the development of improvement strategies at the national and local level, and evidence of good practice in some areas, the same problems that characterised CAMHS when the national ‘transformation’ was launched still exist three years on.
The data shows that many children and young people continue to have difficulty accessing treatment; there continues to be a significant postcode lottery in the proportion of referrals accepted into specialist care and waiting times to treatment, with long waits in some areas. It also emphasises the concern that children with moderate difficulties or those who are not accessing specialist CAMHS may have difficulty accessing alternative support.
Our findings also clearly highlight that CAMHS data is not fit-for-purpose. This is the most
transparent the system has ever been – yet the data system fails to provide a clear picture of service quality and how it may or may not be changing.
Not covered by this report, but fundamental to performance on the access measures we investigate, is the state of the CAMHS workforce. We have seen no evidence that the government’s commitment of recruiting additional therapists and supervisors has been translated into action. It is not clear how this, along with introducing local mental health support teams working with schools and colleges, will be achieved in practice given existing recruitment difficulties.12
Timely and high-quality specialist care will always be necessary and more needs to be done in order to ensure it is in place across the country. This must include a concerted strategy to build up the workforce to meet current demand, high-quality joined-up working in all areas, ensuring that committed funding reaches frontline providers, and the introduction of national compulsory data reporting on key access and outcome measures. The government should look again at the FOI exemption applied to private providers when they are providing a publicly funded service. Stable and consistent definitions of who is eligible for treatment and time to both assessment and treatment must accompany the introduction of accountability measures to avoid ‘gaming.’
However, the prioritisation of specialist services above early intervention and prevention will not improve the mental health of children and young people. Wider focus must be on taking demand out of the system. Contextual factors are hugely important for children and young people’s mental health: the well-being of their families, the communities in which they grow up, the schools they attend, and their social networks. Adverse childhood experiences, including maltreatment and neglect, but also more widespread experiences like parental ill-health or separation, are prevalent in the population of children and young people and strongly associated with poor lifelong mental health.
These experiences are more common and more likely to be cumulative in families living in
32
References
1 NHS Digital. Mental health of children and young people in Great Britain, 2004. NHS, 2005. https://digital.nhs.uk/data-and-information/publications/statistical/mental-health-of-children-and-young-people-in-great-britain/mental-health-of-children-and-young-people-in-great-britain-2004 2 McManus, Sally, Paul Bebbington, Rachel Jenkins, and Traolach Brugha, eds. “Mental health and wellbeing in England: Adult Psychiatric Morbidity Survey 2014.” NHS Digital, 2016.
https://assets.publishing.service.gov.uk/government/uploads/system/uploads/attachment_data/file /556596/apms-2014-full-rpt.pdf
3 Patalay, Praveetha and Emla Fitzsimons. “Mental ill-health among children of the new century.” London: Centre for Longitudinal Studies, 2017.
http://www.cls.ioe.ac.uk/shared/get-file.ashx?itemtype=document&id=3338
4 Pitchforth, Jacqueline, Katie Fahy, Tamsin Ford, Miranda Wolpert, Russell M. Viner, and Dougal S. Hargreaves. “Mental health and wellbeing trends among children and young people in the UK, 1995– 2014: Analysis of repeated cross-sectional national health surveys.” Psychological Medicine 2018: 1– 11.
5 Crenna-Jennings, Whitney. “Key drivers of the disadvantage gap, Education in England: Annual Report 2018.” London: Education Policy Institute, 2018.
https://epi.org.uk/wp-content/uploads/2018/07/EPI-Annual-Report-2018-Lit-review.pdf
6Mehta, Nisha, and Orla Murphy. “Annual report of the Chief Medical Officer, Public mental health priorities: Investing in the evidence." London: Department of Health and Social Care, 2013.
https://assets.publishing.service.gov.uk/government/uploads/system/uploads/attachment_data/file /413196/CMO_web_doc.pdf
7 Cribb, Jonathan, Agnes Norris Keiller, and Tom Waters. “Living standards, poverty and inequality in the UK: 2018. London: Institute for Fiscal Studies, 2018. https://www.ifs.org.uk/publications/13075 8 Chesney, Edward, Guy M. Goodwin, and Seena Fazel. “Risks of all‐cause and suicide mortality in mental disorders: a meta‐review.” World Psychiatry 13 (2014): 153-160.
9 Murphy, Margaret and Peter Fonagy. “Mental health problems in children and young people” in
Annual report of the Chief Medical Officer 2012, Our children deserve better: Prevention pays, ed.
Claire Lemer. London: Department of Health and Social Care, 2012.
https://www.gov.uk/government/uploads/system/uploads/attachment_data/file/252660/33571_29 01304_CMO_Chapter_10.pdf
10Office for National Statistics. Estimates of the population for the UK, England and Wales, Scotland and Northern Ireland. ONS, 2018.
https://www.ons.gov.uk/peoplepopulationandcommunity/populationandmigration/populationesti mates/datasets/populationestimatesforukenglandandwalesscotlandandnorthernireland
11 Frith, Emily. “Access and waiting times in children and young people’s mental health services.” London: Education Policy Institute, 2017.
https://epi.org.uk/wp-content/uploads/2018/01/EPI_Access-and-waiting-times_.pdf
12 Frith, Emily. “Progress and challenges in the transformation of children and young people's mental health care.” London: Education Policy Institute, 2016.
https://epi.org.uk/wp-content/uploads/2018/01/progress-and-challenges.pdf
13 Hughes, Karen, Mark A. Bellis, Katherine A. Hardcastle, Dinesh Sethi, Alexander Butchart, Christopher Mikton, Lisa Jones, and Michael P. Dunne. "The effect of multiple adverse childhood experiences on health: a systematic review and meta-analysis." Lancet Public Health 2, no. 8 (2017): 356-366.
14 Frith, Emily. “Inpatient provision for children and young people with mental health problems.” London: Education Policy Institute, 2017.
33 15 Care Quality Commission. “Are we listening? Review of children and young people’s mental health services 2018.” London: CQC, 2018.
https://www.cqc.org.uk/sites/default/files/20180308b_arewelistening_report.pdf
16 National Audit Office, “Financial Sustainability of Local Authorities 2018.” London: NAO, 2018. https://www.nao.org.uk/wpcontent/uploads/2018/03/Financial-sustainabilty-of-local-authorites-2018.pdf
17 Webb, Calum J., and Paul Bywaters, “Austerity, rationing and inequity: Trends in children’s and young peoples’ services expenditure in England between 2010 and 2015.” Local Government Studies 44, no.3 (2018).
18 Korkodilos, Marilena. “The mental health of children and young people in England.” London: Public Health England, 2016.
https://assets.publishing.service.gov.uk/government/uploads/system/uploads/attachment_data/file /575632/Mental_health_of_children_in_England.pdf
19 Ford, Tamsin, Panos Vostanis, Howard Meltzer, and Robert Goodman. “Psychiatric disorder among British children looked after by local authorities: Comparison with children living in private
households.” The British Journal of Psychiatry 190 (2007): 319-325.
20 Care Quality Commission brief guide on waiting times, p2. December 2016:
https://www.cqc.org.uk/sites/default/files/20170121_briefguide-camhs-waitingtimes.pdf 21 Care Quality Commission. “Review of children and young people’s mental health services.”
London: CQC, 2017. https://www.cqc.org.uk/sites/default/files/20171103_cypmhphase1_report.pdf 22 NHS Digital. Mental Health Services Dataset. https://digital.nhs.uk/data-and-information/data-collections-and-data-sets/data-sets/mental-health-services-data-set
23 NHS England. Mental Health Five Year Forward View Dashboard.