
Inspiratory Loading Intensity Does Not
Influence Lactate Clearance during Recovery
MICHAEL A. JOHNSON1, DEAN E. MILLS1, DAVID M. BROWN2, KATIE J. BAYFIELD3, JAVIER T. GONZALEZ4, and GRAHAM R. SHARPE1
1
Sport, Health and Performance Enhancement Research Group, School of Science and Technology, Nottingham Trent University, Clifton, Nottingham, UNITED KINGDOM;2Division of Nutritional Sciences, School of Biosciences, Sutton Bonington Campus, The University of Nottingham, Leicestershire, UNITED KINGDOM;3Department of Gene Therapy, National Heart and Lung Institute, Imperial College London, London, UNITED KINGDOM; and4School of Life Sciences, Northumbria University, Newcastle upon Tyne, UNITED KINGDOM
ABSTRACT
JOHNSON, M. A., D. E. MILLS, D. BROWN, K. BAYFIELD, J. GONZALEZ, and G. R. SHARPE. Inspiratory Loading Intensity Does Not Influence Lactate Clearance during Recovery.Med. Sci. Sports Exerc., Vol. 44, No. 5, pp. 863–871, 2012.Purpose: This study examined the effects of different pressure threshold inspiratory loads on lactate clearance and plasma acid–base balance during recovery from maximal exercise.Methods: Eight moderately trained males (V˙ O2peak= 4.29T0.46 LImin
j1
) performed, on different days, four maximal incremental cycling tests (power started at 0 W and increased by 20 WIminj1) of identical duration (exercise time during the first trial was 16.32T1.12 min). During 20-min recovery, subjects either rested passively or breathed through a constant pressure threshold inspiratory load of 10 (ITL10), 15 (ITL15), or 20 (ITL20) cm H2O. Plasma lactate concentration ([La
j
]) was measured, and acid–base balance was quantified using the physicochemical approach, which describes the dependency of [H+] on the three independent variables: strong ion difference ([Na+] + [K+]j[Clj] + [Laj]), the total concentration of weak acids, and the partial pressure of carbon dioxide.Results: Peak exercise responses were not significantly different between trials. During recovery, the area under the plasma [Laj] curve was not different between trials (pooled mean = 261T60 mEq) and the [Laj] measured at the end of the 20-min recovery was also similar (passive recovery = 9.2T3.1 mEqILj1, ITL10 = 9.3T3.1 mEqILj1, ITL15 = 8.7T2.8 mEqILj1, ITL20 = 8.7T 3.2 mEqILj1). Similarly, changes in other strong ions contributing to strong ion difference and total concentration of weak acids, partial pressure of carbon dioxide, and, therefore, [H+] were not different between trials.Conclusions: These data suggest that, in individuals of moderate endurance training status, inspiratory loading at the intensities used in the present study does not accelerate lactate clearance or modify plasma acid–base balance during recovery from maximal exercise.Key Words:INSPIRATORY LOADING, RECOVERY, LACTATE CLEARANCE, ACID–BASE BALANCE, CYCLING
E
levated muscle and blood lactate concentrations ([Laj]) and the accompanying H+accumulation have long been associated with impaired muscle function and exercise tolerance (15). After high-intensity exercise, an active recovery using the previously exercised muscles quickens the decline in blood [Laj] (12,29,32,41) and, compared with passive recovery, may result in better main-tenance of performance in subsequent exercise bouts (3,31). Conversely, active recovery using the previously exercised muscles may impair subsequent performance because of slower rates of muscle reoxygenation and phosphocreatineresynthesis (6,39). Because the primary fate of lactate during exercise and recovery is oxidative metabolism by skeletal muscle (2,17,18), the high capillary density and oxidative capacity of the inspiratory muscles (33) make them ideally suited to lactate metabolism. The use of inspiratory loading during recovery may thus provide an alternative strategy by which lactate clearance may be enhanced without compro-mising the repletion of intramuscular energy stores within the previously exercised locomotor muscles.
Two recent issues ofMedicine & Science in Sports & Ex-erciseÒ(5,9) present conflicting evidence regarding whether
inspiratory muscle loading can quicken blood lactate clear-ance after high-intensity exercise. Chiappa et al. (9) showed that a pressure threshold inspiratory load (15 cm H2O) dur-ing recovery from high-intensity exercise greatly accelerated lactate clearance from the blood. Specifically, when com-pared with passive recovery, the absolute blood [Laj] and area under the curve (AUC) for blood [Laj] were lower with inspiratory loading by around 2.5 mEqILj1(j24%) and 21
mEq (j16%), respectively. Furthermore, a follow-up study
showed that peak cycling power in the second of two suc-cessive Wingate tests increased by 25% after this recovery Address for correspondence: Michael A. Johnson, Ph.D., Sport, Health and
Performance Enhancement Research Group, School of Science and Tech-nology, Nottingham Trent University, Clifton Lane, Clifton, Nottingham NG11 8NS, United Kingdom; E-mail: [email protected]. Submitted for publication July 2011.
Accepted for publication November 2011.
0195-9131/12/4405-0863/0
MEDICINE & SCIENCE IN SPORTS & EXERCISEÒ
CopyrightÓ2012 by the American College of Sports Medicine
DOI: 10.1249/MSS.0b013e31824079d0
BASIC
intervention (8). However, despite using a similar method-ology, Brown et al. (5) failed to reproduce the observations of Chiappa et al. (8,9). Specifically, lactate clearance during recovery from high-intensity exercise was accelerated by a 15 cm H2O pressure threshold inspiratory load only after in-spiratory muscle training and then only by a much smaller degree to that reported by Chiappa et al. (8,9).
Interestingly, Chiappa et al. (9) reported large reductions in blood [Laj] with inspiratory loading without the con-comitant changes in plasma [H+] and [HCOj3] that would be expected to occur. According to the physicochemical approach to acid–base balance (40), [H+] in intracellular and extracellular fluid is, together with HCOj3], a dependent variable whose value is dependent on the equilibrium state reached by the independent variables: strong ion difference ([SID], fully dissociated cations minus anions, which, in plasma, is equal to [Na+] + [K+]j[Clj] + [Laj]), the total concentration of weak acids ([Atot
j
]), and partial pressure of carbon dioxide (PCO2) (for reviews, see Johnson et al. [21], Kowalchuk and Scheuermann [23], and Lindinger et al. [25]). Therefore, for plasma [H+] to have remained unchanged with inspiratory loading, the large reduction in blood [Laj] ob-served by Chiappa et al. (9) must have been balanced by corresponding changes in the concentration of other strong ions and/or [Atot
j
] (40). This hypothesis was not supported by the work of Brown et al. (5), which showed that concen-trations of other strong ions and [Atot
j
] were unaffected by inspiratory loading both before and after inspiratory muscle training. Indeed, the lower blood [Laj] with inspiratory loading after inspiratory muscle training was exclusively responsible for an increase in [SID] and, subsequently, a lower [H+] (5).
One potential explanation for the disagreement between the findings of Chiappa et al. (8,9) and Brown et al. (5) may be that the magnitude of the pressure threshold load is an important determinant of whether inspiratory loading accel-erates lactate clearance during recovery. Specifically, after inspiratory muscle training, which increased participants’ maximum inspiratory mouth pressure (MIP) by 34%, lactate clearance was accelerated only when inspiratory loading was performed at the same absolute (15 cm H2O or 10% MIP) but not relative (20 cm H2O or 13% MIP) intensity (5).
Therefore, the aim of the present study was to resolve some of the controversies surrounding the effects of inspi-ratory loading during recovery from high-intensity exercise. Consequently, we investigated the effects of different pres-sure threshold inspiratory loads (10, 15, and 20 cm H2O), applied during recovery from high-intensity exercise, on lactate clearance and plasma acid–base balance quantified using the physicochemical approach.
METHODS
Participants.After approval from Nottingham Trent
University’s ethics committee, eight healthy nonsmoking males with normal lung function (Table 1) provided written
informed consent to participate in the study. Throughout the study, participants were instructed to adhere to their habitual training regimen and not to engage in any strenuous exercise the day preceding and the day of a trial. Participants arrived at the laboratory 2 h postprandially having abstained from alcohol and caffeine in the 24 h before testing.
Experimental design.Participants attended the labo-ratory on five separate occasions, at a similar time of day, separated by at least 48 h but no more than 1 wk. During the first laboratory visit, pulmonary function and MIP were measured. During subsequent visits, participants performed an incremental cycling exercise test (the first of which was continued to the limit of tolerance) followed by a 20-min recovery period comprising either passive recovery or breathing against a constant inspiratory pressure threshold load of 10 (ITL10), 15 (ITL15), or 20 cm H2O (ITL20). The order of the exercise trials was randomized. The exercise duration achieved during the incremental exercise test of the first trial was replicated in all subsequent trials.
Pulmonary function and MIP.Pulmonary function
was assessed according to published guidelines (30) using a pneumotachograph (Pneumotrac; Vitalograph, Buckingham, United Kingdom) calibrated using a 3-L syringe. A handheld mouth pressure meter (MicroRPM; CareFusion, Hampshire, United Kingdom) measured MIP as an index of global in-spiratory muscle strength. The mouthpiece assembly incor-porated a 1-mm orifice to prevent glottic closure during inspiratory efforts. Maneuvers were performed in an upright standing posture, initiated from residual volume, and sustained for at least 1 s. Repeat efforts separated by 30 s were performed until three serial measures differed by no more than 10% or 10 cm H2O, whichever was smallest (5). The highest value recorded was used for subsequent analy-sis. For each participant, MIP was compared with predicted values using the equation of Wilson et al. (45), where MIPpredicted= 142j(1.03age).
Maximal incremental cycling test.Exercise was
[image:2.651.338.578.82.166.2]performed on an electromagnetically braked cycle ergometer (Excalibur Sport; Lode, Groningen, The Netherlands). Dur-ing the first trial, a maximal incremental cyclDur-ing test was performed, whereby power started at 0 W and increased by 20 WIminj1until participants could not maintain a cadence greater than 60 rpm despite verbal encouragement. In an TABLE 1. Descriptive characteristics of the participants.
Variable
Age (yr) 26T6
Body mass (kg) 80T6
Height (cm) 184T4
FVC (L) 5.54T0.51 (101T9)
FEV1(L) 4.40T0.52 (96T10)
FEV1/FVC (%) 80T4 (96T5)
MVV10(LIminj1) 190T36 (112T22)
MIP (cm H2O) 145T39 (126T34)
Data are presented as meanTSD. Values in parentheses represent the percentage of predicted values (26,45).
FVC, forced vital capacity; FEV1, forced expiratory volume in 1 s; MVV10, maximal vol-untary ventilation in 10 s.
BASIC
attempt to standardize the magnitude of elevation of plasma [Laj], the exercise duration achieved during this first test was recorded for each participant, and during subsequent tests, each participant was required to exercise for an iden-tical duration, at which point the test was terminated by the investigators. Cycling cadence was self-selected during the first test and repeated during subsequent tests. Participants wore a face mask (model 7940; Hans Rudolph, Kansas City, MO) connected to a pneumotachograph and a two-way non-rebreathing valve (model 2730; Hans Rudolph). Respiratory variables were measured breath by breath (ZAN 600USB; nSpire Health, Oberthulba, Germany). The final power at-tained and the highest oxygen uptake (V˙ O2) recorded during any 30-s period defined maximal power (W˙max) and V˙ O2peak, respectively. The prescribed recovery intervention (see be-low) was imposed immediately upon cessation of exercise.
Passive recovery.At the cessation of the incremental exercise test, a 0.5-m length of wide-bore (35-mm internal diameter) corrugated tubing was attached to the inspiratory port of the two-way valve, and participants remained seated at rest on the cycle ergometer for 20 min. The tubing at-tached to the inspiratory port was used in the inspiratory loading trials to connect the participant to the inspiratory loading device (see below). Blood samples were taken at rest, upon the cessation of exercise, and every 4 min during recovery. Upon the cessation of exercise and every 2 min during recovery, HR was recorded using short-range telemetry (Polar S610; Polar Electro, Kempele, Finland), and arterial oxygen saturation (SpO2) was estimated us-ing a fus-inger pulse oximeter (model 8500; Nonin Medical, Plymouth, MN).
Inspiratory pressure threshold loading.Inspiratory
loading trials were identical with the passive recovery trial, except that immediately after exercise, the 0.5-m length of the wide-bore tube connected to the inspiratory port of the two-way valve was connected distally to a custom-built weighted plunger pressure threshold inspiratory loading device identical with that used previously (5,19,20) and that has been shown to be flow independent over the physio-logical range (19); for a full description of the device, see Johnson et al. (20). The threshold opening pressure during ITL10, ITL15, and ITL20 represented 8%T3%, 12%T4%, and 16% T 5% of MIP, respectively. Absolute pressure threshold loads were used to allow direct comparison with the work of Chiappa et al. (8,10) and Brown et al. (5). We have previously shown that the performance of our breath-by-breath gas analyzer is unaffected by the negative pressures generated during inspiratory loading (5).
Blood sampling and analysis.Arterialized venous
blood (6 mL) was drawn from a dorsal hand vein via an indwelling 21-gauge cannula (28). Arterialization was achieved by immersing the hand in water at 40-C for 10 min before cannulation and by warming the hand during trials using an infrared lamp. Blood was analyzed immediately for PCO2and pH (ABL520; Radiometer, Copenhagen, Denmark), which were subsequently used to calculate plasma bicarbonate
concentration ([HCOj3]) using the Henderson–Hasselbalch equation:
pH¼pKþlog ½HCO
3 0:03PCO2
A portion (5 mL) of each blood sample was immediately centrifuged for 10 min at 3000g, and the plasma supernatant was removed. Plasma [Laj] was subsequently determined using an automated analyzer (Biosen C_line Sport; EKF Diagnostics, Barleben, Germany). Plasma [Na+], [K+], and [Clj] were determined using ion-selective electrodes, and total protein concentration ([PPrj]) was assayed by immuno-turbidimetry (ABX Pentra 400; Horiba, Northampton, United Kingdom). [Atot
j
] was calculated as 2.45 [PPrj] (37). Plasma [SID] was calculated as the sum of the strong cations minus the sum of the strong anions (40):
½SID ¼ ð½Naþ þ ½KþÞ ð½Cl þ ½LaÞ
Plasma [H+] was calculated using the following equation, which describes the dependency of [H+] on the three inde-pendent physicochemical variables ([SID], PCO2, and [Atot
j
]), as well as on mass action equilibria, conservation of mass, and electroneutrality (40):
½Hþ4þ ðKAþ ½SIDÞ½Hþ3þ fKAð½SID ½AtotÞ ðKCPCO2þK¶WÞg
½Hþ2 fK
AðKCPCO2þK¶WÞ þ ðK3KCPCO2Þg½Hþ
ðKAK3KCPCO2Þ= 0
Values used for the equilibrium constants wereKA= 3.0 10j7 EqILj1, KC = 2.45 10
j11
(EqILj1)2, K3 = 6.0
10j11EqILj1, andKW= 4.410
j14
EqILj1.
To assess the individual contributions of the three inde-pendent variables ([SID], PCO2, and [Atot
j
]) to changes in plasma [H+], the latter was calculated as one of the three variables was changed to the measured value, whereas the others were held constant at resting values (35,40). Hereaf-ter, the measured and calculated [H+] are called [H+]measured and [H+]calculated, respectively.
Data and statistical analysis.The AUC for V˙ O2and plasma [Laj] during recovery was calculated using the trapezoidal rule. Data were analyzed using repeated-measures ANOVA, and pairwise comparisons were made according to Bonferroni-adjusted 95% confidence intervals. Statistical significance was set at P G 0.05. Results are presented as meanTSD.
RESULTS
For each participant, the exercise duration and, thus, W˙max achieved during the first incremental exercise test (group mean: 16.32T1.12 min and 318T20 W) were rep-licated in all subsequent tests.
Ventilatory responses, pulmonary gas exchange, HR, and arterial SpO2.Breathing pattern, minute
ventila-tion (V˙E) (155T27 LIminj1), V˙ O2peak(4.29T0.46 LImin
j1 ), V˙ CO2peak(5.30T0.75 LImin
j1
), HR (178T9 beatsIminj1), and SpO2(96%T 2%) at the end of maximal exercise were not different between trials (values in parentheses are pooled
BASIC
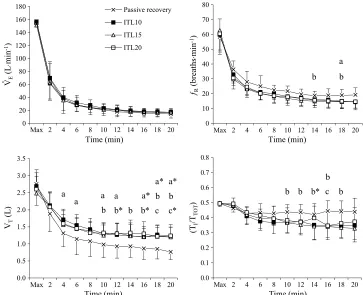
data from all trials). V˙E throughout recovery was not dif-ferent between trials (Fig. 1). Respiratory frequency (fR) during passive recovery (23 T 4 breaths per minute) was greater than that during ITL10 (19T 4 breaths per minute) and ITL15 (18T4 breaths per minute) (main effect for trial, PG 0.05). There was also a trend (P = 0.09) for fR to be higher during passive recovery compared with ITL20 (19T 4 breaths per minute). Tidal volume during passive recovery (1.07T 0.35 L) was lower (main effect for trial) than that during ITL10 (1.43 T 0.30 L) (P G 0.01), ITL15 (1.39 T 0.27 L) (PG0.01), and ITL20 (1.42 T 0.31 L) (PG0.05). Duty cycle (TI/TTOT) during passive recovery (0.44T0.04) was greater than that during ITL15 (0.38T 0.06) (main ef-fect for trial,PG0.05). There was a trialtime interaction effect forTI/TTOT(PG0.01), and differences were observed for passive recovery versus ITL15 and ITL20 in the latter half of recovery (Fig. 1). There were no differences be-tween trials for mean V˙ O2during recovery (pooled mean = 0.77T 0.28 LIminj1) or the AUC for V˙ O2during recovery (pooled mean = 19.4T 2.9 L). Mean V˙ CO2during passive recovery (0.72 T 0.14 LIminj1) was not different from ITL15 (0.83T0.19 LIminj1) but was less than ITL10 (0.87T 0.14 LIminj1) and ITL20 (0.86T0.13 LIminj1) (main effect for trial, P G 0.05). HR during recovery was not different between trials (pooled mean = 101T15 beatsIminj1). In all trials, SpO2was 98% T 1% at rest and 97% T 1% during recovery.
Plasma ions contributing to [SID].Changes in
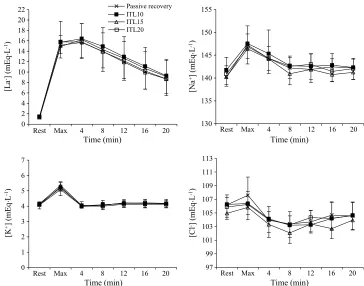
plas-ma ions contributing to [SID] are shown in Figure 2. Changes in [Laj], [Na+], [K+], and [Clj] after maximal exercise and during recovery were not different between trials; thus, the following data reflect the pooled meanTSD. Plasma [Laj] increased to 15.4T 2.7 mEqILj1after maxi-mal exercise and peaked at 16.0T2.8 mEqILj1after 4 min of recovery, after which values progressively declined. The mean AUC for plasma [Laj] during recovery was 261 T 60 mEq and was not different between trials. Plasma [Na+] increased 6.2T2.7 mEqILj1from rest after maximal exer-cise (main effect for time, P G 0.01) and remained ele-vated after 4 min of recovery (PG0.05). Thereafter, values were not different from rest. Plasma [K+] increased 1.1T 0.3 mEqILj1from rest after maximal exercise (main effect for time,P G 0.01) and returned to rest after 4 min of re-covery. Plasma [Clj] was unchanged from rest after maxi-mal exercise but fell by 2.0T 1.6 mEqILj1after 4 min of recovery (main effect for time, PG 0.05). Plasma [Clj] re-mained below rest at 8, 12 (PG0.01), and 16 min (PG0.05) of recovery and returned to rest after 20 min of recovery.
Plasma protein and the independent variables [SID], [Atot
j
], and PCO2.Changes in [PPr
j
], [SID], [Atot
j
[image:4.651.144.507.71.366.2]], and PCO2 after maximal exercise and during re-covery were not different between trials (Fig. 3); thus, the following data reflect the pooled mean T SD. [PPrj] in-creased 0.9T 0.3 gIdLj1from rest after maximal exercise FIGURE 1—Ventilatory responses at the end of maximal exercise and during 20-min recovery. Values are meanTSD. Difference between trials (PG0.05):apassive recovery versus ITL10;bpassive recovery versus ITL15;cpassive recovery versus ITL20.*PG0.01.
BASIC
(main effect for time, P G 0.01) and remained above rest throughout recovery (4–16 min inclusive,PG0.01; 20 min, P G 0.05). [SID] fell 7.3 T 1.8 mEqILj1 below rest after maximal exercise (main effect for time, P G 0.01) and remained below rest throughout recovery (PG0.01). [Atot
j
] increased 2.2T0.7 mEqILj1from rest after maximal exer-cise (main effect for time,PG0.01) and remained above rest throughout recovery (4–16 min inclusive,PG0.01; 20 min, PG0.05). PCO2remained unchanged from rest after maxi-mal exercise but then declined and remained 7.3T 4.0 mm Hg below rest throughout recovery (main effect for time: 4–16 min inclusive,PG0.01; 20 min,PG0.05).
Changes in the dependent variables [H+] and
[HCOj3].Changes in [H+]measured and [HCO
j
3] after maximal exercise and during recovery were not different between trials (Fig. 4); thus, the following data reflect the pooled mean T SD. [H+]measured increased 20.9 T 8.2 nEqILj1after maximal exercise (main effect for time, PG0.01) and remained above rest during 12 min of recov-ery (4 min,PG0.01; 8–12 min,PG0.05). Thereafter, values were not different from rest. The mean AUC for [H+]measured was 1095 T 137 nEq and was not different between trials. [HCOj3] fell 8.2 T 2.0 mEqIL
j1
below rest after maximal exercise and remained below rest throughout recovery (main effect for time,PG0.01).
A change in plasma [H+] reflects the net change of the three independent variables ([SID], PCO2, and [Atot
j
]) (40). The proportion of change in plasma [H+] caused by a corresponding change in a discrete independent variable
was calculated while assuming no change from rest in the remaining two independent variables. Similar to previous reports (5,35), an excellent agreement was observed be-tween [H+]measuredand [H+]calculated(r= 0.848,PG0.0001). Plasma [H+]calculated and the origins of change in [H+]calculateddue to changes in the three independent varia-bles are shown in Figure 5, with positive values represent-ing an acidifyrepresent-ing effect and negative values representrepresent-ing an alkalinizing effect. [H+]calculated increased by 22.5 nEqIL
j1 after maximal exercise during the passive recovery trial. Of this increase, 67% (15.1 nEqILj1) was attributable to a de-crease in [SID]. The slight inde-crease in PCO2after maximal exercise contributed a further 1.6 nEqILj1(+7%), whereas the increase in [Atot
j
] contributed 3.4 nEqILj1 (+15%). [H+]calculatedbegan to fall after 4 min of recovery. This was primarily due to a fall in PCO2 that reduced [H+]calculated by 7.2 nEqILj1 and countered the further decrease in [SID], which alone would have increased [H+]calculated by 20.9 nEqILj1. For the remainder of recovery, the decline in [H+]calculated toward resting values was primarily due to a gradual increase in [SID] and the maintenance of PCO2 be-low rest. As evident in Figure 5, the origins of change in [H+]calculatedduring passive recovery were markedly similar to that observed during inspiratory loading trials.
DISCUSSION
[image:5.651.142.506.70.356.2]The main finding of the present study was that lactate clearance and changes in plasma acid–base balance during FIGURE 2—Plasma ion concentrations at rest, after maximal exercise, and during 20-min recovery. Values are meanTSD.
BASIC
recovery from maximal exercise were not affected by pres-sure threshold inspiratory loading at 10, 15, or 20 cm H2O. That ITL15 did not influence lactate clearance during re-covery after maximal incremental exercise concurs with our previous observations (5). In contrast, using the same in-spiratory load and a similar incremental exercise test, Chiappa et al. (9) reported an approximate 2.5-mEqILj1 (25%) reduction in blood [Laj] during 15-min recovery. Given the positive relationship between active muscle mass during recovery and rates of lactate clearance (17,32), it is surprising that the relatively small inspiratory muscles can affect lactate clearance to a similar magnitude as the leg muscles (12,29,41). However, the inspiratory muscles do
[image:6.651.145.505.70.367.2]possess a superior capillary density and oxidative capacity compared with limb muscle (33), which makes them ideally suited for lactate metabolism. Chiappa et al. (9) also report large reductions in blood [Laj] with inspiratory loading without corresponding changes in [H+]. In our previous study (5), inspiratory loading lowered blood [Laj] (after inspiratory muscle training), thereby increasing [SID], which lowered [H+]. In the absence of a change in blood PCO2, the unchanged [H+] observed by Chiappa et al. (9) was attributed to changes in other (nonmeasured) strong ions that prevented an increase in [SID]. For this to be the case, the net change in the other strong ions must have been positive and equimolar to the reduction in [Laj] (i.e., the
FIGURE 4—Dependent variables [H+]measuredand [HCO
j
] at rest, after maximal exercise, and during 20-min recovery. Values are meanTSD. FIGURE 3—[PPrj] and the independent variables [SID], [Atot
j
], and PCO2at rest, after maximal exercise, and during 20-min recovery. Values are
meanTSD.
BASIC
[image:6.651.149.504.580.721.2]net change in cations and [Clj] would need to balance the 2.5-mEqILj1 reduction in [Laj]). Inspiratory loading–in-duced reductions in [K+] and/or [Na+] and/or increases in [Clj] would allow this. After exercise, transient increases in [K+] largely reflect significant efflux from muscle followed by rapid reuptake (22,24). Evidence to support the notion that inspiratory loading could significantly reduce K+efflux from locomotor muscles or accelerate K+reuptake is lack-ing. Furthermore, increases in plasma [Na+] and [Clj] after exercise are largely attributed to reduced plasma volume (21,44). We can find no reason why inspiratory loading in recovery would either lessen the postexercise reduction in plasma volume (thereby causing a relative decrease in [Na+]) or accentuate the decrease in plasma volume (thereby in-creasing [Clj]). Besides, any change in plasma volume results in simultaneous changes in [Na+] and [Clj] caus-ing little net change in [SID] and, therefore, [H+]. Our data (Fig. 2) and those of others (22,24) also show that postex-ercise changes in [Na+] and [K+] are transient and therefore unlikely to balance changes in [Laj] during a recovery pe-riod of 15 min. Inspiratory loading during recovery is thus likely to influence [SID] only through changing [Laj] (5). Furthermore, inspiratory loading is unlikely to influence plasma [Atot
j
], which also increases after maximal exercise secondary to exercise intensity–dependent reductions in plasma volume (21,35). Although Chiappa et al. (9) did not measure strong ion concentrations, our data do not support
their assertion that changes in these ions may explain their findings. Thus, given our current understanding of physi-cochemical principles (40), it is difficult to resolve the rea-son(s) why their results differ from ours. However, our results demonstrate no effect of inspiratory loading during recovery on lactate kinetics, and these data are also sup-ported by our measurement of strong ions.
[image:7.651.147.507.69.373.2]The differences between our findings and those of Chiappa et al. (8,9) are intriguing because experimental pro-tocols are very similar. Compared with Chiappa et al. (8,9), we observed a higher V˙ O2peak (present study = 53.6 mLIkgj1Iminj1, Brown et al. (5) = 52.4 mLIkgj1Iminj1, Chiappa et al. (8) = 47.9 mLIkgj1Iminj1, Chiappa et al. (9) = 45.5 mLIkgj1Iminj1) and, during recovery, a shorter time to peak [Laj] and a faster decline in [Laj], which implies a greater endurance training status in our partici-pants (16,42,43). Because training tends to increase rates of blood and muscle lactate clearance (2,13,16), it seems counterintuitive that individuals with inferior endurance training status would demonstrate greater lactate clearance with inspiratory loading. However, coincident with a lower blood [Laj] with inspiratory loading during recovery, Chiappa et al. (8) also reported increased HR and mean arterial blood pressure and, as measured by near-infrared spectroscopy, reduced m. vastus lateralis reoxygenation (suggestive of reduced convective oxygen delivery). These responses were attributed to respiratory muscle metaboreflex FIGURE 5—Plasma [H+]calculated(h), change in [H+]calculated (r), and origins of change in [H+]calculated from changes in the three independent
variables: [SID] (
)
), PCO2(g), and [Atotj
] (), after maximal exercise and during 20-min recovery. Values are meanTSD.
BASIC
activation, whereby increased afferent discharge from in-spiratory muscles and a concurrent increase in sympathetic vasoconstrictor activity result in a redistribution of blood flow from the periphery to the inspiratory muscles (11). A resultant increase in inspiratory muscle perfusion would probably increase lactate uptake by inspiratory muscles (18). Conversely, by virtue of endurance training–induced in-creases in inspiratory muscle mitochondrial enzyme activity (34), the ‘‘threshold’’ for respiratory muscle metaboreflex activation may have been higher in our participants (1,26,46), thus precluding changes in HR, cardiac output distribution, and, hence, systemic lactate distribution. Indeed, recent work by Callegaro et al. (7) demonstrates that, compared with sedentary individuals (V˙ O2peak = 36.7 mLIkg
j1 Iminj1), those with a history of whole-body endurance training (V˙ O2peak= 52.9 mLIkg
j1
Iminj1) are more resistant to acti-vation of the inspiratory muscle metaboreflex. The un-changed HR responses during inspiratory loading compared with passive recovery in the present and in our previous study (5) partly support this notion. Of course, from an ecological validity perspective, if the efficacy of loaded breathing in aiding recovery is restricted to untrained indi-viduals, one may question its utility.
Previously, Brown et al. (5) showed that after inspiratory muscle training, which increased participants’ MIP by 34%, lactate clearance was accelerated at the same absolute (15 cm H2O or 10% MIP) but not relative (20 cm H2O or 13% MIP) inspiratory load, thus suggesting that the magni-tude of the pressure threshold load may be an important determinant of whether inspiratory loading accelerates lac-tate clearance. The findings of the present study do not support this hypothesis, although the possibility remains that inspiratory loads above 20 cm H2O may have increased lactate clearance due to activation of a respiratory muscle metaboreflex (see above). However, it is noteworthy that anecdotal reports from our participants suggest that 20 cm H2O was approaching the maximal tolerable load (most participants reported severe air hunger especially during the first 5 min of recovery). Notwithstanding this, it seems increasingly likely that a training-induced increase in the
oxidative capacity of the inspiratory muscles (4,27,36,46), rather than the intensity of the load relative to MIP, primarily explains our previous observation of increased lactate clearance during recovery with inspiratory loading after in-spiratory muscle training (5).
Consistent with previous observations (5,9), inspiratory loading modified breathing pattern compared with passive recovery. Specifically, the same V˙E was achieved with a lowerfRand TI/TTOTbut greater tidal volume. This breath-ing strategy was probably generated by the respiratory con-troller to minimize the energy cost of breathing by reducing the pressure–time integral of the inspiratory muscles (14,47). Furthermore, reducing TI/TTOT prolongs expiration, thus increasing inspiratory muscle relaxation time and reducing end-expiratory lung volume, which enhances inspiratory muscle force-generating capacity (14,38,47). This breathing pattern could also affect gas exchange by increasing the ratio of alveolar to dead space ventilation, which may explain why inspiratory loading in the present study increased V˙ CO2 and resulted in a trend toward lower [H+]measured (Fig. 4). These changes were, however, very small and probably of limited significance.
In conclusion, pressure threshold inspiratory loading at 10, 15, and 20 cm H2O had no effect on lactate clearance or plasma acid–base balance when applied during recovery from maximal incremental exercise. These findings support our recent observations (5) but contradict those of Chiappa et al. (8,9). The reason(s) for this disagreement remains unclear but may be related to interindividual differences in endurance training status. The findings of the current study and of Brown et al. (5) also suggest that training of the in-spiratory muscles may be necessary for this muscle group to engage in measurable lactate uptake with inspiratory load-ing. The influence of endurance training status on the effi-cacy of inspiratory muscle loading during recovery thus provides an attractive avenue for future investigation.
No funding was received for this work.
The authors have no conflicts of interest to declare.
The results of the present study do not constitute endorsement by the American College of Sports Medicine.
REFERENCES
1. Babcock MA, Pegelow DF, Johnson BD, Dempsey JA. Aerobic fitness effects on exercise-induced low-frequency diaphragm fa-tigue.J Appl Physiol. 1996;81:2156–64.
2. Bergman BC, Wolfel EE, Butterfield GE, et al. Active muscle and whole body lactate kinetics after endurance training in men.J Appl Physiol. 1999;87:1684–96.
3. Bogdanis GC, Nevill ME, Lakomy HK, Graham CM, Louis G. Effects of active recovery on power output during repeated maxi-mal sprint cycling.Eur J Appl Physiol Occup Physiol. 1996;74: 461–9.
4. Brown PI, Sharpe GR, Johnson MA. Inspiratory muscle training reduces blood lactate concentration during volitional hyperpnoea.
Eur J Appl Physiol. 2008;104:111–7.
5. Brown PI, Sharpe GR, Johnson MA. Loading of trained inspira-tory muscles speeds lactate recovery kinetics. Med Sci Sports Exerc. 2010;42(6):1103–12.
6. Buchheit M, Cormie P, Abbiss CR, Ahmaidi S, Nosaka KK, Laursen PB. Muscle deoxygenation during repeated sprint run-ning: effect of active vs. passive recovery.Int J Sports Med. 2009; 30:418–25.
7. Callegaro CC, Ribeiro JP, Tan CO, Taylor JA. Attenuated inspi-ratory muscle metaboreflex in endurance-trained individuals.
Respir Physiol Neurobiol. 2011;177:24–9.
8. Chiappa GR, Ribeiro JP, Alves CN, et al. Inspiratory resistive loading after all-out exercise improves subsequent performance.
Eur J Appl Physiol. 2009;106:297–303.
9. Chiappa GR, Roseguini BT, Alves CN, Ferlin EL, Neder JA, Ribeiro JP. Blood lactate during recovery from intense exercise: impact of inspiratory loading.Med Sci Sports Exerc. 2008;40(1): 111–6.
10. Chiappa GR, Roseguini BT, Vieira PJ, et al. Inspiratory muscle training improves blood flow to resting and exercising limbs in
BASIC
patients with chronic heart failure.J Am Coll Cardiol. 2008;51: 1663–71.
11. Dempsey JA, Sheel AW, St Croix CM, Morgan BJ. Respiratory influences on sympathetic vasomotor outflow in humans.Respir Physiol Neurobiol. 2002;130:3–20.
12. Dodd S, Powers SK, Callender T, Brooks E. Blood lactate disap-pearance at various intensities of recovery exercise.J Appl Physiol. 1984;57:1462–5.
13. Dubouchaud H, Butterfield GE, Wolfel EE, Bergman BC, Brooks GA. Endurance training, expression, and physiology of LDH, MCT1, and MCT4 in human skeletal muscle. Am J Physiol Endocrinol Metab. 2000;278:E571–9.
14. Eastwood PR, Hillman DR, Finucane KE. Ventilatory responses to inspiratory threshold loading and role of muscle fatigue in task failure.J Appl Physiol. 1994;76:185–95.
15. Fitts RH. The cross-bridge cycle and skeletal muscle fatigue.
J Appl Physiol. 2008;104:551–8.
16. Fukuba Y, Walsh ML, Morton RH, Cameron BJ, Kenny CT, Banister EW. Effect of endurance training on blood lactate clear-ance after maximal exercise.J Sports Sci. 1999;17:239–48. 17. Gladden LB. Lactate uptake by skeletal muscle.Exerc Sport Sci
Rev. 1989;17:115–55.
18. Gladden LB. Muscle as a consumer of lactate.Med Sci Sports Exerc. 2000;32(4):764–71.
19. Johnson PH, Cowley AJ, Kinnear WJ. Evaluation of the THRESHOLD trainer for inspiratory muscle endurance training: comparison with the weighted plunger method. Eur Respir J. 1996;9:2681–4.
20. Johnson PH, Cowley AJ, Kinnear WJ. Incremental threshold loading: a standard protocol and establishment of a reference range in naive normal subjects.Eur Respir J. 1997;10:2868–71. 21. Johnson RL, Heigenhauser GF, Hsia CW, Jones NL, Wagner PD.
Determinants of gas exchange and acid–base balance during exer-cise. In: Rowell LB, Shepherd JT, editors.Handbook of Physiology. Section 12. Exercise: Regulation and Integration of Multiple Sys-tems. Oxford (UK): Oxford University Press; 1996. p. 515–84. 22. Kowalchuk JM, Heigenhauser GJ, Lindinger MI, Obminski G,
Sutton JR, Jones NL. Role of lungs and inactive muscle in acid– base control after maximal exercise. J Appl Physiol. 1988;65: 2090–6.
23. Kowalchuk JM, Scheuermann BW. Acid–base balance: origin of plasma [H+] during exercise.Can J Appl Physiol. 1995;20:341–56. 24. Lindinger MI, Heigenhauser GJ, McKelvie RS, Jones NL. Blood ion regulation during repeated maximal exercise and recovery in humans.Am J Physiol. 1992;262:R126–36.
25. Lindinger MI, Kowalchuk JM, Heigenhauser GJ. Applying phys-icochemical principles to skeletal muscle acid–base status.Am J Physiol Regul Integr Comp Physiol. 2005;289:R891–4.
26. McConnell AK, Lomax M. The influence of inspiratory muscle work history and specific inspiratory muscle training upon human limb muscle fatigue.J Physiol. 2006;577:445–57.
27. McConnell AK, Sharpe GR. The effect of inspiratory muscle training upon maximum lactate steady-state and blood lactate concentration.Eur J Appl Physiol. 2005;94:277–84.
28. McLoughlin P, Popham P, Linton RA, Bruce RC, Band DM. Use of arterialized venous blood sampling during incremental exercise tests.J Appl Physiol. 1992;73:937–40.
29. Menzies P, Menzies C, McIntyre L, Paterson P, Wilson J, Kemi OJ. Blood lactate clearance during active recovery after an in-tense running bout depends on the intensity of the active recovery.
J Sports Sci. 2010;28:975–82.
30. Miller MR, Hankinson J, Brusasco V, et al. Standardisation of spirometry.Eur Respir J. 2005;26:319–38.
31. Monedero J, Donne B. Effect of recovery interventions on lactate removal and subsequent performance.Int J Sports Med. 2000;21: 593–7.
32. Perret C, Mueller G. Impact of low-intensity isocapnic hyperpnoea on blood lactate disappearance after exhaustive arm exercise.Br J Sports Med. 2007;41:588–91.
33. Polla B, D’Antona G, Bottinelli R, Reggiani C. Respiratory muscle fibres: specialisation and plasticity.Thorax. 2004;59:808–17. 34. Powers SK, Coombes J, Demirel H. Exercise training–induced
changes in respiratory muscles.Sports Med. 1997;24:120–31. 35. Putman CT, Jones NL, Heigenhauser GJ. Effects of short-term
training on plasma acid–base balance during incremental exercise in man.J Physiol. 2003;550:585–603.
36. Ramirez-Sarmiento A, Orozco-Levi M, Guell R, et al. Inspiratory muscle training in patients with chronic obstructive pulmonary disease: structural adaptation and physiologic outcomes. Am J Respir Crit Care Med. 2002;166:1491–7.
37. Rossing TH, Maffeo N, Fencl V. Acid–base effects of altering plasma protein concentration in human blood in vitro. J Appl Physiol. 1986;61:2260–5.
38. Smith J, Bellemare F. Effect of lung volume onin vivocontraction characteristics of human diaphragm. J Appl Physiol. 1987;62: 1893–900.
39. Spencer M, Bishop D, Dawson B, Goodman C, Duffield R. Me-tabolism and performance in repeated cycle sprints: active versus passive recovery.Med Sci Sports Exerc. 2006;38(8):1492–9. 40. Stewart PA. Modern quantitative acid–base chemistry. Can J
Physiol Pharmacol. 1983;61:1444–61.
41. Taoutaou Z, Granier P, Mercier B, Mercier J, Ahmaidi S, Prefaut C. Lactate kinetics during passive and partially active recovery in endurance and sprint athletes.Eur J Appl Physiol Occup Physiol. 1996;73:465–70.
42. Thomas C, Perrey S, Lambert K, Hugon G, Mornet D, Mercier J. Monocarboxylate transporters, blood lactate removal after supra-maximal exercise, and fatigue indexes in humans.J Appl Physiol. 2005;98:804–9.
43. Thomas C, Sirvent P, Perrey S, Raynaud E, Mercier J. Relation-ships between maximal muscle oxidative capacity and blood lac-tate removal after supramaximal exercise and fatigue indexes in humans.J Appl Physiol. 2004;97:2132–8.
44. Wilkerson JE, Horvath SM, Gutin B, Molnar S, Diaz FJ. Plasma electrolyte content and concentration during treadmill exercise in humans.J Appl Physiol. 1982;53:1529–39.
45. Wilson SH, Cooke NT, Edwards RH, Spiro SG. Predicted normal values for maximal respiratory pressures in Caucasian adults and children.Thorax. 1984;39:535–8.
46. Witt JD, Guenette JA, Rupert JL, McKenzie DC, Sheel AW. In-spiratory muscle training attenuates the human reIn-spiratory muscle metaboreflex.J Physiol. 2007;584:1019–28.
47. Yan S, Bates JH. Breathing responses to small inspiratory thresh-old loads in humans.J Appl Physiol. 1999;86:874–80.
![FIGURE 4—Dependent variables [H+]measured and [HCOj] at rest, after maximal exercise, and during 20-min recovery](https://thumb-us.123doks.com/thumbv2/123dok_us/165799.42943/6.651.145.505.70.367/figure-dependent-variables-measured-hcoj-maximal-exercise-recovery.webp)
![FIGURE 5—Plasma [H+variables: [SID] (]calculated (h), change in [H+]calculated (r), and origins of change in [H+)]calculated from changes in the three independent), PCO2 (g), and [Ajtot ] (�), after maximal exercise and during 20-min recovery](https://thumb-us.123doks.com/thumbv2/123dok_us/165799.42943/7.651.147.507.69.373/plasma-variables-calculated-calculated-calculated-independent-exercise-recovery.webp)
