The ecology and conservation of bryophytes
in Tasmanian wet eucalypt forest
Perpetua A. M. Turner B.Sc. (Hons)
Submitted in fulfilment of the requirements of the degree of
Doctor of Philosophy
School of Geography and Environmental Studies
University of Tasmania
Hobart
Declaration
This thesis contains no material that has been accepted for the award of any other degree or diploma in any tertiary institution and, to the best of my knowledge and belief, the thesis contains no material previously published or written by another person, except where due reference is made in the text.
Perpetua A.M. Turner (nee Blanks)
11th July 2003
Authority of Access
This thesis may be made available for loan. Copying of any part of this thesis is
prohibited for two years from the date this statement was signed; after that time limited copying is permitted in accordance with the Copyright Act 1968.
Perpetua A.M. Turner (nee Blanks)
11th July 2003
The aim of this study was to determine the factors that affect bryophyte richness and species composition in wet eucalypt forest, including old growth and forest disturbed by wildfire or silvicultural practice.
Approximately one third of the total bryophyte flora for Tasmania was recorded in old growth mixed forest, with more liverwort than moss species found. Bryophyte species composition was significantly different between groups of sites of forest from the northwest, central and southern areas of the state. Mean annual temperature, altitude, rainfall of the driest month and aspect were most significant in predicting variation in bryophyte species composition.
The use of vascular plants as surrogates for the conservation ofbryophyte species was examined. Vascular plant and fem species richness were significant but poor predictors of bryophyte species richness. A minimum set of 31 sites reserved all vascular species and a large percentage (82.9%) ofbryophyte species at least once. Thus, reserves selected using vascular plants are likely to reserve a large proportion of bryophyte species. The reserve sets included more sites of regenerating forest than old growth forest indicating the importance for conservation of multi-aged wet eucalypt forest.
Many species preferentially occurred on a substrate type within a particular forest age class. The bryophyte species composition on old growth Nothofagus cunninghamii and
Atherosperma moschatum trees were significantly dissimilar to a large number of other
substrate/age class groups. Consistent with previous literature, bark type affected species composition.
Successional stages ofbryophytes species occurrence after disturbance were
documented. Species occurring frequently in primary succession did not survive into later successional stages. Many species that established in post-primary successional forest persisted into late successional forest. Liverwort species dominated in late
successional forest. The exclusive occurrence of the epiphytic mosses Neckera pennata and Calyptopogon mnioides in regenerating forest is strongly associated with the
presence of Pomaderris apetala and Acacia dealbata trees.
I am indebted to my supervisors. Jamie Kirkpatrick for his enthusiasm, support, encouragement and wisdom and Emma Pharo, for her knowledge, experience, advice and for keeping me motivated. This PhD and the move to Tasmania would not have been possible without assistance from an AP A scholarship. Additional encouragement, advice and support from a number of people also facilitated the move. I thank Mark Burgman for initiating my Honours project based on bryophytes which introduced me to a fascinating new world of plants. I thank the late George A.M. Scott for his wisdom, time, patience and enthusiasm. Without his counsel I would not have seriously considered undertaking a PhD on bryophytes in Tasmania.
Mick Brown and John Hickey provided valuable logistic and technical support and taught me a great deal about forest ecology. Their advice, enthusiasm and constant encouragement greatly contributed to the project. I thank Sue Jennings for the tremendous assistance and logistic support while in the field, and for her friendship. Leigh Edwards assited in finding relevant field sites. Keely Ough provided ecological advice and much reference material.
Fieldwork would not have been possible without the assistance from Forestry Tasmania staff and Paul Smart, Darren Turner, Emma Pharo, Steve Scott, Steve Davis, Craig Weston, Frank Bishop, Rod Evans, Sandra Hetherington, Bill Tewson and Peter Ladaniwskyi. The patience and unbounded assistance given by Paul Smart is genuinely appreciated.
I am indebted to two great friends, Anita Wild and Mark Poll and the 'children', Farmy, Sal and Mush. The support, encouragement, guidance given from Anita and Mark (and licks from the 'children'!) enabled me to achieve many goals.
The amazing bryological network was always ready and willing to help at every tum. Advice and assistance were received predominantly with sampling methods and identification of difficult specimens. I am indebted to bryologists in Australia and New Zealand, in particular Dana Bergstrom, Elizabeth Brown, Judith Curnow, Paddy Dalton, Jean Jarman, Neils Klazenga, David Meagher, Pina Milne, Emma Pharo, Helen Ramsay, Rod Seppelt, Jessica Beever, Pat Brownsey, Alan Fife and David Glenny.
Assitance was also gratefully received from John J. Engel (Lepidoziaceae and Geocalycaceae), Jan-Peter Frahm (Campylopus), RiclefGrolle (Lepidoziaceae, Lejeuneaceae), Bob Magill, Ray Tangney
(Camptochaete) and Kohsaku Yamada (Radula). The assistance and advice provided by David Meagher
is greatly appreciated. I am also indebted to staff of the Tasmanian Herbarium, especially Lyn Cave. I am indebted to Leon Barmuta, Lee Belbin, Steve Candy, Richard Little, Peter Minchin and Henrik Wahren for their advice and assitance with some analyses.
Thanks to the staff and fellow 'Jamie' students of Geography and Environmental Studies. I thank Moya Kilpatrick and Pauline Harrowby for their assistance and patience. Denis Charlesworth carried out chemical analyses of soil samples. Kate Charlesworth helped find theses, articles and maps. David Somerville assisted with fieldwork equipment.
Jamie Kirkpatrick, Emma Pharo, John Hickey, Stephen Bresnehan, Aruta Wild, Ljiljana Sekuljica, Sapphire McMullan-Fisher and Rod Seppelt carried out proofreading. Anita Wild prepared the maps for the chapters. Darren Turner assisted with formatting of this thesis. Thanks especially to Anita and Sapphire for spending time checking the whole thesis.
To the Blanks family, I thank you for all your support and understanding. To Nell and Tess whose 'garden landscaping' and waggling tails never failed to bring a smile to my face when things seemed awry. Thanks also to the Turner family for your best wishes and support.
Moss Gathering. Theodore Raethke
This poem has been removed
for copyright reasons
Chapter One
Introduction ... 1
Bryophytes ... 1
Bryophytes in forest ecosystems ... 1
Wet eucalypt and mixed forest ... 1
Fire in wet eucalypt forests ... 2
Silvi cultural practices in wet eucalypt forests ... .3
The effect of wildfire and logging practices on bryophytes ... 3
Bryophytes in old growth mixed forest.. ... 5
The importance of substrate in forests ... 5
Conservation ofbryophytes in forests ... 6
Successional processes in forest ecosystems ... 8
Thesis aims and structure ... 8
Chapter Two
Bryophyte relationships with environment in Tasmanian old growth wet eucalypt forest ... 11Abstract ... 11
Introduction ... 12
Materials and Methods ... 13
Study area ... 13
Vegetation sampling ... 16
Environmental variables ... 17
Analysis ... 19
Species richness ... 19
Species composition ... 20
Results ... 21
Species richness ... 21
Species composition ... 23
Discussion ... 32
Chapter Three
Successional sequences of bryophytes in mixed forest, Tasmania ... .34Abstract ... 34
Introduction ... 3 5 Materials and Methods ... 3 7 Study area ... .' ... 3 7 Vegetation sampling ... 38
Environmental variables ... 38
Analysis ... 40
Results ... 40
Chapter Four
Relationships between bryophyte and vascular plant species richness and
composition in mixed forest, Tasmania ... 65
Abstract ... 65
Introduction ... 66
Materials and Methods ... 67
Study area ._ ... 67
Vegetation sampling ... 67
Analysis ... 68
Species richness ... 68
Minimum reserve set using vascular plants ... 68
Species composition ... 69
Results ... 70
Species richness ... 70
Minimum reserve sets ... 78
Species composition ... 81
Discussion ... 87
Chapter Five
Influence of substrate and age of stand on bryophyte species composition in Tasmanian Dlixed forest ... 91Abstract ... 91
Introduction ... 92
Materials and Methods ... : ... 94
Study area ... 94
Vegetation sarnpling ... 94
Environmental variables ... 95
Analysis ... 95
Species - substrate association ... 95
Substrate species composition ... 97
Results ... : ... 98
Species - substrate association ... 103
Substrate species composition ... l 08 Discussion ... 114
Chapter Six
A comparison of bryophytes and vascular plants in wet eucalypt forest regeneration after clear-felling and wildfire ... 119Abstract ... 119
Introduction ... 120
Materials and Methods ... 123
Site selection ... 123
Vegetation sampling ... 129
Environmental variables ... 129
Analysis ... 129
Individual species association with logging or wildfire ... 129
Site environmental characteristics ... 129
Species composition ... 130
Individual species association with logging or wildfire ... 13 2
Site environmental characteristics ... 134
Species composition and floristic difference (n
=
50) ... 135Discussion ... 149
Species frequency and forest attributes (n = 50) ... 149
Southern, Northern, and Central forest- species composition and forest attributes ···152 .
Southern forest ...•... 152
Northern forest ... 152
Central forest ... 152
Chapter Seven
General discussion ... o••···l55 Wet eucalypt forest compared with other forest ecosystems ... 155Vascular plants as surrogates forbryophyte species ... 155
Implications of forestry operations on bryophytes ... 156
Reservation and conservation ofbryophytes ... 158
Implications for forest management ... ···:···~159
Chapter Eight
Appendices ... 161List of Figures, Tables and Appendices
Figure 2.1. Location of old growth mixed forest sites in Tasmania ... 15 Figure 2.2. Species accumulative curve for bryophytes in homogenous old growth
mixed forest ... 1 7 Figure 2.3. Three-dimensional bryophyte, moss and liverwort ordinations of sites in old growth mixed forest. ... 25 Figure 3.1. Location of 105 study sites in Tasmanian wet eucalypt forest ... .39 Figure 4.1. Regression of species richness for all sites and for each age class for
vascular lifeform against species richness ofbryophyte, moss and liverworts ... 72 Figure 4.2. Species accumulation curves generated using the heuristic algorithm for the criteria of vascular plants reserved once and vascular plants reserved twice ... 79 Figure 4.3. Two-dimensional ordinations for ( a) all vascular plants, (b) all bryophyte
species and ( c) all bryophytes and vascular plants ... 83 Figure 5 .1. Ordination of environmental variables of 105 sites ... 108 Figure 5.2. Three dimensional ordination of mean of ordination scores and 95% CI for
each substrate by age class ... .111 Figure 5.3. Substrate age classes with pairwise comparisons from ANOSIM ... 113 Figure 6.1. Location oflogging and wildfire sites in Tasmania wet eucalypt forest...125 Figure 6.2. Two-dimensional ordinations of bryophyte species data and vascular plant
species data for logging and wildfire sites ... 140 Figure 6.3. Two-dimensional ordination ofbryophyte species data with vectors of
significant correlation for logging and wildfire sites ... 142 Figure 6.4. Two-dimensional ordination of vascular species data with vectors of
significant correlation for logging and wildfire sites ... 148
Table 2.1. Environmental variables for old growth mixed forest sites ... 14 Table 2.2. Summary of bryophyte, moss and liverwort species richness and species
totals in each latitudinal band for old growth mixed forest ... 22 Table 2.3. Variance explained (/) by environmental variables for bryophyte, moss and
liverwort species richness of old growth mixed forest ... .23 Table 2.4. Vector results for ordination of old growth mixed forest sites ... 28 Table 2.5. Occurrence ofbryophyte species in old growth mixed forest along the fitted
vector for mean annual temperature ... 29 Table 2.6. Redundancy analysis results for bryophyte, moss and liverwort species
composition explained by environmental variables for old growth mixed forest ···31 . Table 3.1. Species that occur in only one age class ... .42
Table 3.2. Mean percentage frequency of selected species in all sites within age class groups ... 43 Table 3.3. Presence/absence of selected species in sites dominated by Eucalyptus
obliqua ... 49
Table 3.4. Presence/absence of all species in sites dominated by Eucalyptus regnans .53 Table 3.5. Mean cover of substrate types and basal area of vascular species for forest
age classes ... ~ ... 60
age classes ... 71
Table 4.2. Bryophyte species unreserved in 31 - subset of sites (reservation of all vascular species at least once) ... 80
Table 4.3. Number of sites in common between vascular plant and bryophyte communities defined by the cluster analysis of 105 sites ... 81
Table 4.4. Mantel test statistic (r) of correlations of Bray-Curtis dissimilarity matrices for lifeform groups for all age classes, age class a, ageclass b and ageclass c ... 86
Table 5.1 Environmental variables for 105 sites ... 96
Table 5.2. Samples per substrate age class ... 99
Table 5.3. Percentage frequency of species found only on one substrate type ... 100
Table 5.4. Percentage frequency of species found only on a group oflike substrate types: coarse woody debris, coarse woody debris and ground, and ground and rock ···101
Table 5.5. Percentage frequency of species found only on a group oflike substrate types: vascular plants, and vascular plants and fallen branches ... 102
Table 5.6. Substrate age classes and bryophyte species with positive association and significance ... I 05 Table 6.1. Characteristics for sites disturbed by wildfire or clearfell and bum logging ···126
Table 6.2. Logging events sampled ... 128
Table 6.3. Wildfire events sampled ... 128
Table 6.4. Vascular and bryophyte species with a significant difference in frequency between logging and wildfire regeneration ... 133
Table 6.5. Percentage cover of above ground substrates and basal area (m2ha-1) of vascular species (mean± SE) for sites grouped by logging and wildfire regeneration ... 136
Table 6.6. Percentage cover of above ground substrates and basal area (m2 ha-1) of vascular species (mean ± SE) for Southern forest sites grouped by logging and wildfire regeneration ... 13 7 Table 6.7. Percentage cover of above ground substrates and basal area (m2ha-1) of vascular species (mean± SE) for Northern forest sites grouped by logging and wildfire regeneration ... 13 8 Table 6.8. Percentage cover of above ground substrates and basal area (m2 ha-1) of vascular species (mean± SE) for Central forest sites grouped by logging and wildfire regeneration ... 139
Table 6.9. The results of vector fitting site environmental variables into the ordinations of Southern, Northern and Central forest logging and wildfire sites for bryophyte species and vascular plant data ... 143
Table 6.10. Generalised linear model for response variable logging/wildfire vector scores for Central sites ... 145
Table 6.11. Ordered table for bryophyte species occurring in five or more samples along the vector for logging/wildfire for sites in Central forest.. ... 146
Appendix 8.1. Site information for 105 sites ... 161
Appendix 8.2. Site characteristics for 105 sites ... 164
Appendix 8.4. Bryophyte species recorded from 105 sites listed according to lifeform ··· ... 171 Appendix 8.5. Number of vascular plant and bryophyte species taxa per lifeform for all
age classes ... 176 Appendix 8.6. Description and two way sorted table of vascular plant species with>
20% frequency in at least one vascular plant community ... 177 Appendix 8. 7. Species - substrate/age class associations ... 180 Appendix 8.8. R values from pairwise comparisons of substrate/age classes (species
compostion data) using ANOSIM ... 188 Appendix 8.9. Frequency of occurrence ofbryophyte species and vascular plants in
logging sites, wildfire sites and all sites ... 193
Bryophytes
Chapter One
Introduction
The term 'bryophyte' refers collectively to non-vascular plants of the Divisions Bryophyta (mosses), Hepatophyta (liverworts) and Anthocerotophyta (homworts) (Crum 2001). Homworts and liverworts are usually considered together for
convenience. Bryophytes are non-vascular, that is they lack xylem and phloem tissue. Other features include 'alternation of generations', where a photosynthetic, free-living gametophyte (haploid generation) is dominant over the simple and largely 'parasitic' sporophyte ( diploid generation).
Bryophytes are major components of many ecosystems, including deserts, grassland, tropical, alpine, polar and forest (Longton 1992). Current estimates of the number of bryophyte species worldwide is approximately 25, 000 (Crum 2001). Currently the Australian bryophyte flora is estimated to consist of approximately 1100 mosses and 480 liverwort species (Scott and Bradshaw 1986; Buck et al, 2002), although a more
. recent estimate of 606 liverworts species has been made (C. Cargill pers comm. 2003). In Tasmania, the bryophyte flora consists of approximately 450 moss species (Moscal et al. 1997; Buck et al. 2002) and 300 liverwort species (Ratkowsky 1987). Although
Moscal et al. (1997) list approximately 330 liverwort species, records upon which some
of these names are based have not been completely verified. These figures are expected to increase with further research.
Bryophytes in forest ecosystems
Wet eucalypt and mixed forest
Classification of forest vegetation in Australia is primarily based on vascular plant species (Ashton and Attiwill 1994). 'Wet sclerophyll' forest was initially defined by Beadle and Costin (1952) to cover forests with an understorey ofbroad-leaved shrubs
'
and/or ferns and an overstorey dominated by tall eucalypts. Wet sclerophyll forests are roughly equivalent to the 'tall open forests' of (Specht 1970) however, tall open forest is defined by structure not the understorey. Forests in Tasmania are of three main types,
1 - Introduction
temperate rainforest, wet eucalypt forest and dry sclerophyll forests (Wells and Hickey 1999). Mixed forest is defined as vegetation with a rainforest understorey and eucalypt overstorey (Gilbert 1959). The term 'wet eucalypt' forest includes both mixed forest and wet sclerophyll forest (Kirkpatrick et al. 1988). Wet eucalypt forests in Tasmania achieve superior growth on fertile soils and sites where rainfall is between 1000 and 1500 mm per annum (Kirkpatrick et al. 1988). Where there is both a reliable and high rainfall and rainfall of the driest month is greater than 50 mm (Kirkpatrick et al. 1988), wet eucalypt forest and mixed forest will also exist on exposed sites. In Australia, mixed forest is found in the states of Victoria, New South Wales, Queensland and Tasmania. Tasmania has the greatest extent and diversity of mixed forest.
Approximately 29% of wet eucalypt forest in Tasmania is old growth or mature mixed forest, with 64% existing in reserves (Resource Planning and Development Commission 2002).
Fire in wet eucalypt forests
Fire is a natural or anthropogenic disturbance that interrupts the functioning and structure of an environment. Fire plays a fundamental role in the establishment and survival of wet eucalypt forests. Fire frequency may range from once in every 20 to once in 100 - 400 years (Mount 1979). The eucalypt overstorey of mixed forest requires fire at intervals of 100 - 400 years to regenerate, thus, in the absence of fires for more than approximately 400 years, the eucalypt overstorey dies out and rainforest will persist (Gilbert 1959; Jackson 1968). The impact of fire on wet eucalypt forest is determined by a number of factors, such as past disturbance, fuel and climate (Ashton 1981b). A substantial amount of fuel is produced via growth and litter accumulation, especially where forests exist on fertile soils and in areas higher rainfall. In conditions of dry winds and high temperatures, fires can climb into the eucalypt canopy,
particularly when the area has suspended dry litter and species with fibrous bark (Ashton 1981b). Little information exists of wildfire in Tasmania prior to 1912 however wildfires are known to have occurred before and after British settlement in
1803 (Luke and McArthur 1978). Major fire seasons occurred for the years 1897 - 98, 1913 - 14, 1933 - 34, 1944 - 45, 1960 - 61 and 1966 - 67 (Luke and McArthur 1978).
Silvicultural practices in wet eucalypt forests
Timber harvesting is a major human disturbance in forests (Hansen et al. 1991; Attiwill 1994a). Mixed forests of Tasmania have a high wood production value. They are harvested for the production of sawlogs (Eucalyptus spp.) pulpwood and speciality wood products (rainforest species). The silvicultural system practiced since the 1960's in these forests has been clearfell and burn harvesting. This is currently the most commonly used method currently in Tasmania (Hickey et al. 200 l ). Clearfell and burn harvesting involves completely clearing an area of all trees in an area, usually less than 100 ha (Forest Practices Board 2000), in a single operation (Gilbert and Cunningham 1972). Th~ remaining litter (slash, unsaleable timber, remnant understorey etc.) is burnt to create a seedbed in which regeneration of both overstorey and understorey vascular plants can occur. Revegetation of Eucalyptus has been undertaken by either sowing seed by hand, by aerial or naturally via remaining live trees. At present, methods primarily utilise aerial sowing (Gilbert and Cunningham 1972; Florence 1996). The interval between logging events for mixed forest is currently planned at 90 years (Whiteley 1999). The Forest Practices Board largely oversees management of forests (Forest Practices Board 2000). The Forest Practices Code provides practical guidelines for the protection of environmental values and biodiversity.
Whether or not silvicultural practice mimics natural ecological process and has similar affects on biodiversity is a much debated issue (Hansen et al. 1991; Attiwill l 994a; Brown 1996; Lindenmayer et al. 2000). If timber harvesting is to be used as a surrogate for natural disturbance (Attiwill 1994b) then verification of its suitability is required.
The effect of wildfire and logging practices on bryophytes
Much emphasis, particularly in the northern hemisphere, has been given to the
ecological role of bryophytes in forests and their contribution to biodiversity, primarily as a consequence of forest management (Gustafsson and Hallingback 1988; Soderstrom
J
1988a; Franklin 1993; Frisvoll and Presto 1997; Lindenmayer and Franklin 1997; Cooper-Ellis 1998; Rambo and Muir 1998b; Hazell and Gustafsson 1999; Qian et al. 1999; Boudreault et al. 2000; Ross-Davis and Frego 2002). Pressure for the
1 - Introduction
Similar bryophyte genera colonise early after fire and logging disturbances in both wet eucalypt and boreal forests (Duncan and Dalton 1982; Longton 1992; Johnston and Elliot 1996; Quinby 2000). Comparative studies in boreal forest have reported differences in bryophyte species composition following disturbance between areas previously burned in wildfire and those clear-cut logged (Johnston and Elliot 1996; Whittle et al. 1997; Nguyen-Xuan et al. 2000). Reich et al. (2001) found no indication
of differing bryophyte species composition in forest stands of comparable age and forest type that originated after logging compared to after wildfire. Comparisons between clearfell bums in wet eucalypt forest ( eg. Hickey 1994) and clear-cut logging in boreal forest (eg. Nguyen-Xuan et al. 2000; Reich et al. 2001) are made difficult because
clear-cut methods in boreal forest are conducted mostly in winter on snow (to decrease soil disturbance) and are not always followed by regeneration bums.
Little has been conducted on the effects of wildfire or logging on bryophytes in wet eucalypt forest. Of these few studies, most have focused on post logging/burning effects on bryophyte nutrient content, bryophyte regeneration and soil chemistry (Cremer and Mount 1965; Duncan and Dalton 1982; Brasell and Mattay 1984; Brasell
et alA986). Ashton (1986) provides the first major descriptive account ofbryophyte
communities in wet eucalypt forest after disturbance by fire. Only a single preliminary study has described bryophyte species differences between wet eucalypt forest disturbed by wildfire ( old growth forest, > 110 years) and between forest disturbed by logging (Jarman and Kantvilas 1997). In comparison, studies contrasting wildfire and logging affects on vascular plants in wet eucalypt forests are numerous (Cook and Drinnan 1984; Lindenmayer et al. 1990b; Mueck and Peacock 1992; Ough and Ross 1992;
Hickey 1994; Lindenmayer 1995; Chesterfield 1996; Ough 2001; Lindenmayer and McCarthy 2002). Ough (2001) found resprouting shrubs, tree fem and ground-fem species were more abundant in wildfire regeneration than clearfell regeneration. Hickey (1994) stated that it was unknown whether epiphytic fems would recover within the first rotation oflogging and that negative affects on filmy fems might be representative of the possible effects on bryophytes and lichens. The initial vascular species composition following disturbance in these forests largely determines the vascular species
assemblage that will dominate.
Bryophytes in old growth mixed forest
Older stands of mixed forest are termed 'old growth forest'. For the purpose of this study, this definition of old growth mixed forest will be used with the additional criteria that all old growth mixed forest is at least 110 years old without any signs of natural or man made disturbance (Commonwealth of Australia and the State of Tasmania 1996). There are many definitions of old growth forest and summaries can be found in Dyne (1991) and Resource Assessment Commission (1992).
Both aesthetic and biodiversity values of forests have been acknowledged (Franklin et
al. 1981; Brown 1996; Burgman 1996; Norton 1996). In particular, untouched old
forests have been identified as 'important reservoirs of biological diversity' (Lindenmayer and Franklin 1997). Old forests are characterised by an absence of disturbance (human or natural) for a relatively long period. Intervals extend from the last major disturbance and may range from hundreds to thousands of years (Franklin et
al. 1981; Hansen et al. 1991; Scotts 1991). Bryophytes in old wet eucalypt forests of
Australia have been recorded as contributing more to biodiversity than the vascular flora (Brown et al. 1994; Dalton et al. 1999). Ashton (1986) described the habitat
preferences and ecological processes of bryophytes in old wet eucalypt forests of Victoria, giving the first detailed account ofbryophyte ecology in old growth wet eucalypt forests. Little research has been undertaken since.
The bryophyte flora of old forests in the northern hemisphere has been recorded as species rich (Gustafsson and Hallingback 1988; Crites and Dale 1998; Vellak and Paal 1999). Rare liverworts not present in younger forests have been discovered in these older forests and ascribed as a defining feature (Gustafsson and Hallingback 1988; Crites and Dale 1998; Vellak and Paal 1999). Rambo and Muir (1998a) found that an assemblage of bryophytes, either epiphytes on conifers or liverworts on coarse woody debris indicated old-growth forest.
The importance of substrate in forests
1 - Introduction temperate forests are greatest in abundance on coarse woody debris (logs, fallen
branches, stumps, dead trees) and upon vascular species (Longton 1992). Bryophytes on coarse woody debris have been the focus of many studies, particularly in comparing managed and unmanaged forests (Muhle and LeBlanc 1975; Soderstrom 1988b;
Andersson and Hyttebom 1991; McAlister 1997; Cooper-Ellis 1998; Crites and Dale 1998; Kruys and Jonsson 1999; Qian et al. 1999). In Europe, North America and Canada, where many forest stands are heavily managed, coarse woody debris ranges from 2.2 m3 ha-Iin managed stands (Kruys et al. 1999) to 197 m3 ha-I (Linder et al.
1997) in old growth forests. In comparison, multiple logging rotations are rare in Tasmanian wet eucalypt forest and a sizeable volume of coarse woody debris is
available for colonisation(~ 400-1200 m3 ha-I Forestry Tasmania unpublished data;
see also McKenny and Kirkpatrick 1999). Coarse woody debris is an essential
structural feature of wet eucalypt forests and a critical sanctuary for many components of biodiversity (Lindenmayer 2002).
Different properties of vascular plants such as bark pH and bark and soil chemistry affect bryophyte composition (Bates 1992; Gustafsson and Eriksson 1995). Bark properties have also been related to the bryophyte species composition on different tree species, for example Slack (1976) found where there was no change in bark properties with age, there was also no great change in epiphytic assemblages. In mature
Eucalyptus regnans forest, Ashton (1986) studied the species composition of different
substrates (tree trunks, soil patches and rocks) and topographically different areas. In eastern Australian forests, strong differences in bryophyte species composition were found between tree bases, rocks, fallen branches, ground and logs (Pharo and Beattie 2002). Research concerning bryophyte substrates in Australia also includes inventories of bryophytes on vascular plant species (Ashton and McCrae 1970; Jarman and
Kantvilas 1995a; Milne and Louwhoff 1999; Jarman and Kantvilas 2001b; Roberts 2002). These studies found that many different bryophyte species occurred
epiphytically on vascular plants. The survival of epiphytic bryophytes may be negatively affected by a loss of vascular substrates (Ough and Murphy 1996).
Conservation of bryophytes in forests
There is considerable concern regarding the loss of biodiversity in both old growth forest and forests of all ages (Franklin et al. 1981; Hansen et al. 1991; Franklin 1993).
Research by Franklin et al. (1981) in Douglas-Fir forests of northwestern North America established a number of differences between old growth and young boreal forests including structure and species composition. An extensive amount of work since has heightened the importance of biodiversity in these forests (for example see Hansen
et al. 1991; Franklin 1993 ). In assessing bryophyte conservation for the future,
Soderstrom et al. (1992) stressed the detrimental effect forestry practices in Sweden were having on populations of rare species such as the moss Neckera pennata. The authors highlighted the lack of coarse woody debris in forests due to short rotation intervals and the negative effect this was having on the persistence of epixylic, or wood specific, species. They also suggested that protection of endangered species could be achieved by creating reserves inclusive oflarge populations in forest of different
successional stages.
In Australia, there is concern about the lack ofresearch on non-vascular plants in wet eucalypt forests (see reviews by Burgman 1996; Norton 1996). Although, considerable progress has been made on the assessment of conservation status ofbryophytes in Tasmania in all vegetation types (Brown et al. 1994; Moscal et al. 1997), habitat destruction, forestry plantations and land clearing are still prominent threats to the persistence of some species (Scott et al. 1997). Very little research in wet eucalypt forest includes bryophytes, (Ashton 198~; Jarman and Kantvilas 1994; Jarman and Kantvilas 1997; Jarman and Kantvilas 2001a), with even fewer studies including both
bryophyte and vascular species (Blanks 1996; Turner 1996). In Tasmania, vascular flora and vertebrate fauna have played an important part in the reservation of wet eucalypt forests (Commonwealth of Australia and the State of Tasmania 1996). This is primarily because research in these forests has strongly focused on the ecology of
vascular species and forest communities (Gilbert 1959; Jackson 1968; Mount 1979; Hickey 1994). Like non-vascular species, invertebrates and macrofungi have only recently received attention and are generally not considered in conservation of wet eucalypt forests (Michaels 1999; Baker 2000; Bashford et al. 2001; McMullan-Fisher et al. 2002; Packham et al. 2002). Under current management, it is unknown whether
1 - Introduction
Successional processes in forest ecosystems
The long entrenched classical view of succession (Clements 1916) has little application where disturbance, such as fire, is a regular event. Wet eucalypt forest communities after a fire disturbance generally follow the successional model of Egler (1954). In boreal forests, similar successional pathways have been described with fire also a primary disturbance feature (Heinselman 1981; Attiwill 1994a).
A number of factors may affect the ability ofbryophytes to successfully establish after disturbance including severity/intensity of disturbance, competition, substrate
availability (for example coarse woody debris or certain vascular species), propagule availability, plant 'vital attributes' or life histories (Noble and Slatyer 1980) and
environmental conditions. In both boreal and eucalypt forest, similar bryophyte genera are found after a disturbance by fire (Duncan and Dalton 1982; Longton 1992). Post-primary bryophyte succession of regenerating to mature boreal forest communities is well documented (Muhle and LeBlanc 1975; Heinselman 1981; Soderstrom 1988a; Crites and Dale 1998; Jonsson and Esseen 1998; Vellak and Paal 1999; Boudreault et al. 2000; Rambo 2001 ). In these ecosystems information on the vital attributes of
bryophyte species is available (for example see Crum 2001). Vital attributes of rainforest and Eucalyptus species in wet eucalypt forests are largely known (Jackson
1999; Wells and Hickey 1999). Patterns of succession or replacement sequences based on recurrent fire disturbances have been derived for vascular plant species in Tasmanian mixed forest (Noble and Slatyer 1980). Little knowledge exists ofbryophyte species vital attributes in post-primary successional stages of wet eucalypt forest communities.
It is possible that similar successional pathways to those found for vascular plants in wet eucalypt forest may exist for bryophyte species that are associated with these vascular plant species (Crum 2001).
Thesis aims and structure
The main aim of this thesis is to determine the factors that affect bryophyte species richness and composition in wet eucalypt forest within different age classes since two types of disturbance. A survey of wet eucalypt forest of different ages in forests of Tasmania was made to record the presence/absence ofbryophyte and vascular species. Associations between bryophytes and vascular species and bryophytes and site history
were studied regarding substrate variability, forest structure, lifeform and environmental factors.
In Chapter 2, the diversity of old growth mixed forest bryophytes, and relationships between bryophyte species richness, and composition, and the environment are investigated. This chapter addresses the following questions: (a) How variable is species richness and composition of bryophytes, liverworts and mosses between old growth sites? (b) Do species richness and composition of bryophytes, mosses and liverworts respond to the same environmental variables?
In Chapter 3 bryophyte species succession from early aged wet eucalypt forest through to old growth mixed forest is described. Two questions are the focus of the chapter (1) Are any bryophyte species found only in one age class? (2) Is there a temporal
sequence in the appearance and disappearance ofbryophyte species for (a) all sites? (b)
Eucalyptus regnans dominated forest (c) E. obliqua dominated forest?
Chapter 4 describes relationships between the species richness of bryophyte and
vascular plant lifeforms in old growth and regenerating wet eucalypt forest. The use of vascular plants as surrogates for bryophytes in wet eucalypt forest of different ages is investigated through minimum reserve sets and species composition. The following questions are addressed: (1) Are the species richness of mosses, liverworts and
bryophytes as a group, significantly related to the species richness of trees, tall shrubs, short shrubs, non-woody angiosperms, all fems, ground fems, epiphytic fems and all vascular plants? (2) To what degree can vascular species composition be used as a surrogate for bryophyte species composition? (3) Does predictability differ between old growth forest and earlier stages in succession after fire?
Chapter 5 presents the first study to investigate bryophyte species composition and distribution on substrates in different ages of wet eucalypt forest. Previous similar Australian studies (Ashton 1986; Jarman and Kantvilas 2001b; Pharo and Beattie 2002)
,.
1 - Introduction
substrates have species not found in other age classes? (2) are there species that would disappear without a particular substrate or group of substrates? (3) in similar aged forest, is there a difference in species composition between substrates? (4) does the substrate preference of species change between different ages of forest?
The question of whether silvicultural practices imitate natural ecological processes such as fire, is examined in Chapter 6, with the primary focus on bryophytes although
vascular plants are also included. Specifically, these hypotheses are investigated: (1) are the proportion of sites with each bryophyte and vascular species the same for each disturbance type? (2) does species composition of bryophytes and vascular plants differ between disturbance types and if so (3) what environmental variables explain the
variation in species composition between forest types?
Finally, Chapter 7 will discuss the relative significance ofbryophytes and their
ecological role in wet eucalypt forest of different ages since disturbance. The possible impacts of forest management will be reviewed and recommendations for future research and management made.
Each chapter has been written in the format of a journal article, therefore some repetition has been unavoidable. The reader is referred to previous chapters for information where appropriate.
Chapter Two
Bryophyte relationships with environment in Tasmanian old
growth wet eucalypt forest.
Abstract
The species richness and species composition of bryophytes (mosses and liverworts)
was recorded at 33 sites in Tasmanian old growth wet eucalyptforest. A total of 202
bryophytes were recorded, consisting of 115 liverwort and 87 moss species. This
constitutes approximately one third of the total bryophyteflorafor Tasmania. Mean
liverwort species richness per site was higher than moss species richness. Sites of more
southerly latitudes had consistently greater mean richness for both liverwort and moss
species. Three latitudinal bands had significantly different bryophytes species
composition. Multiple regression models found latitude, mean annual temperature and
rainfall of the driest month were positive significant predictors of bryophyte species
richness. Moss species richness was significantly predicted by slope. Liverwort species
richness was predicted by latitude, basal area a/Eucalyptus spp. and basal area of
Dicksonia antarctica Of the environmental variables, mean annual temperature,
altitude, rainfall of the driest month and aspect were most significant in predicting
variation in bryophyte species composition. Latitude was the strongest predictor for the
models of bryophyte and moss species composition and the weakest predictor for
liverwort species composition. The only other predictor in all models was the basal
area o/Dicksonia antarctica It is likely that the strong relationship between bryophyte
species composition and aspect and temperature in the present study is a consequence
of protection from fire. A difference in bryophyte species composition between
latitudinal bands suggests that, as well as significant environmental variables, a priori
geographic boundaries distinguish bryophyte species composition in old growth mixed
forest. To establish
if
there is a distinct biogeographical distribution for some2 - Old growth
Introduction
Studies on the relationships of bryophyte species richness and composition with environmental variables have largely focused on boreal forests of the northern
hemisphere (La Roi and Stringer 1976; Slack 1977; Lee and La Roi 1979b; 0kland and Eilertsen 1994; Wolf 1994; Rey Benayas 1995; Frisvoll and Presto 1997; Ohlson et al.
1997). In Australia, the only similar studies have been undertaken in eucalypt forest of the east coast of New South Wales and wet eucalypt forest of north eastern Tasmania (Pharo and Beattie 1997; Pharo et al. 1999; Pharo and Blanks 2000).
Many studies have included variable~ at a substrate or micro scale and/or a site or macro scale (Lee and La Roi 1979b; 0kland and Eilertsen 1994; Rey Benayas 1995; Vitt et al.
1995; Frisvoll and Presto 1997; Pharo and Beattie 2002). Pharo and Beattie (2002), in modelling bryophyte species composition, demonstrated the value of including
variables that were relevant to different substrates. Models included site variables more often than variables pertaining to a substrate, however these latter variables often appeared as the best predictor variable. Elsewhere, the number•ofuprooted trees was positively correlated with liverwort species richness, and moss species richness was positively correlated with number of deciduous trees (Frisvoll .and Presto 1997). In Canadian boreal forests, substratum diversity was highest in forest communities and species richness was positively correlated with the number of substrates per stand (Lee and La Roi 1979b ). Bryophyte species richness was positively correlated with number of substrate types per stand in wet eucalypt forest of northeast Tasmania (Pharo and Blanks 2000).
Many studies have found that altitude is an important environmental control on
bryophyte species richness and composition. In the montane forest of British Columbia, bryophyte species richness was negatively correlated with altitude (Rey Benayas 1995). Ohlson (1997) found a similar relationship existed for bryophyte, moss and liverwort species richness in rare old growth swamp forests of northern Sweden. In contrast, bryophyte species richness is strongly positively correlated with altitude in boreal forest of the Canadian Rockies (Lee and La Roi 1979b). In non-forest vegetation, similar positive relationships between bryophyte species richness and altitude have been found (Gould and Walker 1999). For bryophyte species composition, altitude was a minor but
significant variable in describing bryophyte variation in lowland coastal forests of eastern Australia (Pharo and Beattie 1997) and an important variable in Canadian boreal forests (Lee and La Roi 1979a; Bradfield and Scagel 1984). Associated with altitude, temperature has also been found to be significantly negatively correlated with bryophyte species richness (Vitt et al. 1995). Aspect has been found to affect bryophyte species richness, with a greater number ofliverwort species found on less exposed slopes (Soderstrom 1981).
Nutrients are thought to be more important for vascular plants than for bryophytes and
as such, affect the composition of vascular plants more than bryophytes (0kland and Eilertsen 1994). Bryophytes respond to pH gradients, whereas vascular plants follow nutrient gradients (Vitt and Chee 1990). For example, bryophyte species richness was positively correlated with pH in the peatlands of North America (Glaser et al. 1990).
This study is the first to record the diversity of old growth wet eucalypt forest
bryophytes, and to investigate relationships between bryophyte species richness, and composition, and the environment. In particular the following questions are addressed: (a) How variable is species richness and composition ofbryophytes, liverworts and mosses between old growth sites? (b) Do species richness and composition of bryophytes, mosses and liverworts respond to the same environmental variables?
Materials and Methods
Study area
Data were collected from 33 sites (Figure 2.1), 27 of which were sampled earlier by Hickey and Savva (1992) in a vasculru: plant study. These original 27 sites were not permanently marked but were approximately relocated using grid references. Six of the original sites had been clearfell logged since 1992 and alternative sites were found using the methods of Hickey (1994). Selection of alternative sites was from Forestry
2 - Old growth
defined by, geographic separation, eucalypt dominance, vascular species composition and geology. Sites of northern Tasmania are dominated by Eucalyptus obliqua and E.
brookeriana. The geology is principally siliceous including siltstone and mudstone,
with some areas on the argillaceous rock, basalt. In the central forest E. regnans is dominant with occasional E. obliqua as a co-dominant. The geology of this area is predominantly siliceous rocks (mudstone and siltstone) with limestone also. The southern forests were dominated by E. obliqua with E. delegatensis or E. regnans
[image:26.528.53.480.316.576.2]sometimes co-dominating. The geology of the southern forests is mainly igneous (dolerite). Mean annual temperature ranges from 6.1 to 12.1 °C (average 9.95 ± 0.3 °C) and mean annual rainfall is from 1147 to 2104 mm (average 1502.21 ± 26.593 mm). Site characteristics are given in Table 2.1 and Appendices 8.1 and 8.2.
Table 2.1. Environmental variables for old growth mixed forest sites.
Variable Mean± SE Range
Latitude (0east) 42.105471 ± 0.15 41.0388 - 43.24095
Altitude (m) 298.18 ± 31.37 40.00 - 633.00
Aspect (0 ) 180.62 ± 15.34 18.30 - 350.00
Mean annual temperature (0C) 9.95 ± 0.30 6.10-12.10
Mean annual rainfall (mm) 1502.21 ± 26.59 1147.00- 2104.00
Rainfall driest month (mm) 70.18 ± 1.51 55.00 - 94.00
Slope(°) 9.29 ± 1.19 1.30-25.70
pH 5.11 ± 0.14 3.50-6.50
Total Nitrogen(% dry weight) 0.37 ± 0.04 0.15- 1.07
Available Phosphorus (ppm) 14.6 ± 3.47 1.83 - 108.05
% Cover of above ground substrates 19.71 ± 0.92 11.29 - 30.19
% Canopy cover 83.44 ± 1.41 57.43 - 97.21
Number of substrate types per site 13.24 ± 0.61 7.00-20.00 Basal area of Eucalyptus spp. (m2ha-1) 8.30 ± 0.89 0.67-22.67 Basal area ofrainforest species (m2 ha-1) 24.63 ± 1.49 8.00-40.67 Basal area of Dicksonia antarctica (m2 ha-1) 13.32 ± 2.05 0.00-42.67 Basal area of dead trees (m2 ha-1) 0.81 ± 0.29 0.00- 8.67
•
•
•
•
•
•
[image:27.528.71.488.17.693.2]50
Figure 2. I. Location of old growth mi-Xed forest sites in Tasmania. 0
• Central
• Northern
• Southern
N 50 km
2 - Old growth
Vegetation sampling
Fieldwork was undertaken from October 1999 to February 2000 and October 2000 to March 2001. A transect of 25 x 2 m was surveyed for bryophytes within homogenous old growth forest of southern Tasmania at Warra Long Term Ecological Research site (Brown et al. 2001) to determine an appropriate quadrat size. The species area curve tapered off at an area of 3 7 .5 m2 (Figure 2.2) with one additional area not adding new species. To ensure a greater chance of finding all species representative of the forest area, three transects each 25 x 2 m were surveyed at each site in homogenous forest. These were placed subjectively to cover the perceived heterogeneity of microhabitats, because although the forest proper may be homogenous, microhabitats may not.
Furthermore, if a substrate was not found inside the sampling area, it was sought outside to a distance of 10 m (Pharo and Blanks 2000). At each site, the forest was sampled for the presence/absence ofbryophytes and vascular plants using these three transects, 25 m x 2 m. All sampling was done from ground level. Epiphytic substrates were sampled along their length up to 2 m above ground level. This was considered to be a reasonable limit for ground-based surveying. Fallen branches were sampled to include canopy flora. If a substrate was not found within the sampling area, it was sought for within 10 m outside of the sampling area. Transects were located at a distance > 50 m from the road edge. Occasionally patches within sites were unsuitable because there was light selective logging or no bum scars from wildfire. A site was then sought by continuing further into the forest. Each transect was placed perpendicular to the slope. Presence/ absence data from the three transects per site were pooled to calculate site values. Nomenclature follows Dalton et al. (1991) for mosses, Ratkowsky (1987) for liverworts and Buchanan (1999) for vascular plants except where authorities are given.
50.0
fJ'J fJ'J
(1.)
..@ 40.0
(.)
·i::
fJ'J
(1.)
...
(.)(1.)
0.. 30.0
fJ'J
(1.)
]'
0..
~
20.0~
~
...
~
-
~
10.0 (.)
(.) ro
0.0
0.0 12.5 25.0 37.5 50.0
[image:29.529.61.451.90.388.2]m2
Figure 2.2. Species accumulative species richness curve for bryophytes in homogenous old growth mixed forest.
Environmental variables
62.5
Environmental measurements were recorded from each of the three transects. A single value for each site was used for latitude (0) , geology, mean annual temperature '{°C),
mean annual rainfall (mm), rainfall of the driest month (mm), total nitrogen (%dry soil weight), available phosphorus (ppm) and the number of substrates per site. A mean value was used for remaining variables; aspect (0 ), slope (0 ), pH, altitude (m), % canopy
cover, % cover of above ground substrates and basal area of: rainforest trees (as defined by Jarman et al. 1991) (see Appendix 8.3); Eucalyptus spp.; Dicksonia antarctica, and dead trees (m2 ha-1, Bitterlich wedge method, Mueller-Dombois and Ellenberg 1974). Details of variable ranges are given in Table 2.1.
2-0ld growth
Mean annual temperature, mean annual rainfall and rainfall of the driest month were predicted by the BIOCLIM part of the ANUCLIM package (Centre for Resource and Environmental Studies 1999). BIOCLIM is a computer-based technique known collectively as the Bioclimatic Prediction System that generates predictions of climatic attributes from existing climatic data and interpolation based on distance and altitude. It produces a set of indices at any specified latitude, longitude and altitude that are
considered to have biological significance and that summarise annual and seasonal mean conditions, extreme values and intra-year seasonality (Nix 1986). Mean annual temperature and mean annual rainfall is the mean of all the weekly mean temperatures and rainfall respectively. Each weekly mean temperature/rainfall is the mean of that week's maximum and minimum temperature.
After removing obvious litter and other plant material from the soil surface, samples of 5 x 5 x 5 cm3 were taken at each end and the middle of transects. These samples were then bulked per site and air-dried. Once dry, soils were coarsely sieved to remove root, stones and litter material, and then soils were further sieved to pass through 0.5 mm. Soil was analysed for available phosphorus using the Bray fluoride extractable method and for total nitrogen using Kjeldahl method (Jackson 1958).
Aspect was recorded in degrees and later grouped into 5 classes (1
=
northwest, 2=
north or west, 3 = northeast of southwest, 4 = east or south, 5 = southeast). Slope was measured in degrees from the horizontal using a clinometer from the centre of each transect.
pH was measured at each transect with a Manutec Soil pH test kit, which measures pH on a logarithmic scale ranging from zero to fourteen with intervals of0.5. The three pH values for a site were converted to hydrogen ion concentration, and the mean calculated. The mean was reconverted and rounded to the nearest 0.5 for agreement with the
original scale interval.
Canopy cover was calculated using a photo taken in the centre of each transect with immediate obscuring vegetation removed. Each photo was taken with the maximum focal length (30 mm-80 mm) and at a constant height (1.7 m). At a threshold value for each negative, percentage canopy cover was recorded as the number of dark pixels within a centred circle on the negative.
Above ground substrates included vascular plant species, logs (greater than 10 cm diameter), fallen branches (less than 10 cm diameter), rocks, roots, dead trees, stumps, upturned root bases and Dicksonia antarctica (Treefems ). Treefems were recorded in
three states; alive (vertical stands only), fallen (horizontal and dead) or stumps (vertical and dead).
Analysis
A total of 76 vascular plant species were recorded from the 33 sites. The significance of variation in vascular species composition between latitudinal bands was tested using an Analysis of Similarities (ANOSIM, Clarke 1993), using DECODA (Minchin 1990, 1000 permutations). ANOSIM considers the differences in floristics between groups of samples and compares those differences with those found within groups. ANOSIM constructs a test statistic (R). This statistic is a valuable measure of the degree of separation of sites. The denominator is such that R can never lie outside the range -1 to 1. If R = 1 then all quadrats within groups are more similar to each other than any quadrats from different groups and ifR = 0, then the null hypothesis is true, the
dissimilarities between and within groups will be the same on average. It is possible for R to be significantly different from zero yet inconsequentially small, ifthere are many quadrats at each site (Clarke 1993). Values smaller than zero indicate greater
dissimilarity among samples within groups than between groups. The significance of R was calculated by comparing the test statistic to 1000 random permutations. The significance levels of pairwise tests are not adjusted by ANOSIM to consider multiple compansons. Values of 'p' falling close to 0.05 should be interpreted with care (Clarke 1993).
Species richness
2 - Old growth
of rainforest species, were log transformed to satisfy normality requirements.
Colinearity of variables was checked using Pearson's product moment correlation co-efficient (Sokal and Rohlf 1995).
Species composition
The indirect ordination method, non-metric multidimensional scaling (NMDS) was used to produce ordinations ofbryophyte, moss and liverwort species composition for 33 old growth sites (DECODA, Minchin 1990) using the recommended Bray-Curtis
dissimilarity co-efficient (Faith et al. 1987). The NMDS ordinations were performed in 1 to 4 dimensions using 10 different random initial configurations. A plot of stress versus the number of dimensions was used to select the dimension that adequately reflected the differences in species compositions among samples. Three-dimensional ordinations were selected. The significance of variation in bryophyte, moss and liverwort species composition between latitudinal bands was then tested using an Analysis of Similarities (ANOSIM, Clarke 1993), using DECODA (Minchin 1990,
1000 permutations).
Relationships between bryophyte, moss and liverwort species composition and non-transformed environmental variables were explored initially using vector fitting (Kantvilas and Minchin 1989). The technique maximises the linear correlation of a given variable within the ordination. The length of the line from the zero origin to the co-ordinates for the variable depicts the strength of the relationship with species composition. The significance of the relationship was tested using permutation (1000 permutations). Trends in species composition along the vector with the highest
correlation for each ordination are summarised by initially excluding species occurring in less than 5 sites and then calculating the percentage frequency of remaining species within 10 contiguous segments along the vector. Condensed ordered tables were produced. The order of species is defined by their weighted average along the vector using DECODA (Minchin 1990).
Environmental variables were further related to variation in bryophyte, moss and
liverwort species composition using the direct ordination method, Redundancy Analysis (RDA) also known as reduced rank regression (ter Braak and Prentice 1988). RDA was used because species responses to environmental variables were presumed to be
monotonic (not linear). NMDS assumes a monotonic relationship between ordination
distance and compositional dissimilarity. RDA finds the environmental variables that explain most of the variance in the species scores on each axis by applying multiple regression. The analysis was performed using CANOCO 4.0 (ter Braak 1991). NMDS ordination scores for each three dimensional axis were entered as dependant variables (species data) with environmental variables entered as the independent variables. Forward selection of variables was used where, once the variable explaining the most variance was added first to the model, the fit and significance of remaining variables were assessed and significant variables added in turn. Significance of the
environmental variables was tested using 1000 random permutations with a= 0.05. Eigenvalues show the variance in species scores explained by the environmental variables (scaling 1 in CANOCO 4.0). The percentage variance in species data explained by each variable was calcul~ted by dividing the variance in species data accounted for by each variable by the total variance (ter Braak 1991).
Results
ANOSIM found significant differences in vascular species composition among latitudinal bands (R = 0.44, p < 0.000) and between latitudinal bands (Northern -Southern, R = 0.48; Northern - Central, R = 0.43; Southern - Central, R = 0.43; all
pairwise tests p < 0.000).
Species richness
A total of202 bryophyte taxa were recorded from the 33 old growth sites. This
included 87 moss and
l
15 liverwort species. Six species occurred at all sites: Bazzania involuta, Lepidozia ulothrix, Teleranea patentissima, Dicranoloma menziesii,Ptychomnion aciculare and Rhapidorhynchium amoenum. Seventeen mosses and
fourteen liverworts were recorded only once. The range of species richness for bryophytes was 50 - 110, with the range for moss and liverwort species being 18 - 46 and 24- 64 respectively. Mean species richness for bryophytes was 66.12 ± SE 2.15 with mean species richness of mosses being lower than that for liverworts (27.91 ± SE 0.92 and 38.21 ± SE 1.76 respectively).
2-0ld growth
liverworts, which contributed most to total bryophyte species richness. Moss species richness did not differ significantly between latitudinal bands.
Table 2.2. Summary of bryophyte, moss and lzverwort species richness and species totals in each latitudinal band. ANOVA was used to compare the mean species richness. Tukeys test was used to denote different means at the 95% confidence interval, indicated by differing superscripts. p value> 0.05 is not significant (ns). Total number ofbryophytes =
202 species (87 moss and 115 liverwort species).
Latitudinal Total Mean Standard Minimum Maximum p band number species error species species value
of richness richness richness
species
Bryophyte Central 138 61.00A 2.60 50 77 0.000
Northern 150 60.87A 1.31 53 72
Southern 166 82.38B 4.50 73 110
Moss Central 65 28.80 1.33 23 38 ns
Northern 59 25.87A 0.77 18 29
Southern 66 30.63A 2.92 19 46
Liverwort Central 73 32.20A 1.97 24 42 0.000
Northern 91 35.00A 1.61 28 50
Southern 100 51.75B 2.70 41 64
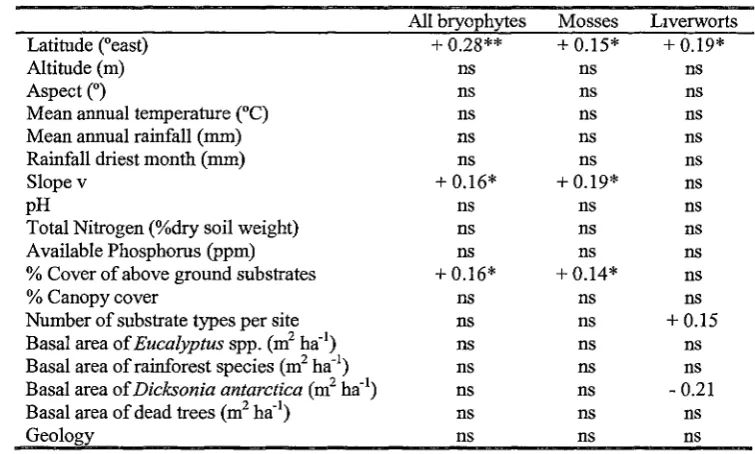
Three variables were significantly positively correlated with bryophyte species richness: latitude, slope and percentage cover of above ground substrates (Table 2.3). These three variables were also significantly positively correlated with moss species richness.
Liverwort species richness was positively correlated with latitude, number of substrate types per site, and negatively correlated with basal area of Dicksonia antarctica. In the
multiple regression models, latitude, mean annual temperature and rainfall of the driest month were all positively related to bryophyte species richness (y = -799 .00 + 17 .10 X latitude+ 8.75 X mean annual temperature+ 0.85 X rainfall of the driest month; r2 = 0.53, d.£ = 32, F = 10.69, p = 0.000). Only slope was positively related to moss species richness (Table 2.3). Liverwort species richness was positively related to latitude, and negatively related to basal area of Eucalyptus spp. and basal area of Dicksonia
antarctica (y = - 133.00 + 4.23 X latitude-1.32 X basal area of Dicksonia antarctica
-10.60 X basal area of Eucalyptus spp.;
r2
= 0.46, d.f. = 32, F = 8.34, p = 0.000). Soil variables (pH, available phosphorus and total nitrogen) did not contribute in the explanation of variation in species richness ofbryophytes, mosses or liverworts.Table 2.3. Variance explained (r2) by environmental variables for bryophyte, moss and liverwort species richness. Positive or negative signs indicate the relationship. * p < 0.05, ** p < 0.01, *** p < 0.001, ns = not significant.
All bryophytes Mosses Liverworts
Latitude (°east) + 0.28** + 0.15* + 0.19*
Altitude (m) ns ns ns
Aspect(°) ns ns ns
Mean annual temperature (0C) ns ns ns
Mean annual rainfall (mm) ns ns ns
Rainfall driest month (mm) ns ns ns
Slope v + 0.16* + 0.19* ns
pH ns ns ns
Total Nitrogen (%dry soil weight) ns ns ns
Available Phosphorus (ppm) ns ns ns
% Cover of above ground substrates + 0.16* + 0.14* ns
% Canopy cover ns ns ns
Number of substrate types per site ns ns + 0.15
Basal area of Eucalyptus spp. (m2 ha-1) ns ns ns
Basal area ofrainforest species (m2 ha-1) ns ns ns
Basal area of Dicksonia antarctica (m2 ha-1) ns ns - 0.21
Basal area of dead trees (m2 ha-1) ns ns ns
Geology ns ns ns
Species composition
The three-dimensional ordinations for bryophyte, moss and liverwort species composition, with the vectors fitted for environmental variables with significant correlation are shown in Figure 2.3. The ordinations suggest there is differentiation of bryophyte species composition by latitudinal band. ANOSIM found significant
2 - Old growth
temperatures. Iri. addition, at cooler latitudes, slopes influence moss species composition and number of substrates types available for colonisation.
Bryophyte species composition along the vector of mean annual temperature is presented in Table 2.5. Species range from lower temperatures (for example,
Chandonanthus squarrosus and Distichophyllum species) through to medium
temperature (Radula tasmanica, Teleranea centipes and Brevianthus flavus) to higher temperature species (Macromitrium microstomum, Fissidens taylorii and Papillaria
flavo-limbata ).
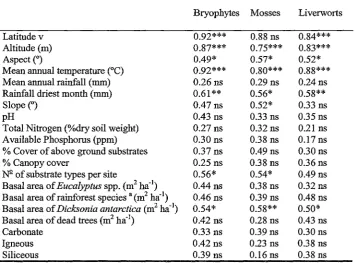
RDA analyses and the vector fitting procedure produced similar results. Latitude, altitude, aspect, mean annual' temperature, rainfall of the driest month, and basal area of
Dicksonia antarctica were significant in explaining bryophyte and liverwort species
composition (Table 2.6). The number of substrates per site was also significant for bryophyte and moss species composition. Slope and % cover of above ground
substrates were also significantly correlated with variation in moss species composition.
Latitude was the strongest predictor for the models of bryophyte and moss species composition. It was the we~est predictor for liverwort species composition. The only other predictor in all models was the basal area of Dicksonia antarctica. pH was · included for the models of bryophyte and liverwort species composition. Eigenvalues
were similar for bryophyte, moss and liverwort species composition (bryophyte: axis 1
= 0.372, axis 2 = 0.284, axis 3 = 0.193; moss: axis 1 = 0.404, axis 2 = 0.254, axis 3 =
0.199, liverwort: axis 1 = 0.341, axis 2 = 0.293, axis 3
=
0.120).Bryophytes
axis 1
(b)
[image:37.528.102.405.92.607.2]axis 1
Figure 2.3. Three-dimensional bryophyte, moss and liverwort ordinations of sites in old growth mixed forest, (a - b) bryophytes stress= 0.1547, (c - d) mosses stress= 0.177, (e-f), liverworts stress= 0.146.
Latitudinal bands: N = Northern, C = Central, S = Southern. Vectors with significant correlation with the ordination are shown: aspect, latitude, mean annual temperature (temperature), rainfall of the driest month (raindry), altitude, number of substrate types per site (subs/site), slope, % cover of above ground substrates(% subcover) and basal area ofDicksonia antarctica (BAtreefern).
*
p < 0.05,**
p < 0.01,Mosses
temperature***
aspect**
slope* %subcover*
axis 1
slope*
axis I
raindry* altitude***
atitude***
sun site*
(d)
2 Old growth
Liverworts
BAtreefern*
temperature***
aspect*
temperature*** C
s
N
gS
axis 1
C
C
axis 1
N
N N
N
sS
(e)
latitude***
altitude***
2 - Old growth
Table 2.4. Vector results for ordination of old growth mixed forest. R value for environmental vectors. * p < 0.05, ** p < 0.01, *** p < 0 001, ns = not significant.
Bryophytes Mosses Liverworts
Latitude v 0.92*** 0.88 ns 0.84***
Altitude (m) 0.87*** 0.75*** 0.83***
Aspect (0 ) 0.49* 0.57* 0.52*
Mean annual temperature (°C) 0.92*** 0.80*** 0.88*** Mean annual rainfall (mm) 0.26 ns 0.29 ns 0.24 ns
Rainfall driest month (mm) 0.61 ** 0.56* 0.58**
Slope (0 ) 0.47 ns 0.52* 0.33 ns
pH 0.43 ns 0.33 ns 0.35 ns
Total Nitrogen (%dry soil weight) 0.27 ns 0.32 ns 0.21 ns Available Phosphorus (ppm) 0.30 ns 0.38 ns 0.17 ns % Cover of above ground substrates 0.37 ns 0.49 ns 0.30 ns
% Canopy cover 0.25 ns 0.38 ns 0.36 ns
N2-of substrate types per site 0.56* 0.54* 0.49 ns Basal area of Eucalyptus spp. (m2 ha-1) 0.44 ns 0.38 ns 0.32 ns
Basal area of rainforest species a (m2 ha-1) 0.46 ns 0.39 ns 0.48 ns
Basal area ofDicksonia antarctica (m2 ha-1) 0.54* 0.58** 0.50*
Basal area of dead trees (m2 ha-1) 0.42 ns 0.28 ns 0.43 ns
Carbonate 0.33 ns 0.39 ns 0.30 ns
Igneous 0.42 ns 0.23 ns 0.38 ns
Siliceous 0.39 ns 0.16 ns 0.38 ns
a rainforest species as defined in (Jarman et al. 1991), (see Appendix 8.3).