Int. J. Electrochem. Sci., 7 (2012) 6221 - 6233
International Journal of
ELECTROCHEMICAL
SCIENCE
www.electrochemsci.org
Optimization of Direct 2-propanol Fuel Cell Performance Using
Statistical Design of Experiments Approach
Arfat Anis*, S. M. Al-Zahrani, F. A. Abd El Aleem
Dept. of Chemical Engineering, King Saud University, P.O. Box - 800, Riyadh 11421, Saudi Arabia *
E-mail: [email protected]
Received: 24 May 2012 / Accepted: 12 June 2012 / Published: 1 July 2012
Direct alcohol fuel cells have been attracting enormous research interest as power sources for vehicles and portable electronic devices because alcohols are readily available, their storage and transport can be easily handled with the existing fuel infrastructure, and they commonly have high mass-specific and volumetric energy densities. Methanol is the most studied fuel for direct alcohol fuel cells because methanol is readily available, it is structurally simple, and has a promising electrochemical activity. However, several research groups have also reported the use of 2-propanol as a promising fuel. The potential advantages of utilizing 2-propanol as fuel are many such as it is relatively less toxic compared to other alcohols, at low potentials it is less prone to anode poisoning, and it has better resistance to crossover and cathode poisoning. The performance of the fuel cell for a particular catalyst system is related to the cell conditions such as 2-propanol concentration, anode and cathode fuel flow rates, cell temperature and oxidant back pressure. This study was designed to study the effect of the different cell operation conditions at three different levels and the interactions between these components by response surface methodology (RSM). We observed that the power density of the cell increased with increase in molar concentration of 2-propanol and cell operation temperature, the optimized conditions for the highest power density of 45 mW/cm2 by the RSM was found to be 1.5 M 2-propanol concentration, 80 oC cell temperature, 9.22 ml/min 2-propanol flow rate, 596 ml/min oxygen flow rate and no back pressure for the oxidant, this is from amongst one of the best results reported in literature for direct 2-propanol fuel cell performance.
Keywords: 2-propanol fuel cell, direct alcohol fuel cell, fuel cell optimization, statistical analysis
1. INTRODUCTION
hydrogen [1], the produced hydrogen ions travel through the polymer electrolyte to the cathode where either oxygen or acetone can be used as an oxidant to produce water or 2-propanol respectively while the electrons travel through the external electrical circuit to the cathode to produce electrical power.
Demirci [2] reviewed the literature available on different direct liquid fuel cells with special focus on the thermodynamic-energetic data and the toxicological-ecological hazards of the chemicals used as liquid fuels. The analysis showed that boro-hydride, ethanol and 2-propanol even though inferior compared to hydrogen would be the most adequate liquid fuels for the polymer electrolyte membrane fuel cell type systems.
Methanol, ethanol and 2-propanol have very good energy density which is quite close to that of hydrocarbons and gasoline (i.e. 10-11 kWh/kg) [3]. Wang et al. [4] evaluated ethanol, 1-propanol and 2-propanol as alternative fuels for DMFC by using Pt-Ru and Pt-black catalysts. They found that the main products of ethanol oxidation were acetaldehyde and CO2, for 1-propanol, propanal and CO2 whereas the main by-products of 2-propanol oxidation were 2-propanone and negligible amounts of CO2. Qi et al. [5] reported the operation of 2-propanol fuel cell using Pt-Ru and Pt blacks as anode and cathode catalysts, respectively, Nafion 112 as membrane electrolyte, and with air at the cathode. Their D2PFC showed much higher performance than direct methanol fuel cell, especially at current densities less than 200 mA/cm2. This performance was the highest among any direct-liquid-oxidation fuel cells. The open circuit voltage of the D2PFC was 0.27 V higher than that of the methanol fuel cell and at the same time the amount of 2-propanol crossover through the membrane was 1/7 of that of methanol. Therefore it is anticipated that a direct 2-propanol fuel cell can have much higher efficiencies than methanol fuel cell. Since 2-propanol performs better in the low current density region, while methanol does better in the high current density region, the authors tested a mixture of 2-propanol and methanol expecting to find if they have any synergistic effect but they found that the performance was worse than when tested individually over the entire current density region.
Bergens et al. [6-8] and some other groups [9-13] also studied 2-propanol as an alternative to methanol and ethanol in alkaline direct alcohol fuel cells (ADAFCs). A substantial current maximum occurred at low potentials and was attributed to a change in the mechanism of 2-propanol oxidation; dehydrogenation of 2-propanol to acetone occurs at low potentials and a slower oxidation to form CO2 occurs at higher potentials. Unlike carbon dioxide, formic acid and acetic acid, acetone does not undergo irreversible stoichiometric side reactions with hydroxide and thus does not require added base. In 3-electrode experiments, the platinum catalyzed electro-oxidation of 2-propanol to acetone provides relatively high stabilized current densities at low anode potentials [7]. The activity of platinum at these potentials is enhanced by nickel [6] or ruthenium [8]. Over palladium, the apparent activation energy for 2-propanol oxidation is lower than ethanol at moderate potentials [10], and its activity is enhanced by gold [9] or platinum [11]. A prototype alkaline direct 2-propanol fuel cell (AD2PFC) operating with commercial platinum electrodes and a liquid electrolyte gave a maximum power density of 22.3 mW/mg Pt and most of the cell polarization occurred at the cathode.
about 1.5 times that of methanol with respect to the same weight or volume if it is oxidized to CO2 completely. Therefore, fuel cells using 2-propanol as the fuel would be more compact and practical than using methanol for portable power applications.
2. EXPERIMENTAL SETUP
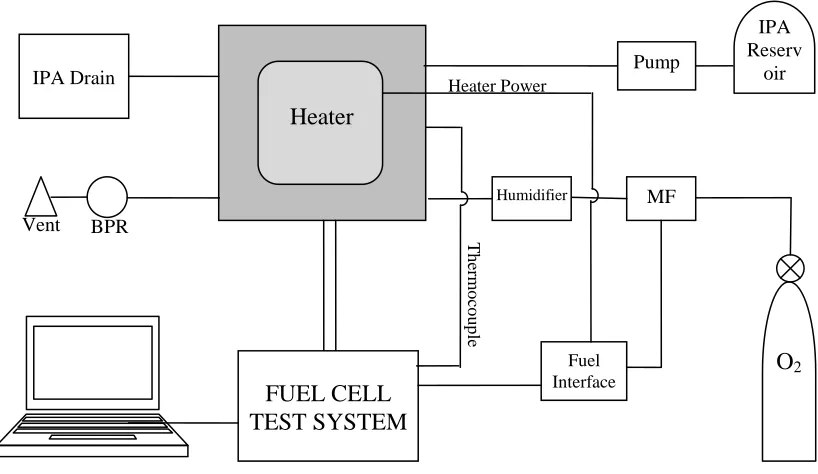
A 25 cm2 MEA was obtained from Electrochem Inc., USA with Nafion 117 PEM, anode and cathode loading of 4 mg Pt-Ru/cm2 and 1 mg Pt/cm2 respectively. Electrochem 25 cm2 fuel cell hardware was used for the tests. Aqueous solutions of 2-propanol (WINLAB, UK, Spectroscopic grade) was pumped through the anode flow field using a Gilson Minipuls 3 peristaltic pump at zero back pressure and the 2-propanol solution was not recycled back to the fuel reservoir. The gas flow was regulated using a MKS mass flow controller interfaced to the fuel cell software at different back pressures set manually. Ultrapure Oxygen was humidified using a bubble humidifier maintained at 80 o
[image:3.596.95.504.366.603.2]C before being supplied to the cathode. A schematic diagram of the experimental setup is shown in Fig. 1.
Figure 1. Schematic Diagram of the Fuel Cell Test Setup (IPA- 2-propanol, MFC-Mass Flow Controller, BPR- Back Pressure Regulator)
The polarization (or current-voltage) curve is the most commonly used indicator of fuel cell performance. The most common data collection mode to obtain the polarization curve is by adjusting the current density and then recording the cell voltage. After collecting a series of current and voltage values, the cell voltage is plotted as a function of the current density. After obtaining the polarization curve, the MEA power density(cell voltage x current density) can be plotted as a function of current
Heater Power
Th
erm
o
co
u
p
le
Vent BPR
O2
MF C
Humidifier Fuel Cell
IPA Reserv
oir Pump
IPA Drain
FUEL CELL TEST SYSTEM
Fuel Interface
density to get the maximum power density of the fuel cell MEA, the maximum volume power density and the mass power density can be obtained as well [14].
A Scribner Associates 890e Fuel Cell Test System was used for controlling the process parameters and data acquisition. The test system consists of fuel control system, fuel cell, load bank, data acquisition/control unit and control software [14].
The polarization curves were obtained using the 890e computer-controlled fuel cell test load and all reported cell potentials were IR compensated. The voltage-current polarization data were recorded from zero current (open circuit) to high currents in 0.05A current increments. The current was held for 30 s after each increment before the cell voltage was recorded.
2. EXPERIMENTAL DESIGN
Experimental designs by response surface methodology (RSM) are useful to obtain necessary information’s and determine the optimum conditions for a process. Response surface methodology (RSM) uses statistical techniques based on special factorial designs [15]. A Box-Behnken design with 5 independent variables at 3 different levels and six replicates at center point was employed in this study. It is a scientific approach to determine the optimum conditions by using combination of special experiments. RSM has a group empirical technique devoted to the identification of correlation among experimental factors and the measured response [16-18]. Design Expert 7 program was utilized for regression analysis of the data obtained and was useful for estimating the coefficients of the regression equation. The maximum values of power density were taken as the response of the design experiments. The statistical analysis of the model was performed in analysis of variance (ANOVA). For each variable, the quadratic models were represented by 3D plots.
3. RESULTS AND DISCUSSION
Table 1. Design Summary
Factor Name Units Low Actual High Actual Low Coded High Coded
A IPA Molar Conc. moles/liter 1 3 -1 1
B Cell Temperature Celsius 40 80 -1 1
C IPA Flow Rate ml/min 5 15 -1 1
D O2 Flow Rate ml/min 200 600 -1 1
E O2 Back Pressure PSI 0 2 -1 1
Response Name Units Obs Analysis Minimum Maximum
Y1 Power Density mW/cm2 46 Polynomial 16.982 44.732
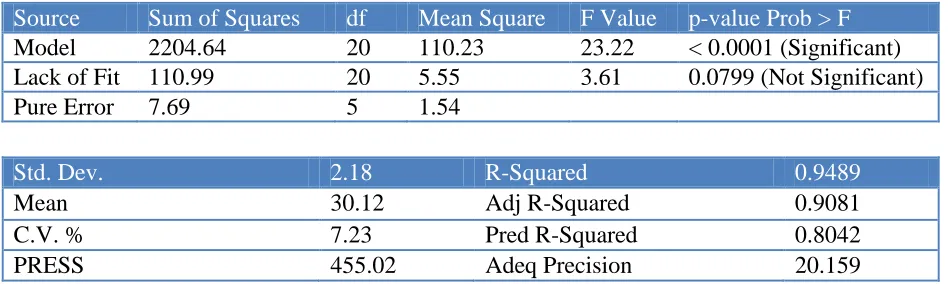
Table 2. ANOVA for Response Surface Reduced Quadratic Model
Source Sum of Squares df Mean Square F Value p-value Prob > F
Model 2204.64 20 110.23 23.22 < 0.0001 (Significant)
Lack of Fit 110.99 20 5.55 3.61 0.0799 (Not Significant)
Pure Error 7.69 5 1.54
Std. Dev. 2.18 R-Squared 0.9489
Mean 30.12 Adj R-Squared 0.9081
C.V. % 7.23 Pred R-Squared 0.8042
PRESS 455.02 Adeq Precision 20.159
The model F-value of 23.22 implies that the model is significant and there is only a 0.01% chance that a value this large could occur due to noise. The values of "Prob > F" less than 0.05 indicate model terms are significant. In this case A (Molar Conc.), B (CellTemperature), B2 (Cell Temperature)2, E2 (O2 Back Pressure)2 are significant model terms. Values greater than 0.1 indicate the model terms are not significant. The "Lack of Fit F-value" of 3.61 implies there is a 7.99% chance that a "Lack of Fit F- value" his large could occur due to noise.
The "Pred R-Squared" of 0.8042 is in reasonable agreement with the "Adj R-Squared" of 0.9081. "Adeq Precision" measures the signal to noise ratio. A ratio greater than 4 is desirable our ratio of 20.159 indicates an adequate signal and hence this model can be used to navigate the design space.
[image:5.596.63.537.311.453.2]
measure of the goodness of the model, indicated that 80 % of the variability in the response could be explained by the model. The coefficient of variation (CV) shows the degree of precision with which the treatments were compared, high value of CV is due to the low reliability of experiment. Here the CV value of (= 7.23%) indicates a high reliability in the experiments.
Design-Expert® Software Power
Color points by value of Power:
44.732
16.982
Internally Studentized Residuals
No
rm
a
l
%
Pr
o
b
a
b
ilit
y
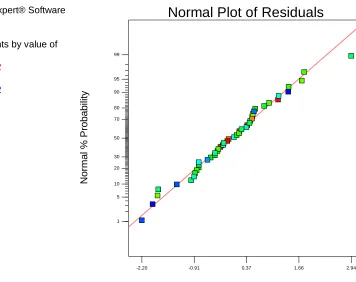
Normal Plot of Residuals
-2.20 -0.91 0.37 1.66 2.94
1 5 10 20 30 50 70 80 90 95 99
Figure 2. Diagnostic plot of the ANOVA - Normal probability plot of the internal standardized residual plots
[image:6.596.125.481.173.455.2]
Design-Expert® Software Power
Color points by value of Power:
44.732
16.982
Actual
Predicted
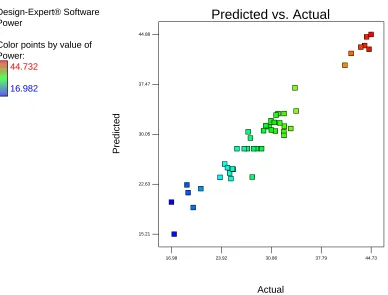
Predicted vs. Actual
15.21 22.63 30.05 37.47 44.88
16.98 23.92 30.86 37.79 44.73
Figure 3. Diagnostic plot of the ANOVA - Predicted values by response model versus experimental data
The response surface plots provide a method to predict response for different values of the test variables and the contours of the plots help in identifying the type of interaction among test variables. The 3D-mesh contour was plotted for power density, which was obtained from the calculated response surface. Each 3D plot represents an infinite number of combinations of the two test variables with the other three maintained at a particular fixed level.
[image:7.596.97.485.81.376.2]
Design-Expert® Software
Power
Design points above predicted value Design points below predicted value 44.732
16.982
X1 = A: Molar Conc. X2 = B: Cell Temperature
Actual Factors
C: IPA Flow Rate = 10.00 D: O2 Flow Rate = 400.00 E: O2 Back Presuure = 1.00
1.00 1.50
2.00 2.50
3.00
40.00 50.00 60.00 70.00 80.00
15 22.5 30 37.5 45
Pow
er
A: Molar Conc. B: Cell Temperature
Figure 4. Effect of Cell Temperature and Molar Concentration of 2-propanol on power density
Design-Expert® Software
Power
Design points above predicted value Design points below predicted value 44.732
16.982
X1 = A: Molar Conc. X2 = C: IPA Flow Rate
Actual Factors
B: Cell Temperature = 60.00 D: O2 Flow Rate = 400.00 E: O2 Back Presuure = 1.00
1.00 1.50
2.00 2.50
3.00
5.00 7.50 10.00 12.50 15.00
23.3 25.775
28.25 30.725 33.2
Pow
er
A: Molar Conc. C: IPA Flow Rate
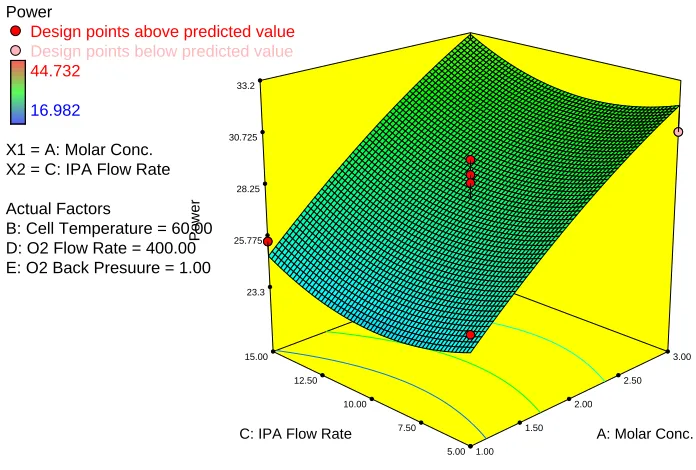
Figure 5. Effect of Flow Rate and Molar Concentration of 2-propanol on power density
[image:8.596.114.458.113.336.2] [image:8.596.111.459.434.669.2]
of increase in IPA flow rate on the power density rather the power density degrades slightly with initial increase in the IPA flow rate but recovers back later with further increase in the flow rate. An increase in power density is observed with increase in molar conc. of the IPA fed to the cell but the profile for change in power density remains more or less the same for increase in IPA flow rate for different molar concentrations of the IPA fed to the fuel cell.
Design-Expert® Software
Power
Design points above predicted value Design points below predicted value 44.732
16.982
X1 = A: Molar Conc. X2 = D: O2 Flow Rate
Actual Factors
B: Cell Temperature = 60.00 C: IPA Flow Rate = 10.00 E: O2 Back Presuure = 1.00
1.00 1.50
2.00 2.50
3.00
200.00 300.00 400.00 500.00 600.00
23 26 29 32 35
Pow
er
A: Molar Conc. D: O2 Flow Rate
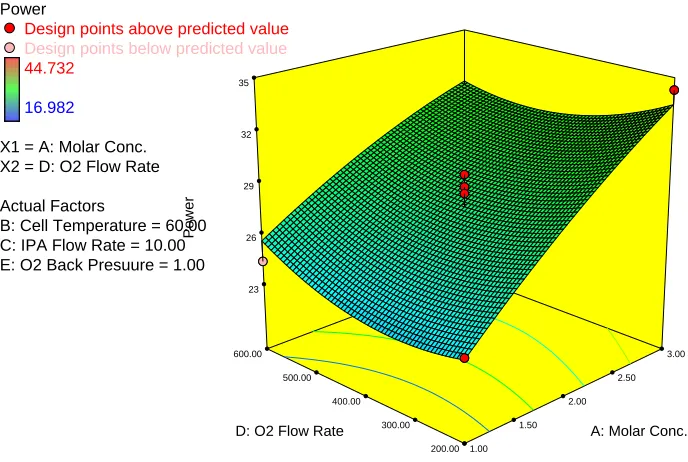
Figure 6. Effect of Oxygen Flow Rate and Molar Concentration of 2-propanol on power density
Fig. 6 represents the effect of O2 flow rate and molar conc. of IPA on power density of the fuel cell with the other factors maintained at a particular constant value. There is very little effect of O2 flow rate on the power density of the fuel cell at lower molar concentration of IPA however with increase in molar concentration of IPA the performance of the cell improves and the cell performs better at lower O2 flow rate at higher molar concentrations rather than at higher O2 flow rates.
[image:9.596.114.458.208.439.2]
Design-Expert® Software
Power
Design points above predicted value Design points below predicted value 44.732
16.982
X1 = A: Molar Conc. X2 = E: O2 Back Presuure
Actual Factors
B: Cell Temperature = 60.00 C: IPA Flow Rate = 10.00 D: O2 Flow Rate = 400.00
1.00 1.50
2.00 2.50
3.00
0.00 0.50 1.00 1.50 2.00 23.3 25.775
28.25 30.725 33.2
Pow
er
A: Molar Conc. E: O2 Back Presuure
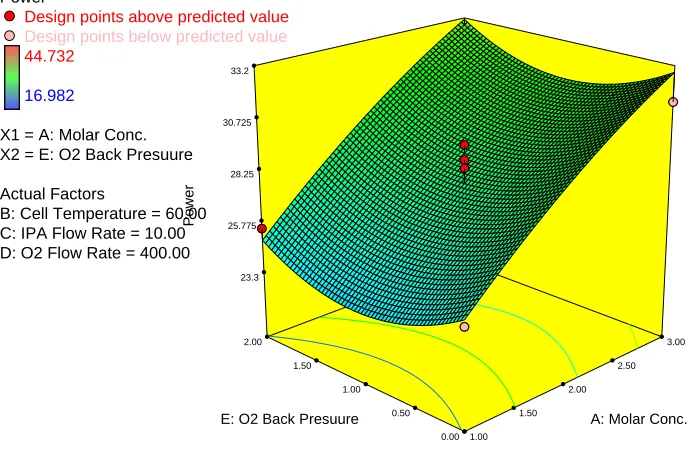
Figure 7. Effect of Oxygen Back Pressure and Molar Concentration of 2-propanol on power density
Design-Expert® Software
Power
Design points above predicted value Design points below predicted value 44.732
16.982
X1 = B: Cell Temperature X2 = C: IPA Flow Rate
Actual Factors A: Molar Conc. = 2.00 D: O2 Flow Rate = 400.00 E: O2 Back Presuure = 1.00
40.00 50.00
60.00 70.00
80.00
5.00 7.50 10.00 12.50 15.00
16 23 30 37 44
Pow
er
B: Cell Temperature C: IPA Flow Rate
Figure 8. Effect of 2-propanol Flow Rate and Cell Temperature on power density
[image:10.596.114.459.112.338.2] [image:10.596.111.465.423.661.2]
however the performance of the cell improves significantly with increase in the cell operation temperature.
Design-Expert® Software
Power
Design points above predicted value Design points below predicted value 44.732
16.982
X1 = B: Cell Temperature X2 = D: O2 Flow Rate
Actual Factors A: Molar Conc. = 2.00 C: IPA Flow Rate = 10.00 E: O2 Back Presuure = 1.00
40.00 50.00
60.00 70.00
80.00
200.00 300.00 400.00 500.00 600.00
19 25.5 32 38.5 45
Pow
er
[image:11.596.115.467.181.404.2]B: Cell Temperature D: O2 Flow Rate
Figure 9. Effect of Oxygen Flow Rate and Cell Temperature on power density
Design-Expert® Software
Power
Design points above predicted value Design points below predicted value 44.732
16.982
X1 = B: Cell Temperature X2 = E: O2 Back Presuure
Actual Factors A: Molar Conc. = 2.00 C: IPA Flow Rate = 10.00 D: O2 Flow Rate = 400.00
40.00 50.00
60.00 70.00
80.00
0.00 0.50 1.00 1.50 2.00
19 25.5 32 38.5 45
Pow
er
B: Cell Temperature E: O2 Back Presuure
[image:11.596.114.464.485.705.2]
Design-Expert® Software
Power
Design points above predicted value
Design points below predicted value
44.732
16.982
X1 = C: IPA Flow Rate X2 = D: O2 Flow Rate Actual Factors A: Molar Conc. = 2.00 B: Cell Temperature = 60.00 E: O2 Back Presuure = 1.00
5.00 7.50
10.00 12.50
15.00
200.00 300.00 400.00 500.00 600.00
26 27.675 29.35 31.025 32.7
Pow
er
[image:12.596.86.485.114.380.2]C: IPA Flow Rate D: O2 Flow Rate
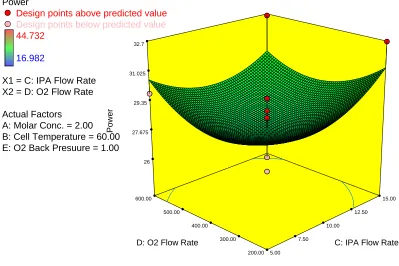
Figure 11. Effect of Oxygen Flow Rate and 2-propanol Flow Rate on power density
The performance of the cell remains more or less the same for different IPA flow rates at a particular cell operation temperature.
Fig. 9 represents the effect of O2 flow rate and cell operation temperature on the performance of the fuel cell with the other factors maintained at a particular constant value. There is a slight decrease in the performance of the cell with increase in O2 flow rate at lower cell operation temperatures however this effect is later reversed and it is observed that the performance of the cell improves with increase in O2 flow rate at higher cell operation temperatures. The performance of the cell improves significantly with increase in cell operation temperature at all O2 flow rates.
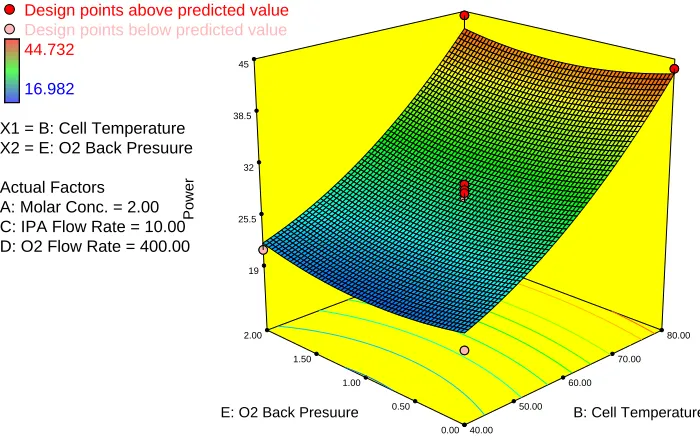
Fig. 10 represents the effect of O2 back pressure and cell operation temperature on the performance of the fuel cell with the other factors maintained at a particular constant value. There is almost no effect of increase in O2 back pressure on the performance of the cell at different cell operation temperatures however the performance of the cell increases with increase in cell operation temperature at all values of the studied O2 back pressure.
4. CONCLUSION
RSM has been used for optimizing the correlation between the factors to obtain optimal performance from the fuel cell. We observed that the molar concentration of 2-propanol fed to the cell and the cell operation temperature had the most significant influence on the performance of the fuel cell. The power density of the fuel cell increased with increase in molar concentration of 2-propanol as well as with increase in fuel cell operation temperature. The optimized conditions for the highest power density of 45 mW/cm2 by the RSM was found to be 1.5 M 2-propanol concentration, 80 oC cell temperature, 9.22 ml/min 2-propanol flow rate, 596 ml/min oxygen flow rate and no back pressure for the oxidant, this performance result is from amongst the best results reported in literature for direct 2-propanol fuel cell performance. Previously Bergens et al. [6-8] have reported a power density of 22.3 mW/mg of Pt for an alkaline D2PFC with commercial platinum electrodes and Yang et al. [20-21] reported a power density 5.46 mW/cm2 for an alkaline D2PFC with a Pt-Ru anode (2 mg/cm2).
References
1. P. Chaurasia, Y. Ando and T. Tanaka, Journal of Energy Conversion and Management, 44 (2003) 611
2. U.B. Demirci, Journal of Power Sources, 169(2) (2007) 239
3. C. Lamy, A. Lima, V.L. Rhun, C. Coutanceau and J.M. L´eger, J. Power Sources, 105 (2002) 283 4. J.T. Wang, S. Wasmus and R.F. Savinell, J. Electrochem. Soc., 142 (1995) 4218
5. Z.G. Qi and A. Kaufman, J. Power Sources, 112 (2002) 121
6. L.N. Menard and S.H. Bergens, J. Power Sources, 194(1) (2009) 298
7. M.E.P. Markiewicz, D.M. Hebert and S.H. Bergens, J. Power Sources, 161(2) (2006) 761 8. M.E.P. Markiewicz and S.H. Bergens, J. Power Sources, 185(1) (2008) 222
9. C. Xu, Z. Tian, Z. Chen and S.P. Jiang, Electrochem. Commun., 10(2) (2008) 246 10.Y. Su, C. Xu, J. Liu and Z. Liu, J. Power Sources, 194(1) (2009) 295
11.J. Lu, S. Lu, D. Wang, M. Yang, Z. Liu, C. Xu and S.P. Jiang, Electrochim. Acta, 54(23) (2009) 5486
12.J. Ye, J. Liu, C. Xu, S.P. Jiang and Y. Tong, Electrochem. Commun., 9(12) (2007) 2760 13.J. Liu, J. Ye, C. Xu, S.P. Jiang and Y. Tong, J. Power Sources, 177(1) (2008) 67
14.J. Zhang and J. Zhang, Catalyst Layer/MEA Performance Evaluation, PEM Fuel Cell Electrocatalysts and Catalyst Layers, Ed. J. Zhang, Springer (2008)
15.D.J. Moon, J.M. Park, J.S. Kang, K.S. Yoo and S.I. Hong, J. Ind. Eng. Chem., 12 (2006) 149 16.M.L.A. Teruel, E. Goniter, C. Bienaime, J.E.N. Saucedo and J.N. Barbotin, Enzyme Microb. Tech.,
21 (1997) 314
17.S.L. Lee and W.C. Chen, Enzyme Microb. Tech., 21 (1997) 436 18.C.J.S.M. Silva and I.C. Roberto, Proc. Biochem. 36 (2001) 1119
19.Y. Ando, T. Tanaka, T. Doi and T. Takashima, Journal of Energy Conversion and Management,
42(15-17) (2001) 1807
20.C.C. Yang, S.J. Chiu and W.C. Chien, J. Power Sources, 162(1) (2006) 21 21.C.C. Yang, S.J. Chiu and C.T. Lin, J. Power Sources, 177(1) (2008) 40