Int. J. Electrochem. Sci., 7 (2012) 12829 - 12845
International Journal of
ELECTROCHEMICAL
SCIENCE
www.electrochemsci.org
Synthesis, Spectral, Electrochemical and Biological Studies of
Nitrogen Donor Macrocyclic Ligand and its Transition Metal
Complexes
Rayees Ahmad Shiekh1,*, Ismail Ab Rahman1, Maqsood Ahmad Malik2, Sam’an Malik Masudi1
, Norhayati Luddin1
1
School of Dental Sciences, Universiti Sains Malaysia, 16150 Kubang Kerian, Kelantan, Malaysia
2
Department of Chemistry, Faculty of Science, King Abdulaziz University, P.O. Box 80203, Jeddah 21413, Saudi Arabia
*
E-mail: rayeeschem@gmail.com
Received: 17 September 2012 / Accepted: 3 October 2012 / Published: 1 December 2012
Novel complexes of Ni(II), Co(II), and Cu(II) were synthesized with the macrocyclic ligand, i.e., 5,8,13,16-tetraoxo-1,4,9,12-tetraazacyclohexa-decane. The ligand was prepared by the [2+2] condensation of succinic acid and ethylenediamine. Synthesized complexes have been characterized based on elemental analysis, FTIR, 1H NMR, ESI MS, TG/DTA, UV-Vis spectroscopic techniques, conductivity and magnetic measurements. The molar conductance measurements of Cu(II), Co(II) and Ni(II) complexes in DMF correspond to non electrolyte nature. The redox properties of the complexes were extensively investigated by electrochemical method using cyclic voltammetry (CV). Based on these studies, a six coordinate octahedral geometry around the metal ions in the complexes has been proposed. These metal complexes were also tested for their in vitro antimicrobial activities against some bacterial and fungal strains to assess their inhibiting potential and the activities shown by these complexes were compared with standard drugs.
Keywords: Macrocycle, Tetradentate, Metal complexes, Antimicrobial activities, Growth curve
1. INTRODUCTION
immunocompromised patients such as leukemia, acquired immunodeficiency syndrome or patients who undergo cancer therapy, organ transplantation, severe burn cases, pregnancy are particularly susceptible to opportunistic fungal infections [2]. Candidiasis proves to be life threatening mycoses fatal for immuno compromised patients e.g. AIDS and transplantation surgery [3]. The incidence of both superficial and invasive Candidiasis has increased markedly over the last few decades. This diploid opportunistic fungal pathogen Candida is increasing importance to modern medicine [4, 5]. Numbers of antifungal agents are available for the treatment of Candidal infections [6, 7] majority of them being polyenes such as Amphotericin B and Nystatin or the azoles, such as Itraconazoles and Fluconazole. Currently, uses of standard antifungal therapies are scare due to the high toxicity, low efficacy rates, and drug resistance. Recent studies have indicated C. albicans fighting to azoles or heptotoxicity and nephrotoxicity connected to polyene utilize, particularly amphotericin B [8].
Macrocyclic ligands are a emerging class of compounds with changeable chemistry; vide series of molecular topology and, sets of supporter atoms [9, 10]. The macrocyclic systems are of significant interest for not only their pharmacological properties as antibacterial, anticancer, antiviral, antifungal agent [11] but also for their capacity for chemical recognition of anions and metals of biochemical, medical and environmental importance. [12-14]. The chemistry of transition metal ion with macrocyclic ligands has become a rapidly growing area of research, because of their importance in biological processes and constitutes the active site in metalloprotiens and enzymes [15-17]. Copper is an important trace element for life processes and several copper containing proteins have been identified [18, 19]. Biochemistry of nickel is well documented. [20] Nickel and its organometal derivatives shows good antimicrobial properties [21]. It shows toxicity even in low doses in both plants and animals [22]. The cobalt is an essential element for life although it does not participate O2
macrocyclic tetradentate ligand and its transition metal complexes, which can be used as high potential drug. Encouraging results and screening of anticandidial and antibacterial activities by MIC, Resistotyping and growth curve studies have reported here for the first time.
2. EXPERIMENTAL
2.1. Materials and methods
All the synthesis and handling were carried out under an atmosphere of dry and oxygen-free nitrogen, using standard Schlenk techniques. Succinic acid (Merck Ltd, India), and ethylenediamine (Merck Ltd, India) were purchased and used as received. The solvents were purchased from (Merck India Ltd.). Samples for micro analysis were dried in vacuum to constant weight. A Perkin Elmer 2400 CHNSO Elemental Analyser performed elemental analyses. IR spectra were seen as KBr pellets using a Perkin Elmer 1620 FT IR spectrophotometer. Far IR spectra were recorded as CsI pellets in the region 650-100 cm-1 using a JASCO FT IR spectrophotometer. 1H NMR spectra were recorded using a Bruker DPX-300 MHz spectrophotometer operating at room temperature with DMSO d6 as solvent.
The chemical shift (δ) are reported in parts per million (ppm) using tetramethylsilane as internal standard. Positive and negative ESI mass spectra were measured by Bruker (esquire3000_00037) instrument. Thermal analysis (TG/DTA) data were calculated under nitrogen atmosphere using a SII Ex Star 6000 TG/DTA 6300 instrument. Magnetic susceptibility measurements were approved out from a microanalysis laboratory by Gouy method at room temperature. Electronic spectra were recorded on a spectro–UV-Vis Dual Beam 8 auto cell UVS–2700 LABOMED, INC, US spectrophotometer using DMSO as solvent. Electrochemical performance of the metal complexes was measured with CH Instruments, U.S.A (Model 1110A-Electrochemical analyzer, Version 4.01) in HPLC grade DMF containing n-Bu4NClO4 as the sustaining electrolyte. The three-electrode system
consisted of glassy carbon electrode (3 mm diameter) as a working electrode, a Ag/AgCl (3 M KCl) reference electrode and a platinum wire as auxiliary electrode was used. In order to provide a reproducible active surface and to improve the sensitivity and resolution of the voltammetric peaks, the glassy carbon electrode was polished to a mirror finish with 0.3 micron alumina on a smooth polishing cloth and then rinsed with methanol and double distilled water prior to each electrochemical measurements. The electrode cleaning procedure requires less than 3 min. All the solutions checked by electrochemical techniques were purged for 10 min with water-saturated nitrogen. All measurements were carried out at room temperature (24 0C). Melting point was recorded on a Metrex melting point apparatus.
2.2. Synthesis of Macrocyclic
Ligand 5,8,13,16-tetraoxo- 1,4,9,12-tetraazacyclohexa-decane
acid. On keeping it overnight at O 0C, a white cream precipitate was formed, which was filtered, washed with ethanol and dried in vacuo over P4O10 and it was recrystallised from methanol (yield
75%), mp>300 0C, IR (KBr, cm-1): 3296(N-H), 2995(C-H), 1640(C=O), 1430(C-N), 1033, 858, 751;
1
H NMR (300 MHz, δ ppm from TMS in DMSO-d6, 300 k): δ 11.56-12.35 (4H, br N-H), δ 4.25-
4.45(8H, C-H2), δ 2.71- 2.82(8H, OC-N-C-H2). ESI MS (m/z) 285 [M] +, 286 [M+1]+. Elem anal calcd
C 50.72, H 7.03, O 22.52, N 19.71%; found C 50.75, H 7.05, O 22.54, N 19.73%.
2.3. Complex - I
Synthesis of Cobalt (II) complex
To a solution of CoCl2.6H2O (0.71 g, 3 mmol) in 20 mL methanol was added drop wise to a
methanolic solution (20 ml) of the ligand (1.04 g, 3 mmol) with continuous stirring. The resulting solution was stirred for 7 hours at 30 0C and the solution was reduced to half of its volume. It was then allowed to stand overnight in a refrigerator. A light pink precipitate separates out, which was secluded by filtration under vacuum. It was washed systematically with hexane and dried in vacuo over fused CaCl2. The compound was recovered in solid state. It was recrystallised from methanol Yield 65% and
m.p.>300 0C. UV-Vis (DMSO) cm-1, 13,650, 15,151, and 25,000, IR (KBr, cm-1): 3281(N-H), 2977(C-H), 1645(C=O), 1416(C-N), 1043, 881, 748.; Far IR (CsI, cm-1) 460 (Co-N), 347 (Co-Cl). 1H NMR (300 MHz, δ ppm from TMS in DMSO-d6, 300 k): δ 11.65-12.46 (4H, N-H), δ 4.28- 4.50(8H, C-H2), δ
2.75- 2.86 (8H, OC-N-C-H2). ESI MS (m/z) 415 [M]+, 416 [M+2]+. Molar conductance, Λm (Ω-1cm-1
mol-1, 10-3 DMSO, r.t.): 30. μeff (r.t., BM): 4.93. Elem. anal. calcd C 34.81, H 4.81, O 15.46, N 13.53%; found C 34.84, H 4.85, O 15.48, N 13.55%;
2.4. Complex - II
Synthesis of Nickel (II) complex
NiCl2.6H2O was used for the synthesis of Complex (II) following the above procedure. A light
green precipitate collected, which was recrystallised from methanol, 62% yield and m.p.>300 0C; UV-Vis (DMSO) cm-1, 10,362, 15,797, and 21,450, IR (KBr, cm-1): 3279(N-H), 2978(C-H), 1635(C=O), 1410(C-N), 1045, 720; Far IR (CsI, cm-1) 450 (Ni-N), 336 (Ni-Cl). 1H NMR (DMSO d6, 300K): δ
11.69-12.55(4H, N-H), δ 4.30- 4.53(8H, C-H), δ 2.78- 2.89(8H, OC-N-C-H2). ESI MS (m/z) 414 [M]+,
415 [M+2]+. Molar conductance, Λm (Ω-1cm-1 mol-1, 10-3 DMSO, r.t.): 36. μeff (r.t., BM): 2.94. Elem.
anal. calcd C 34.83, H 4.83, O 15.46, N 13.54%; found C 34.85, H 4.86, O 15.50, N 13.57%;
2.5. Complex - III
Synthesis of Copper (II) complex
For the synthesis of complex (III) following the same procedure CuCl2.2H2O was used instead of
CoCl2.6H2O. A Sky blue product was obtained, which was recrystallised from methanol, 67% yield
2976(C-H), 1623(C=O), 1412(C-N), 1073, 882, 749; Far IR (CsI, cm-1) 440 (Cu-N), 330 (Cu-Cl). 1H NMR (300 MHz, δ ppm from TMS in DMSO-d6, 300 k): δ 11.73-12.63 (4H, N-H), δ 4.32- 4.55(8H,
C-H), δ 2.77- 2.90(8H, OC-N-C-H2). ESI MS (m/z) 421 M+, 422 [M+2]+. Molar conductance, Λm (Ω -1
cm-1 mol-1, 10-3 DMSO, r.t.): 32. μeff (r.t., BM): 2.02. Elem anal calcd C 34.43, H 4.77, O 15.28, N 13.38%; found C 34.45, H 4.80, O 15.30, N 13.41%;
2.6. Antimicrobial Activity 2.6.1. Growth Conditions
All of the fungal and bacterial species used in this study were obtained from Indian Institute of Integrative Medicines (IIIM) Jammu (India). Stock cultures of Candida albicans ATCC 10261, Candida tropicalis ATCC 750, Candida glabrata ATCC 90030 and Candida kruesi ATCC 6258 were maintained on slants of nutrient agar (yeast extract 1%, peptone 2%, D-glucose 2% and agar 2.5%) (HiMedia) at 4 0C. To initiate growth for experimental purposes, one loop full of cells from an agar culture was inoculated into 25ml of respective nutrient media and incubated at 30-37 0C for 24 hr i.e. up to stationary phase (primary culture). The cells from primary culture (108 cells ml-1) were re-inoculated into 100 ml fresh YEPD medium and grown for 8-10 h i.e., upto mid-log phase (106 cells ml-1). Stock cultures of Pseudomonas were cultured in King’s B media while as that of E. coli were cultured in Maconky agar. Fluconazole and Ampicillin were purchased from SIGMA chemicals (USA).
2.6.2. Determination of MIC80
Minimum inhibitory concentration was defined as the lowest concentration of the test molecule that causes inhibition of visible growth of microbial cells. MIC80 was determined in vitro in liquid
medium by serial broth dilution method [31]. Standard drugs Fluconazole and Ampicillin were included as positive controls. The MIC values keep up a correspondence to the most minuscule concentrations that did not allow for the recognition of any visible growth.
2.6.3. Disc Diffusion Assay
2.6.4. Growth studies
For growth studies, 106 cells/ml (optical density A595 = 0.1) culture of microbial cells were
inoculated and grown aerobically in YEPD broth for control and along with various concentrations of the test compounds in individual flasks. Growth was calculated turbidometrically at 595 nm using LaboMed Inc. Spectrophotometer (USA). The growth rate of different fungi and bacteria in absence as well as in presence of test compounds was performed for each concentration.
3. RESULTS AND DISCUSSION
The ligand was synthesized by condensing the corresponding acid and the diamine with few drops hydrochloric acid (scheme 1. a). This ligand was then refluxed at room temperature with the metal chlorides to form their corresponding metal complexes (scheme 1. b).
+
Reflux
- 2H
2O/EtOH
+
Reflux
MeOH
MCl
2.6H
2O
M = Ni, Co
CuCl
2.2H
2O
OH O
OH O
N H2
NH2
NH O
O
N H
NH N
H
O O
NH O
O
N H
NH N
H
O O
NH O
O
N H
NH N
H
O O
M Cl
Cl
(a)
(b)
Scheme 1 (a, b): Showing synthesis of macrocyclic ligand and its metal complexes.
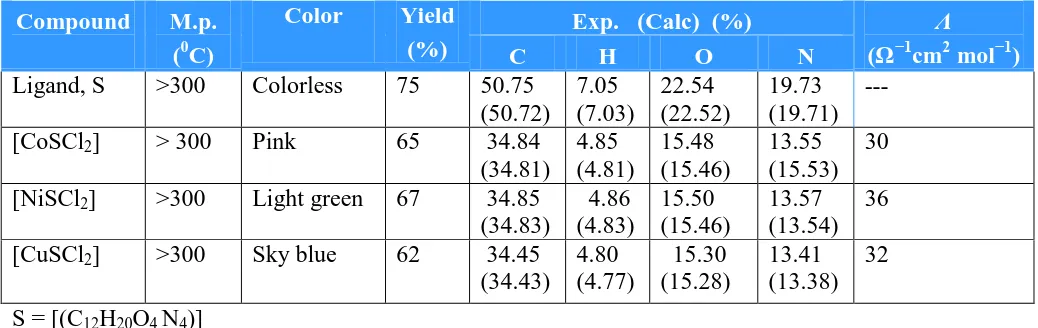
(Table 1) showing the physical properties and analytical data of the ligand and its metal complexes sustain their proposed structure. The molar conductivity (Λm) of the metal complexes
measured in 1×10⁻³
Table 1. Analytical data and Physical properties of the complexes
Compound M.p. (0C)
Color Yield (%)
Exp. (Calc) (%) Λ
(Ω−1cm2 mol−1)
C H O N
Ligand, S >300 Colorless 75 50.75 (50.72) 7.05 (7.03) 22.54 (22.52) 19.73 (19.71) --- [CoSCl2] > 300 Pink 65 34.84
(34.81) 4.85 (4.81) 15.48 (15.46) 13.55 (15.53) 30 [NiSCl2] >300 Light green 67 34.85
(34.83) 4.86 (4.83) 15.50 (15.46) 13.57 (13.54) 36 [CuSCl2] >300 Sky blue 62 34.45
(34.43) 4.80 (4.77) 15.30 (15.28) 13.41 (13.38) 32 S = [(C12H20O4 N4)]
3.1. Infrared Red Spectra Macrocyclic Ligand
IR spectra firmly support the formation of these compounds. Ligand does not show any evidence of the band corresponding for the free primary diamine and hydroxyl group [34]. In the IR spectrum of macrocyclic ligand absences of a broad absorption band characteristic for hydroxyl group of COOH in succinic acid, indicates that the OH group of succinic acid was detached from the COOH group to form a bond between carboxyl carbon atom and amino group nitrogen of ethylenediamine, also suggest complete condensation of reactants and elimination of water molecule. This has been confirmed by the appearance of a strong signal at 1430 cm-1 which may be attributed to the C-N bond [34, 35]. A sharp medium intensity band observed at 3296 cm-1 may be assigned to υ(N–H) of the secondary amino group [36].The ligand also shows a signals for the C=O at 1640 cm-1 and C-H at 2995 cm-1 vibrations. The low frequency of C=O group as compared to acetone (1715 cm-1) is attrigrated to resonance with lone pair of the nitrogen (Table 2).
Table 2. IR Spectral data of the ligand and its metal complexes (Cm-1)
Compound ν C – H ν N – H ν C = O ν C – N ν M – N ν M – Cl
Ligand, S 2995 3296 1640 1430 ….. ……
[CoSCl2] 2977 3281 1645 1416 460 347
[NiSCl2] 2978 3279 1635 1410 450 336
[CuSCl2] 2976 3285 1623 1412 440 330
S = [(C12H20O4 N4)]
Complexes
and Cu(II) and S is [(C12H20O4 N4)]. The shifting in the band of υ(C-N) towards the lower wave
number in the metal complexes signifying that the coordination takes place through the nitrogen of the υ(C-NH) group. This indicates the flow of electron density towards the metal atom through the C-N group. This has been finally established through far IR spectra by the appearance of new signals seen at 460, 450, 440 cm-1 in the spectra of metal complexes which gives us clear proof for the presence of metal–nitrogen bond in Co(II), Ni(II), and Cu(II) complexes respectively [37-40]. Other vibrating signals are seen at 347, 336 and 330 cm-1 in the spectra of metal complexes give us proof for the presence of metal-chlorine bond in Co(II), Ni(II) and Cu(II) complex respectively [38-41].
3.2. 1H NMR Spectra
1
H NMR spectrum of the ligand shows a sharp signal in the range 11.56- 12.35 ppm, which is, attributed to amide CO–NH, (4H) [42, 43] and does not show any signal corresponding to primary amine. A signal appearing in the range 2.71- 2.82 ppm has been ascribed to methylene protons OC–N-CH2, (8H), while as C-H2 (8H) protons appear in the range 4.25- 4.45 ppm. The NMR spectrum of the
ligand is consistent with the single species present in the solution, since only one set of signals is observed in the ligand. These proton signals undergo down field shifting in all the metal complexes of the macrocyclic ligand, because of the paramagnetic effect of metal (II) ions and hence support the coordination of the ligand towards the metal ions [44-46] and the macrocyclic nature of the product.
[image:8.596.110.484.460.668.2]3.3. Electro Spray Ionization Mass Spectra (ESI MS)
Figure 1. Electro Spray Ionization Mass Spectra (ESI MS) of Ligand.
range m/z 85.0, 120.7, 188.6, 225, 254.7 etc, may be assigned to various fragments. These data suggests the 2+2 condensation of succinic acid and ethylenediamine. Their intensity gives an idea of stability of fragments. Correspondingly, positive ion ESI-MS of the cobalt, and copper, negative ion ESI-MS nickel complexes shows a peak at m/z 415, 421, 414 respectively, which is reliable with the molecular ion fragment, and it supports the proposed structure of the complexes. [M+2]+ fragments were observed in all the metal complexes, possibly due to presence of isotopic chlorine in low quantities [47]. In some cases, the molecular ion peak was also associated with the solvent, water molecules and some adduct ions from the mobile phase solution [48-49].
3.4. Electronic Spectra 3.4.1. Cobalt (II) complex
A mononuclear cobalt(II) complex exhibits absorption bands at 13,650 (ν1), 15,151(ν2) and
25,000(ν3) cm-1, which may be consign to 4T1g (F)→ 4T2g (F), 4T1g→ 4A2g and 4T1g (F)→ 4T1g (P)
transitions respectively [50]. Suggesting an octahedral geometry around a Cobalt(II) ion, in the complexes under study. Furthermore, the magnetic moment measurements recorded at room temperature lie at 4.93 B.M [51]. This value is indicative of an octahedral geometry [52, 53] of these complexes.
3.4.2. Copper (II) complex
Electronic spectrum of the mononuclear copper(II) complex recorded at room temperature, in DMF solution, shows broad band absorption at 12,987, 14, 285 and 23,809cm-1, which may be assign to 2B1g→ 2A1g, (dx2- y2 → dz2)(ν1), 2B1g→ 2B2g, (dx2- y2 → d zy )(ν2), and 2B1g→ 2Eg, (dx2- y2 → dzy,
dyz)(ν3) transition and it is in conformity with octahedral geometry [50], an indication of the most
probable geometric configuration of the synthesized metal complexes is their magnetic moment values. So, additional confirmed by the magnetic moment measurements at room temperature values lie at 2.02 B.M corresponding to the presence of one unpaired electron and it supports an octahedral geometry [54-56].
3.4.3. Nickel (II) complex
The magnetic moment of the Ni(II) complex at room temperature lie at 2.94 B. M. These values fall in high spin configuration. [53] and confirm the presence of an octahedral environment around the Ni(II) ion. Ni(II) complexes exhibit three absorption bands at 10,362, 15,797, and 21,450 cm-1 these bands may be assign to three spin allowed transition: 3A2g(F)→ 3T2g(F)(υ1), 3A2g(F)→ 3
T1g(F)(υ2), and 3A2g(F)→ 3T1g(P)(υ3), respectively [56]. This value is indicative to the octahedral
3.5. Thermo Gravimetric Analysis (TG/DTA) Macrocyclic Ligand
[image:10.596.111.484.259.508.2]TG/DTA of the macrocyclic ligand and its metal complexes was recorded under nitrogen atmosphere at the heating rate of 10 0C/min, Fig. 2. The macrocyclic ligand is stable upto 215 0C and shows a continuous weight loss upto 380 0C, Therefore the whole macrocyclic ligand gets decomposed in a single step. The DTA of the macrocyclic ligand shows two endothermic peaks; one broad endothermic peak at 228 0C with a shoulder at 210 0C corresponds to the melting and the first inflexion point. The second inflexion on the DTA curve occurs at 351 0C, which represents a small weight loss step from 360-380 0C.
Figure 2. Thermo Gravimetric Analysis (TG/DTA) of the Ligand
Complexes
The thermal gravimetric (TG) analysis was used as a probe to evidence of the coupled water or solvent molecules to be in coordination sphere or in crystalline form [57]. The thermo gram of copper(II), nickel(II) and cobalt(II) complexes are more stable than the macrocyclic ligand and does not decompose upto 255, 253 and 250 0C respectively. It shows a major step of decomposition from 255-330 0C which is detected by DTA at 320 0C, this corresponds to the loss of two succinic acids and two ethylenediamine moieties (observed weight 70.5%, theoretical weight 67.88%). It is very interesting to note that the complexes gains some 5% weight from 335-410 0C and does not decompose further. This weight gain of macrocyclic complexes may be attributed to the migration of the metal (Mlayer) to the new vacant sites produced by the partial reduction of M2+ to M1+ in case of Copper and
3.6. Cyclic voltammetric study (CV)
The cyclic voltammogram of the Cu(II) complex (fig 3a) displays a reduction peak at Epc = -1.6V with an associated oxidation peak at Epa = -0.7V at a scan rate of 50mV/s. The peak separation of this couple (∆ Ep) is 0.9V and increases with scan rate. The ∆ Ep is 1.2 and 1.4 at scan rates 100mV/s and 200mV/s respectively. Thus, the analyses of cyclic voltametric responses at different scan rate give the indication for quasi-reversible one electron reduction. The most significant element of the Cu(II) complex is the Cu(II)/Cu(I) couple. The ratio of cathodic to anodic peak height was less than one. However, the peak current increases with the increase of the square root of the scan rates. This establishes the electrode process as diffusion controlled [60-61].
Co(II) complex exhibits one electron quasi reversible transfer process with a reduction peak at Epc = -1.5V with a corresponding oxidation peak at Epa = -0.6V at a scan rate of 50mV/s (Fig 3b). The peak separation (∆ Ep) of this couple is 0.9V. With the increasing scan rates, ∆ Ep value also increases giving further evidence for the quasi-reversible Co(II)/Co(I) couple. The difference between forward and backward peak potentials can provide a rough evaluation of the degree of the reversibility. The ratio of cathodic to anodic peak height was less than one. However, the peak current increases with the increase of the square root of the scan rates. This establishes the electrode process as diffusion controlled.
[image:11.596.64.537.505.720.2]The redox property of the Ni(II) complex was studied in the potential range of +1.8 to -3.0 V. Cyclic voltammogram of Ni(II) complex is shown in Fig 3c. The Ni(II) complex exhibited two quasi-reversible peaks. Cyclic voltammogram displays two reduction peaks, first one at Epc = -0.8 V with an associated oxidation peak at Epa = 0.4 V and second reduction peak at Epc = -1.9 V with an associated oxidation peak at Epa = -0.9 V at a scan rate of 200mV/s. The value of ∆Ep is 0.4 and 1 for first and second redox couples respectively and increases with scan rate gives confirmation for quasi-reversible nature associated with one electron reduction [63, 64].
3.7. Antimicrobial Screening
3.7.1. Minimum Inhibitory Concentration (MIC80)
MIC (µg/ml) of test compounds against different Fungal species 0 50 100 150 200 250 300 350 400 450 S SCu S Co S Ni Fluc onaz ole
Ligand, its complexes and Standard Drug
MI C (µ g /ml ) Candida tropicalis Candida kruesi Candida albicans Candida glabrata
Figure 4. Minimum Inhibitory Concentrations MIC80 (µg/ml) of ligand and its metal complexes
against different fungal species.
MIC (µg/ml) of test compounds against different Bacterial Species
0 50 100 150 200 250 300 350 400 450 S SC o SC o SN i Flu cona zole
Ligand, its complexes and Standard Drug
MI C (µ g /ml ) Pseudomonas E. coli
Figure 5. Minimum Inhibitory Concentrations MIC80 (µg/ml) of ligand and its metal complexes
[image:12.596.97.500.128.372.2] [image:12.596.99.496.447.704.2]
Minimum Inhibitory Concentration was defined as the lowest concentration of the ligand and its complexes that causes 80% decrease in absorbance (MIC80) compared with that of the control (no
test compound). The MIC80 of ligand, its metal complexes and standard drugs were checked against
four fungal and two bacterial species using broth dilution method (BDM). In case of Candida tropicalis, Co(II) complex has MIC80 which is 64% less as compared to parent compound, where as
Ni(II) and Cu(II) complexes have MIC80 which is 60% and 55% less as compared to the original
compound. From the results in (Fig. 4, 5) it was observed that, in fungi generally the MIC80 of
SCo<SNi<SCu<S, where as in case of bacteria the MIC80 of SNi<SCo<SCu<S. It was found that
Co(II) complex and standard drugs showed significant and matching inhibitory properties.
3.7.2. Disc Diffusion Assay
Antifungal and antibacterial activities of the compounds on solid media, when compared with standard antifungal and antibacterial drugs (Fluconazole, Ampicillin) showed significant and potential antimicrobial properties. The zone of inhibition is greatly affected by the thickness of the test agar layer. As the thickness increases, the zone of inhibition decreases.
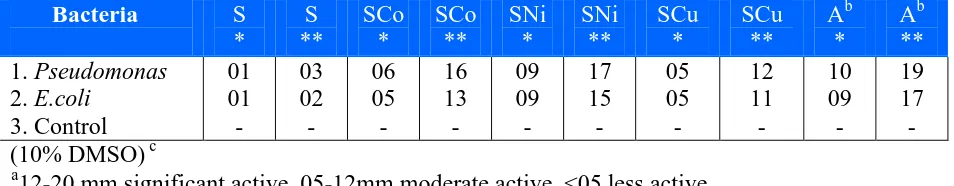
Table 3. Antibacterial activity screening data for the ligand and its metal complexes. Zone of inhibition a (mm) µg/ml.
Bacteria S * S ** SCo * SCo ** SNi * SNi ** SCu * SCu ** Ab * Ab ** 1. Pseudomonas 2. E.coli 3. Control 01 01 - 03 02 - 06 05 - 16 13 - 09 09 - 17 15 - 05 05 - 12 11 - 10 09 - 19 17 - (10% DMSO) c
a
12-20 mm significant active, 05-12mm moderate active, <05 less active.
b
Ampicillin (negative control). cSolvent control. * 500 µg/ml, ** 1000 µg/ml. S = [(C12H20O4 N4)]
[image:13.596.56.533.405.498.2]
complexes were used to get visible results. At higher concentration (1000µg/ml) the highest zone of inhibition i.e. 17, 16 and 15 mm were measured in Pseudomonas and E.coli when treated with Ni(II), Co(II) and again with Ni(II) complex respectively.
[image:14.596.45.486.369.506.2]Antifungal activity was also checked at the same concentrations. At higher concentration (1000µg/ml) the highest inhibitory zone i.e. 18, 16 and 16 mm were measured in Candida tropicalis, Candida kruesi and Candida tropicalis when treated against Co(II), Co(II) and Ni(II) complexes (Table-4). The most significant thing seen in this study was that the complexes were more active against fungi than in case of bacteria. The result showed that, in case of solvent control disc no zone of inhibition was observed so as far as our study is concerned 10% DMSO, as a solvent is having no effect on the tested organisms. Hence, we can effectively conclude here that whole of the antimicrobial effect is due to the different concentration of the metal complexes and the ligand used in this study[69, 70]. The antimicrobial activities of the complexes when compared with standard antifungal and antibacterial drugs showed significant and matching biological properties.
Table 4: Antifungal activity screening data for the ligand and its metal complexes. Zone of inhibition a (mm) µg/ml
Fungi S
*
S **
SNi *
SNi **
SCo *
SCo **
SCu *
SCu **
Fb
*
Fb
**
1. C. tropicalis 02 04 09 16 10 18 08 14 12 20
2. C. Kruesi 01 03 07 14 08 16 06 12 11 19
3. C. albicans 01 03 05 12 07 13 05 10 10 17
4. C. glabrata 01 02 05 11 07 11 05 11 09 15
5. Control - - -
(10% DMSO) c
a
12-25 mm significant active, 05-12mm moderate active, <05 less active.
b
Fluconazole(negative control). cSolvent control. * 500 µg/ml, ** 1000 µg/ml. S = [(C12H20O4 N4)]
3.7.3. Growth curve studies
In growth curve studies the effect of increasing concentrations of the ligand and its complexes on the growth pattern of different fungal and bacterial species have been studied. Control cells showed a normal pattern of growth with lag phase of 4 hrs, active exponential phase of 8-10 hrs before attaining stationary phase. Increase in concentration of test compounds leads to considerable decrease in growth. Co(II) complex when treated against Candida tropicalis at concentration of 30µg/ml the growth pattern has changed, the lag phase is extended by 4h, the stationary phase has not reached the same level of cell growth as in case of control and at 60µg/ml the lag phase is further extended by 2h. At concentration of 72µg/ml (MIC80 level), there is total inhibition of growth showing a flat line (Fig.
complexes, in concentration dependent manner suppressed growth and delayed exponential phases. At MIC80 values complete inhibition of growth was observed.
Grow th curve of C. tropicalis in presence of Co(II) Com plex
0 0.5 1 1.5 2 2.5 3
0 2 4 6 8 10 12 14 16 18 20 22 24
Tim e (hrs)
A
b
s
o
rb
a
n
c
e
(
5
9
5
n
m
)
Control (+ve)
30µg/ml
60µg/ml
72µg/ml
F* 20µg/ml
[image:15.596.114.484.121.345.2]* Fluconazole (-ve control)
Figure 6. Effect of Co(II) complex in concentration range of 30–72µg/ml was studied on C. tropicalis ATCC 750. Growth curve plotted against absorbance at 595 nm and time (hrs) shows complete inhibition of growth at 72µg/ml.
4. CONCLUSION
Ligand and its metal derivatives were successfully synthesized. The structures were confirmed by spectral and elemental analyses. Further their anticandidial and antibacterial activities were evaluated by determining minimum inhibitory concentration (MIC80), disc diffusion assay and growth
ACKNOWLEDGEMENT
The authors would like to thank Ministry of Higher Education for financial support of this research grant scheme (FRGS, Grant No. 203/PPSG/6171138).
References
1. K.N. Prasad, J. Agarwal, A.K. Dixit, D.P. Tiwari, T.N. Dhole, A. Ayyagri, Ind. J. Med. Res., 110 (1999) 11.
2. F.C. Odds, A.J. Brown, N.A. Gow, Trends In Microbiology, 11(2003) 272. 3. D.J. Sobel, L. Paul, Jr. Fidel, J.A. Vazquez, Clin. Microb. Rev., 12 (1999) 80. 4. M.G. Shepherd, R.D. Cannon, K. Niimi, H.F. Jenkinson, J. Bact., 176 (1994) 2640. 5. R. Prasad, Candida albicans, Berlin: Springer-Verlag. 1991 267.
6. A.K. Gupta, E. Thomas, Dermata. Clinics., 21(3) (2003) 565.
7. A.J. Carrillo-Munoz, G. Giusiano, P.A. Ezkurra, G. Quindos,. Rev Esp Quimioter, 19 (2006) 130. 8. N. Chami, F. Chami., S. Bennis., J. Trouillas., A. Remmal., Braz. J. Inf. Dis., 8 (2004) 217. 9. K.Y. Choi, H.Y. Lee, B. Park, J.H. Kim, J. Kim, M.W. Kim, J.W. Ryu, M. Suh, H.Suh,
Polyhedron, 20 (2001) 2003.
10. R.D. Jones, D.A. Sammerville, F. Basolo, Chem. Rev., 79 (1979) 139. 11. M. Wang., I.F. Wang, Y.Z. Li, Z.D. Xu, Tran. Met. Chem., 26 (2001) 307.
12. E. Labisbal, A. Sousa, A. Castineiras, A. Gracia-Vazquez, J. Romero, D.X. West, Polyhedron, 19, (2000) 1255.
13. M.K. Srivastava, B. Mishra, M. Nizamuddin, Ind. J. Chem., 40B (2001) 342.
14. D.K. Dermertzi, N. Kourkoumelis, M.A. Dermertzis, J.R. Miller, C.S. Frampton, J. K. Swearingen, D.X. West, Eur. J. Inorg. Chem., (2000) 727.
15. P.Guerriero, S. Tamburini, P.A.Vigato, Coord. Chem. Rev., 139 (1995) 17. 16. R. Than, A.A. Feldman, B. Krebs, Coord. Chem. Rev., 182 (1999) 211.
17. N. Strater, T. Klabunde, P. Tucker, H. Witzel, B. Krebs, Science, 268 (1995) 1489. 18. A. Messerschimdt, in: K.D. Karlin, Z. Tyeklar, (Eds). Bioinorganic Chemistry of Copper.
Chapman & Hall New York. 1993, 471.
19. J. Reedijk, E. Bouman, Bioinorganic catalysis, Marcel Dekker. New York. 1999, 469. 20. R.P. Hausinger, Biochemistry of Nickel, Plenum Press. New York. 1993, 23.
21. A. Kumar, D. Kumar, ARKIVOC., 14 (2007) 117.
22. J.K. Swearingen, D.X. West, Tran. Met. Chem., 26 (2001)252.
23. R.L. Blakley, in: D. Dolphin, (Ed.). B12, Wiley. New York. 2 (1982) 381. 24. Y. Takasaki, O. Tanabe, Agri. and Bio. Chem., 30 (1996) 1247.
25. A.T. Kabbani, H.H. Hammud, A.M. Ghonnoun, Chem. Pharm. Bull., 55 (2007) 446. 26. J.M. Kauffmann, J.C.Vire, Anal. Chim. Acta., 273 (1993) 329
27. J.Wang, (Ed.) Electroanalytical Techniques in Clinical Chemistry and Laboratory Medicine, VCH, New York, 1988
28. P.T. Kissinger, W.R. Heineman, Laboratory Techniques in Electroanalytical Chemistry, 2nd Edition, Marcel Dekker, New York, 1996.
29. D.E. Fenton, U. Casellato, P.A, Vigato, M. Vidali, Inorg. Chimica Acta., 95 (1984) 187. 30. P. Zanello, S. Tamburini, P.A. Vigato, G.A. Mazzocchin, Coord. Chem. Rev., 77 (1987) 165. 31. K.G. Davey, A. Szekely, E.M. Johnson, D.W. Warnock, J. Antimicrob. Chemotheraphy., 42,
(1998) 439.
32. K. Mukhopadhyay, A. Kohli, R. Prasad, Antimicrob. Agents Chemotheraphy., 46(12) (2002) 3695. 33. W.J. Geary, Coord. Chem. Rev., 7 (1971) 81.
34. S. Chandra, L.K. Gupta, D. Jain, Spectrochimica Acta A., 60 (2004) 2411.
36. S. Chandra., L.K. Gupta., Spectrochimica Acta A., 60 (2004)1751. 37. M. Shakir, S.P. Varkey, P.S. Hamid. Polyhedron., 12 (1993) 2775.
38. M. Shakir, K.S. Islam, A.K. Mohamed, M. Shagufta, S.S. Hasan, Trans. Met. Chem., 24 (1999) 577.
39. F.M.A.M. Aqra, Trans. Met. Chem., 24 (1999) 337. 40. S. Chandra, R. Kumar, Trans. Met. Chem., 29 (2004) 269.
41. K. Nakamoto, Infrared and Raman spectra of Inorganic and Coordination Compounds. (fifth ed.), Wiley Interscience, New York. 1997 59–60 Part B.
42. P.S. Kalsi, Spectroscopy of Organic Compounds, fourth ed., New Age International (P) Ltd., New Delhi 1999.
43. S.C. Rawle, C.P. Moore, N.W. Alcock, J. Chem. Soc. Dalton Trans., (1992) 2755. 44. A. Chaudhary, R.V. Singh, Ind. J. Chem., 43 (2004) 2529.
45. R.M. Silverstein, F.X. Webster, Spectroscopic Identification of organic Compounds, 6th Edn, John Wiley and Sons. Inc. New York. 1998, 482.
46. Z.A. Siddiqi, S.M. Shadab, Ind. J.Chem., 43 (2004) 2274. 47. W. Kemp, Organic Spectroscopy, Macmillan Press Ltd 1975. 48. M. Yamashita, J.B. Fenn, J. Phy. Chem., 88 (1984) 4451. 49. M. Mann, Organic Mass spectrometry., 25 (1990) 575.
50. A.B.P. Lever, Inorganic Electronic Spectroscopy, (Second ed.), Elsevier, Amsterdam 1984. 51. S. Chandra, Sangeetika, L.K. Gupta, Spectrochimica Acta A., 62 (2005) 307.
52. R.L. Carlin, Transition Metal Chemistry, 1, Marcel Dekker, Inc., New York 1965. 53. S. Chandra, L.K. Gupta, Spectrochimica Acta A., 60 (2004) 2767.
54. E. Konig, Structure and Bonding, (Berlin: Springer Verlag), 1971 175. 55. B.N. Figgis, Introduction to ligand fields (New Delhi: Willey Eastern) 1976. 56. S. Chandra, L.K. Gupta,. Spectrochimica Acta A., 61 (2005) 269.
57. A.A.A. Emara, M.I.A. Omima, Trans. Met. Chem., 32 (2007) 889.
58. A.C. Gaillot, B. Lanson, V.A. Drits, Chem. of Materials., 17 (2005) 2959.
59. M.A. Cheney, P.K. Bhowmik, S. Qian, S.W. Joo, W. Hou, J.M. Okoh, J. of Nanomaterials., 2008 (2008) 8.
60. A.J. Bard, L.R. Izatt (Eds), Electrochemical Methods: Fundamentals and Applications, 2nd ed., Wiley, New York, 2001.
61. Z. Shirin, R. M. Mukherjee, Polyhedron., 11 (1992) 2625. 62. A. Shyamala, A.R. Chakravarty, Polyhedron., 12 (1993) 1545.
63. M. Donzello, D. Dini, G. Arcangelo, C. Ercolani, R. Zhan, Z. Ou, P. Stuzhiz, K.J. Kadish, J. Am.Chem. Soc., 125 (2003) 14190.
64. B.W. Rossister, J.F. Hamilton, Physical Method of Chemisty, 2nd Ed.; Wiley: New York, 1985; p.2.
65. K.N. Thimmaiah, W.D. Lloyd, G.T. Chandrappa, Inorg. Chim. Acta., 106 (1985) 81.
66. A. Kulkarni, P.G. Avaji, G.B. Bagihalli, P.S. Badami, S.A. Patil, J. Coord. Chem., 62;3 (2009)481. 67. A.D. Kulkarni, S.A. Patil, P.S. Badami, J. Sulf. Chem., (2009) In Press.
68. Z.H. Chohan, H. Pervez, A. Rauf, K.M. Khan, C.T. Supuran, J. Enz. Inhib. Med. Chem., 19 (2004) 417.