PAPER • OPEN ACCESS
Ultrasonic wave propagation in powders
To cite this article: R S Al-Lashi et al 2018 J. Phys.: Conf. Ser. 1017 012001
View the article online for updates and enhancements.
Related content
Flowability of cement powderL D Shahova, E S Chernositova and J V Denisova
-Theoretical Study of Ultrasonic Wave Propagation by Quasi-Geometrical Acoustics –Interference Effect–
Masaru Sugiyama
-Evolution equations and ultrasonic wave propagation in biological tissues
-1
Content from this work may be used under the terms of theCreative Commons Attribution 3.0 licence. Any further distribution of this work must maintain attribution to the author(s) and the title of the work, journal citation and DOI.
Published under licence by IOP Publishing Ltd
Ultrasonic wave propagation in powders
R S Al-Lashi1,2, M J W Povey1, and N J Watson3
1School of Food Science and Nutrition, Faculty of Mathematics and Physical Sciences,
University of Leeds, UK.
2Department of Engineering, School of Science and Technology, Nottingham Trent University,
Clifton Lane, Nottingham, NG11 8NS, UK
3Department of Chemical and Environmental Engineering, University of Nottingham, UK.
Correspondence Email: raied.allashi@ntu.ac.uk
Abstract. Powder clumps (cakes) has a significant effect on the flowability and stability of powders. Powder caking is mainly caused by moisture migration due to wetting and environmental (temperature and humidity) changes. The process of moisture migration caking involves creating liquid bridges between the particles during condensation which subsequently harden to form solid bridges. Therefore, an effective and reliable technique is required to quantitatively and non-invasively monitor caking kinetics and effective stiffness. This paper describes two ultrasonic instruments (ultrasonic velocity pulse and airborne ultrasound systems) that have been used to monitor the caking phenomenon. Also, it discusses the relationship between the ultrasonic velocity and attenuation measurements and tracking caking kinetics and the effective stiffness of powders.
1. Introduction
Powders are the final or intermediate products of many food, chemical and pharmaceutical industries. The processing of powders can pose many challenges. Powder strength can increase significantly in the process equipment and during storage in the pack. This phenomenon is known as caking whereby free flowing powder is transformed into clumps or aggregates [1, 2]. It is mainly caused by moisture migration due to wetting and environmental (temperature and humidity) changes. The moisture migration caking process can be summarized in five steps [2]: (1) wetting and moisture absorption, (2) liquid bridging, (3) drying and moisture desorption, (4) hardening and solid bridging, and (5) compacting and caking. Powder caking can have detrimental effects on flowability, stability, solubility, mixing and dispersions [1]. As a result, it causes loss of product, delays in production, consumer complaints, storage and handling problems. Therefore, in situ monitoring of powder caking is required in many industries to improve their productivity and marketability. The ideal technique should be non-invasive, rapid, robust and effectively related to the caking stiffness and kinetics.
alumina. They demonstrated that ultrasonic velocity can be related to the packing geometry of coarser powder particles. Nevertheless, the velocity measurements are size independent and not repeatable for particle diameters less than 200 µm. Castellanos et al [6] studied the packing behavior of cohesive powder. They showed that the transmission of ultrasonic signal is determined by the elastic deformation at high consolidation stresses. Akseli and Cetinkaya [7] demonstrated air coupled (non-contact) ultrasonic technique for tablet characterisation. The coating thickness and mechanical properties of drug tablets were determined by this non-contact ultrasonic technique. Saggin and Coupland [8] used an ultrasonic device to monitor the dissolution kinetics of sucrose and lactose powder in water. They found that the reflected signal is sensitive to the amount of dissolved powder in water.
The aim of this paper is to investigate the feasibility of using ultrasonic techniques to monitor powder caking. The theory of ultrasonic wave propagation in powder will be discussed. Two ultrasonic instruments will be described. Experimental results for monitoring caking stiffness and kinetics will be presented that illustrates the relationship between sound velocity and powder caking.
2. Theory of ultrasonic wave propagation in powder
The acoustic properties of granular materials under confining pressure can be extremely nonlinear compared to continuum elastic solids. The simplest theories that describe sound propagation in powder confined by an external stress are the effective medium theory [4, 5]. In principle, these theories apply to uniformly sized spheres where the wavelength is long enough to ignore the effect of scattering from the powder particles. The ratio of sound wavelength to the particle diameter in the wavelength limit is usually greater than 10. The effective medium theories are based on the Hertz-Mindlin contact theory which assumes that the elastic moduli of the medium can be derived from the average particle to particle contact. These theories can be used to calculate the bulk and shear moduli as uniform pressured is applied to the powder particles. The longitudinal (P-wave) sound velocity and the elastic moduli of the isotropic materials are related by [4, 5]
𝑉 = (𝐾+4 3𝜇⁄
𝜌𝑑𝑟𝑦 )
1 2⁄
(1)
where V is the longitudinal sound velocity (m/s), K is the bulk modulus (N/m2), µ is the shear modulus (N/m2) and ρ
dry is the density of dry particles (Kg/m3). Makse et al. [4] derived a formula for the sound velocity in an assembly of glass spheres under stress by substituting the values of elastic moduli into equation 1 as follows
𝑉 = 𝑍1 3⁄ ∅−1 6⁄ (6𝜋𝑃 𝐾𝑛)
1 6⁄
√ 3𝑘𝑛
20𝜋𝜌𝑑𝑟𝑦 (2)
where Z is the average number of contacts per particle, ø is the volume fraction of the sample, and
kn=4µ/(1-ν) is the effective stiffness (N/m2) which is defined in terms of shear modulus (µ) of the solid particles and the Poisson ratio (ν) of the solid particle material. Equation 2 shows that the effective stiffness of the caked powder can be calculated from measurements of sound velocity by assuming Z and ø do not significantly vary and determining ρdry from the received signal amplitude. The sound velocity in caked powder is higher compared to free flowing powder. This is because of the tortuous path of the propagated ultrasonic signal in the free flowing powder as shown in figure 1.
2.1. Relationship between dry and wet density
The reflection and transmission coefficients at the interface between air and powder surface can be calculated as follow
𝑅 =𝑍𝑝𝑜𝑤𝑑𝑒𝑟−𝑍𝑎𝑖𝑟
3
𝑇 = 2𝑍𝑝𝑜𝑤𝑑𝑒𝑟
𝑍𝑝𝑜𝑤𝑑𝑒𝑟+𝑍𝑎𝑖𝑟 (4)
[image:4.595.214.445.112.314.2]
(a) Free flowing powder (b) Caked powder
Figure 1. Ultrasonic wave propagation in free flowing (a) and caked (b) powder. In comparison with caked powder (b), the ultrasonic signal takes longer to propagate in the free flowing powder (a) due to air gaps between particles.
where R and T are the reflection and transmission coefficients, respectively. The acoustic impedance of powder Zpowder and air Zair are given by
𝑍𝑝𝑜𝑤𝑑𝑒𝑟= 𝜌𝑝𝑜𝑤𝑑𝑒𝑟 𝑉𝑝𝑜𝑤𝑑𝑒𝑟 (5)
The approximate values of the density and sound velocity in air are 1.225 Kg/m3 and 340 m/s, respectively. Thus, the acoustic impedance of air is
𝑍𝑎𝑖𝑟= 𝜌𝑎𝑖𝑟 𝑉𝑎𝑖𝑟 ≈ 417 𝐾𝑔/𝑚2𝑠 (6)
The sound velocity is approximately inversely proportional to the powder density [5] as follows 𝑉𝑝𝑜𝑤𝑑𝑒𝑟 ≈ √𝜌 1
𝑝𝑜𝑤𝑑𝑒𝑟 (7)
Thus the powder acoustic impedance in equation 5 is equal to √𝜌𝑝𝑜𝑤𝑑𝑒𝑟 . Substituting equation 5 into equations 3 and 4 yields
𝑅 = √𝜌𝑝𝑜𝑤𝑑𝑒𝑟−417
√𝜌𝑝𝑜𝑤𝑑𝑒𝑟+417 (8)
𝑇 = 2 (√𝜌𝑝𝑜𝑤𝑑𝑒𝑟 )
√𝜌𝑝𝑜𝑤𝑑𝑒𝑟+417 (9)
Equations 8 and 9 can be used to calculate the reflection and transmission coefficient of dry and wet powder as follows
𝑅𝑑𝑟𝑦= √𝜌𝑑𝑟𝑦−417
√𝜌𝑑𝑟𝑦+417 (10)
𝑇𝑑𝑟𝑦= 2 (√𝜌𝑑𝑟𝑦 )
𝑅𝑤𝑒𝑡= √𝜌√𝜌𝑤𝑒𝑡−417
𝑤𝑒𝑡+417 (12)
𝑇𝑤𝑒𝑡 =√𝜌2 (√𝜌𝑤𝑒𝑡 )
𝑤𝑒𝑡+417 (13)
The powder particles agglomerate as the powder is wetted. A larger portion of ultrasonic signal is reflected from the wet powder due to formation of liquid bridges which increase the reflection coefficient relative to air. Thus, comparing the peak to peak amplitude (Vp-p) and the reflection and transmission coefficients of the wet and dry powder yields
𝑉𝑝−𝑝 𝑑𝑟𝑦
𝑉𝑃−𝑃 𝑤𝑒𝑡=
𝑅𝑑𝑟𝑦
𝑅𝑤𝑒𝑡 (14)
𝑉𝑉𝑝−𝑝 𝑑𝑟𝑦
𝑃−𝑃 𝑤𝑒𝑡=
𝑇𝑑𝑟𝑦
𝑇𝑤𝑒𝑡 (15)
The relationship between wet and dry powder density can be obtained by comparing equations 14 and 15 with equations 10 to 13 and using Taylor series approximation as follows,
𝜌𝑤𝑒𝑡= (𝑉𝑉𝑝−𝑝 𝑑𝑟𝑦
𝑝−𝑝 𝑤𝑒𝑡)
2
𝜌𝑑𝑟𝑦 (16)
3. Ultrasonic measurement instruments
Two different instruments were used to perform the caking effective stiffness and kinetics measurements. The instruments are ultrasonic velocity pulse and airborne ultrasound systems. Both systems are operated in through-transmission (pitch-catch) mode. This approach is based on transmitting ultrasonic compression wave pulses between two piezoelectric transducers. However, each system has different setup and transducers as illustrated in sections 3.1 and 3.2.
3.1.Ultrasonic velocity pulse system
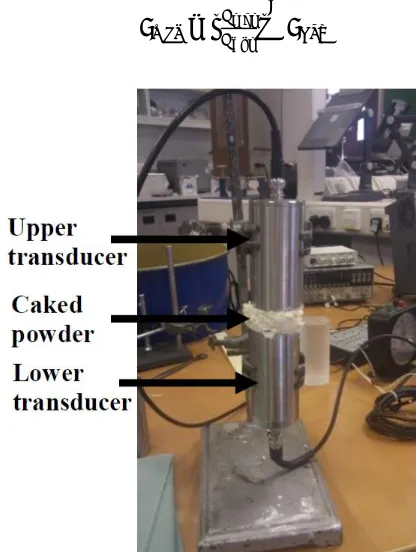
This system was used to perform the caking effective stiffness measurements. It consists of off-the-shelf instrument (Pundit Lab, Proceq Group, Switzerland) connected to a pair of transducers. The transducer pairs are placed in contact with the powder sample as shown in figure 2. Two different pairs of transducers were used in these measurements. Their centre frequencies are 24 and 50 KHz. five different thickness of powder samples were used to separate the transducer as shown table 1. A Lecroy oscilloscope (WaveRunner 44Xi, Teledyne LeCroy SA, Geneva - Switzerland) was connected to the instrument to monitor the received signals from the receiver transducer.
The system was calibrated by aligning the transducers and measuring the speed of sound in air. The powder sample was placed between the transducer pairs and wetted with water. Then it was left for some times to dry. The speed of sound and attenuation were measured during the drying time. This procedure was repeated for each sample in table 1.
3.2. Airborne ultrasound system
5
USB oscilloscope (TiePie Engineering, Sneek, Netherlands) connected to the transducers. The sample was scanned automatically by connecting the transducers to a movable stage (Prior Scientific Instruments Ltd, Cambridge, UK). A high precision motor was embedded in this stage and controlled by ProScan III controller. LABVIEW software (National Instruments Corporation (U.K.) Ltd., Newbury, UK) was used for automation control.
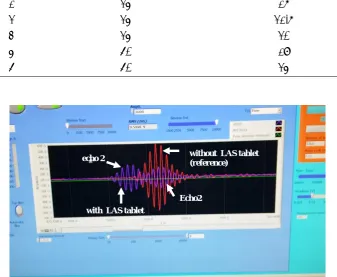
The powder sample shown in figure 3 was non-ionic surfactant linear alkylbenzene sulfonates (LAS) flake powder which is one of major chemicals used in manufacturing detergent powder. The powder was tableted to obtain a single surface particle to ignore the effects of changing particle shapes and sizes on studying particle-liquid interaction. The calibration was made by sending and receiving the signal from the stage without the tablet. This signal is used as a reference to compare with the waveform obtained from placing the tablet between the transducers as shown in figure 4. It can be seen that the signal amplitude of the reflected signal from the tablet surface has been decreased significantly. In addition, the time of flight of the reflected signal is less than the reference time. This is because part of ultrasonic signal is reflected from the top surface to form the first echo. The other portion of this signal penetrates into tablet and reflects from its bottom surface to form the second echo.
The reduction in the signal amplitude triggers the gain compensation amplifier to increase gain to amplify the received signal. This indicates that the peak to peak signal amplitude is inversely proportional to the instrument gain. Thus, using dry and wet powder gain (Gdry , Gwet) in equation 16 instead of the corresponding amplitude (Vp-p dry ,Vp-p wet ) yields
𝜌𝑤𝑒𝑡= (𝐺𝐺𝑤𝑒𝑡
𝑑𝑟𝑦)
2
𝜌𝑑𝑟𝑦 (17)
[image:6.595.191.399.405.681.2]Figure 3. Non-contact airborne ultrasound transducers transmitting and receiving ultrasonic signal from the surface of LAS flake powder surface
Table 1. Different combination of ultrasonic transducers and powder thickness used in the Ultrasonic velocity pulse system measurements shown in figure 2.
Sample Transducer center frequency (kHz)
Powder thickness (mm)
1 24 16
2 24 21.6
3 24 20
4 50 19
5 50 24
Figure 4. Comparison of the reflected signals that received by the airborne ultrasound transducers shown in figure 3. Echo 1 (red color) corresponds to the signal reflected from the stage surface without placing LAS flake tablet. However, echo 2 (violet color) represents the reflected signal from the LAS tablet.
without LAS tablet (reference) echo 2
with LAS tablet
[image:7.595.128.466.369.646.2]7 4. Results and discussion
4.1.Cakes stiffness monitoring
The particles are agglomerated as the powder was wetted due to formation of liquid bridges between these particles. The speed of sound in the wetted powder is low as shown in figure 5. This is because these liquid bridges do not readily transmit sound due to their very small shear modulus and hence acoustic mismatch with the solid particles (High shear modulus) which they connect. However, solid bridges are formed between the particles as the sample consistently dries from 35ºC to 22ºC. Therefore, the speed of sound significantly increases by an order of magnitude as shown in figure 5. This increase in sound speed depends on the transducer centre frequency. The speed of sound is lower in the higher frequency transducers.
The peak to peak voltage was also measured with the drying time as shown in figure 6. The initial portion of the curves is similar to the velocity curves due to liquid bridges. As the sample dries, the peak to peak voltage of the signal increases due to formation of solid bridges. This indicates that there is a reduction in attenuation across the sample.
[image:8.595.81.522.398.560.2]The minimum size of the detected caked regions is of the order of a wavelength (λ) of sound (v=fλ). The wavelength is 3 mm in the dry powder at 24 KHz frequency (f). However, it increases up to 175 mm in the wet caked powder. The transition from dry to caked powder occurs at a wavelength of around 9 mm.
Figure 6. Ultrasonic attenuation measurements obtained by the system shown in figure 2. The attenuation is high in wetted powder whilst it greatly improves in the dried powder. The symbol sos corresponds to the speed of sound for the samples shown in table 1 and the symbol p2p corresponds to the peak to peak signal.
4.2.Cakes kinetics monitoring
[image:9.595.80.521.121.297.2]9
5. Conclusions
The goal of this paper was to provide an initial assessment of the feasibility of using sound speed and attenuation measurements to monitor powder caking. The results show that sound speed and attenuation are sensitive to cake effective stiffness and the kinetics of caking. We conclude that ultrasound can be used to monitor powder caking.
Acknowledgement
This work was supported by AMSCI funding of Chariot Consortium, particularly the Advance Manufacturing Supply Chain Initiative which is a government supply chain fund for helping to rebuild British manufacturing process. Also the authors would like to EPSRC grant (
grant number
EP/M026310/1
) for their support. The authors would like to thanks Mr. Hossam Tantawy and Ms. Claire Duckitt from Procter & Gamble, UK for supplying us with chemicals and useful discussions.6. References