This is a repository copy of
Pedestal evolution physics in low triangularity JET tokamak
discharges with ITER-like wall
.
White Rose Research Online URL for this paper:
http://eprints.whiterose.ac.uk/125399/
Version: Published Version
Article:
Bowman, C., Dickinson, D. orcid.org/0000-0002-0868-211X, Horvath, L. et al. (13 more
authors) (2018) Pedestal evolution physics in low triangularity JET tokamak discharges
with ITER-like wall. Nuclear Fusion. 016021. pp. 1-18. ISSN 1741-4326
https://doi.org/10.1088/1741-4326/aa90bc
eprints@whiterose.ac.uk https://eprints.whiterose.ac.uk/
Reuse
This article is distributed under the terms of the Creative Commons Attribution (CC BY) licence. This licence allows you to distribute, remix, tweak, and build upon the work, even commercially, as long as you credit the authors for the original work. More information and the full terms of the licence here:
https://creativecommons.org/licenses/
Takedown
If you consider content in White Rose Research Online to be in breach of UK law, please notify us by
PAPER • OPEN ACCESS
Pedestal evolution physics in low triangularity JET
tokamak discharges with ITER-like wall
To cite this article: C. Bowman et al 2018 Nucl. Fusion 58 016021
View the article online for updates and enhancements.
Related content
MHD and gyro-kinetic stability of JET pedestals
S. Saarelma, M.N.A. Beurskens, D. Dickinson et al.
-Improved understanding of physics processes in pedestal structure, leading to improved predictive capability for ITER
R.J. Groebner, C.S. Chang, J.W. Hughes et al.
-Non-local effects on pedestal kinetic ballooning mode stability
S Saarelma, J Martin-Collar, D Dickinson et al.
-Pedestal evolution physics in low
triangularity JET tokamak discharges
with ITER-like wall
C. Bowman1, D. Dickinson1, L. Horvath1,2, A.E. Lunniss1,
H.R. Wilson1,2 , I. Cziegler1, L. Frassinetti3, K. Gibson1, A. Kirk2,
B. Lipschultz1 , C.F. Maggi2, C.M. Roach2, S. Saarelma2, P.B. Snyder4,
A. Thornton2, A. Wynn1,2 and JET Contributorsa
1 York Plasma Institute, Department of Physics, University of York, Heslington, York YO10 5DD,
United Kingdom
2 CCFE, Culham Science Centre, Abingdon OX14 3DB, United Kingdom 3 Association VR, Fusion Plasma Physics, KTH, SE-10044 Stockholm, Sweden
4 General Atomics, PO Box 85608, San Diego, CA 92186-5608, United States of America
E-mail: howard.wilson@york.ac.uk
Received 9 June 2017, revised 10 September 2017 Accepted for publication 4 October 2017 Published 10 November 2017
Abstract
The pressure gradient of the high coninement pedestal region at the edge of tokamak plasmas rapidly collapses during plasma eruptions called edge localised modes (ELMs), and then re-builds over a longer time scale before the next ELM. The physics that controls the evolution of the JET pedestal between ELMs is analysed for 1.4 MA, 1.7 T, low triangularity, δ = 0.2, discharges with the ITER-like wall, inding that the pressure gradient typically tracks the ideal magneto-hydrodynamic ballooning limit, consistent with a role for the kinetic ballooning mode. Furthermore, the pedestal width is often inluenced by the region of plasma that has second stability access to the ballooning mode, which can explain its sometimes complex evolution between ELMs. A local gyrokinetic analysis of a second stable lux surface reveals stability to kinetic ballooning modes; global effects are expected to provide a destabilising mechanism and need to be retained in such second stable situations. As well as an electron-scale electron temperature gradient mode, ion electron-scale instabilities associated with this lux surface include an electro-magnetic trapped electron branch and two electrostatic branches propagating in the ion direction, one with high radial wavenumber. In these second stability situations, the ELM is triggered by a peeling-ballooning mode; otherwise the pedestal is somewhat below the peeling-ballooning mode marginal stability boundary at ELM onset. In this latter situation, there is evidence that higher frequency ELMs are paced by an oscillation in the plasma, causing a crash in the pedestal before the peeling-ballooning boundary is reached. A model is proposed in which the oscillation is associated with hot plasma ilaments that are pushed out towards the plasma edge by a ballooning mode, draining their free energy into the cooler plasma there, and then relaxing back to repeat the process. The results suggest
Original content from this work may be used under the terms of the Creative Commons Attribution 3.0 licence. Any further distribution of this work must maintain attribution to the author(s) and the title of the work, journal citation and DOI.
a See the author list of Litaudon X. et al 2017 Nucl. Fusion57102001.
https://doi.org/10.1088/1741-4326/aa90bc
et al
that avoiding the oscillation and maximising the region of plasma that has second stability access will lead to the highest pedestal heights and, therefore, best coninement—a key result for optimising the fusion performance of JET and future tokamaks, such as ITER.
Keywords: pedestal, ELMs, JET, stability
(Some igures may appear in colour only in the online journal)
1. Introduction
As the heating power in a tokamak plasma is gradually increased through a threshold, there is often a spontaneous transition from a low coninement state, called L-mode, to a high coninement state, called H-mode [1]. The improvement in coninement is a result of suppression of the turbulence in the few centimetres of plasma, just inside the last closed lux surface. This leads to a narrow region of steep pressure gra-dient at the plasma edge, called the pedestal region. The pres-sure in the core is approximately proportional to the prespres-sure at the top of the pedestal (i.e. the top of the steep gradient region), so this so-called pedestal height has a major impact on the fusion performance of future tokamaks, like ITER, and the DT operation of JET.
Two properties inluence the pedestal height—the gra-dient that the pedestal region supports and the width of that region. The EPED series of models [2, 3] have had consid-erable success in reproducing the experimentally measured pedestal heights over a very wide parameter set from mul-tiple tokamaks, including JET. These models are built on the hypothesis that, while several mechanisms likely drive trans-port across the pedestal region, there are two modes that often play a primary role in providing the ultimate constraint on the evolution of the pedestal pressure proile. First there is a local ‘soft’ limit on the pedestal pressure gradient due to large transport induced by the kinetic ballooning mode (KBM), which is localised radially. Second, the pedestal width and gradient evolve (with gradient constrained by the KBM) until the coupled peeling-ballooning mode is triggered [4, 5], which causes an edge-localised mode (ELM) and the associ-ated crash in the pedestal height that terminates the pedestal growth (or, in Quiescent H-mode, a quasi-stationary state with saturated mode). This peeling-ballooning mode is more global than the KBM, typically extending right across the pedestal and often somewhat into the core, so its onset condition is sensitive to both the width and the pressure gradient proile of the pedestal. These two constraints are suficient to determine the pedestal height, width and average gradient, collectively referred to as the pedestal structure.
Calculating the stability and resulting turbulent transport associated with the KBM is a challenging, kinetic problem. The EPED series of models for the pedestal structure approach this challenge by employing simpliied calculations, and ana-lytic its to these calculations, to derive a pedestal-averaged KBM constraint. Local gyroluid and gyrokinetic calcul ations of KBM growth rates and transport indicate that the ininite toroidal mode number, n, ideal magneto-hydrodynamic (MHD)
ballooning mode threshold provides a good approx imation to the pressure gradient at which KBM growth rates and luxes rise to large values [6]. Hence local ideal ballooning threshold calculations can in many cases be used as an accurate proxy for KBM onset. However, such local calcul ations indicate that the central region of the pedestal can in some cases become
‘second stable’; that is, at suficiently low magn etic shear the high n ballooning mode is stable for all pres sure gradients. It is, however, known from inite (but large) n ideal MHD calcul ations that non-local effects can restrict this ‘second sta-bility’ gap and lead to a inite pressure gradient limit, some-what above the irst stability limit [7]. There is also evidence from global gyrokinetic simulations that global effects close off the second stability region to KBMs [8]. The ‘ballooning critical pedestal’ technique used in EPED, employs high-n ideal MHD ballooning calculations and simple functional forms to provide an approximation to the average ballooning limit either with or without local regions of 2nd stability [3]. This leads to a scaling of the predicted pedestal width (in nor-malised lux) ∼β1
/2
p,ped, where βp,ped is a measure of the ratio of
the thermal energy of the pedestal to the energy in the poloidal component of the magn etic ield.
There is signiicant experimental evidence that indicates that the ELM-averaged pedestal width increases sub-line-arly with βp,ped [9–12], consistent with the above argument
for the KBM constraint. In addition, a number of tokamaks, including MAST, NSTX, Alcator C-Mod and DIII-D, have found that the pedestal width, ∆ped, increases as the pedestal
height grows between ELMs at approximately ixed gradient [13, 14]. This is at least qualitatively consistent with the width growing as βp,ped increases between ELMs (while recognising
these parameters are closely coupled). In such cases, the sta-bility threshold (eg in pressure gradient and/or current density) for the global peeling-ballooning mode falls as the pedestal widens between ELMs, ultimately triggering the instability and resulting in the ELM which terminates the pedestal growth. Detailed comparisons of the approach of the pedestal to the EPED constraints have been conducted on DIII-D and Alcator C-Mod, inding that the peeling-ballooning constraint is approached prior to the ELM, with the pressure gradient approximately clamped at the KBM critical value during the inal evolution to the ELM [15–17].
Turning to JET, the EPED constraints give predictions for the pedestal height that agree with experiment to within ±20% [3, 18]. Also the variations of the JET pedestal structure with collisionality, normalised Larmor radius, ρ∗ and normalised
pressure, βN, are found to be qualitatively consistent with the
et al
there are some trends that at irst sight appear to be beyond the EPED model, such as the variation of pedestal height with strong gas pufing on JET [20] and the differences in pedestal structure between the carbon and ITER-like wall [18, 21], as well as the impact of impurity seeding [22]. Furthermore, it is not always the case that the calculated peeling-ballooning stability boundary is reached at the onset of the ELM [23], and it is often the case that the JET pedestal width reduces between ELMs [24], while the pedestal height, and there-fore βp,ped, increases. The EPED model provides a prediction
for the pressure pedestal structure and must take the relative contributions of the density and temperature pedestal proiles as inputs; these are known to inluence stability (and there-fore the EPED prediction—see [25] and references therein). Indeed, the variation of the ASDEX Upgrade pedestal struc-ture with fueling and impurity seeding can be understood in terms of the KBM and peeling-ballooning constraints when the experimentally observed variations in the locations of the density and temperature pedestals are taken into account as inputs to the model [25]—thus, while this effect is beyond the predictive capability of EPED, it is not inconsistent with the physics that underlies it. To understand whether or not the above-mentioned trends of the JET pedestal are consistent with peeling-ballooning and KBM constraints requires a detailed understanding of how the pedestal parameters evolve with varying conditions, and then how the pedestal stability depends on those parameters.
The goal of this paper is to develop an improved under-standing of the physics that inluences the evolution of the JET pedestal between ELMs. This may then help us to iden-tify how to maximise the pedestal height, and so optimise coninement. Speciically, we focus on a detailed pedestal stability analysis of representative discharges to explore the two aspects that underpin the EPED models, and see if we can understand some of the JET pedestal characteristics. First, we employ the ininite toroidal mode number, n, ideal MHD bal-looning mode proxy for the KBM, and explore whether there is evidence that the pressure gradient is locally clamped at this stability boundary during the evolution between ELMs. This proxy has been shown to work well for JET when the plasma is constrained by the irst ballooning stability boundary [24] but, as mentioned above, the situation is more complex when the plasma has n = ∞ ideal ballooning second stability access. We therefore also perform a local gyrokinetic stability analysis of a second-stable JET pedestal to explore the micro-instabilities that exist. Second, we test whether the pedestal evolves towards the peeling-ballooning boundary as the ELM onset is approached, and shed new light on the ELM trigger physics in peeling-ballooning stable situations.
The paper is set out as follows. In the following section, we describe the data set and how it is analysed. Then, in sec-tion 3, we calculate how the pedestal stability evolves between ELMs, and test whether it is consistent with the physics that underpins the EPED model. We then study the ELM charac-teristics in section 4, comparing situations where the plasma does reach the peeling-ballooning boundary with those where it does not. We close in section 5 with conclusions and sugges-tions for further research.
2. Data set
The data we consider are taken from power and gas-puff scans in the JET tokamak with the ITER-like wall (JET-ILW), oper-ated at ixed magnetic ield, 1.7 T, and current, 1.4 MA. We focus on low triangularity, δ = 0.2, discharges. This data set is described in more detail in [23]; here we provide a brief overview for completeness.
Fuelling is provided by three different levels of gas pufing: 2.8, 8.4 and 18 × 1021 e s−1 (low, medium and high), while the heating power is also varied to provide a range of
βN, which is the normalised plasma pressure. For the low
gas puff power scan, the divertor strike points were close to the corners and βN was varied from ~1.5 up to ~3, while for
the high gas puff scan the outer strike point was on the hori-zontal target (tile 5) and the variation in βN was from ~1 to
~2. Plasma density and temperature proiles are reconstructed from high resolution Thomson scattering (HRTS) by aver-aging over multiple ELM cycles, binning the data according to the timing of the HRTS laser pulse relative to the next ELM: 0–20%, 20–40%, 40–60%, 60–80% and 80–99% of the ELM cycle [26]. The ion temperature is assumed to be equal to the electron temperature. We ignore the irst period, 0–20%, as it is likely affected by the physics of the previous ELM crash, and perform four mtanh its to the set of proiles in each of the remaining time windows. Four high resolution equilibria are reconstructed by solving the Grad–Shafranov equation using the resulting proile its; these serve as a basis for the stability analyses.
A previous pedestal stability study [23] focused on proiles taken from averages over the last 30% of the ELM cycle. In that work, an ideal MHD stability analysis showed that for the low gas puff scenarios, the peeling-ballooning mode is mar-ginally stable, and therefore consistent with the ELM trigger. However, for high gas puff scenarios, the peeling-ballooning mode stability boundary is typically not reached at the ELM onset (except at low βN), suggesting that it alone cannot
explain the ELM trigger in these discharges. Our aim in this paper is to study the time evolution of the pedestal structure between ELMs to understand how it approaches the ELM trigger and what is the dominant physics that underlies JET pedestal dynamics.
3. Pedestal stability study
We have analysed the evolution of the pedestal height and width for eleven δ = 0.2 discharges that span the range of gas puff and βN discussed in section 2, comparing these to the
marginal stability boundary for the peeling-ballooning mode (evaluated using ELITE [27, 28] for the equilibria constructed from the 80–99% time window) [29] (see appendix for more details on the methodology). We ind four different kinds of behaviour, with examples of each shown in igures 1(a)–(d):
1. The pedestal width is approximately constant (perhaps broadening slightly) as the ELM is approached, and the peeling-ballooning boundary is reached at the ELM onset—igure 1(a): low gas puff, βN = 1.3.
et al
2. The pedestal width evolution between ELMs has no clear trend, but the peeling-ballooning boundary is reached at the ELM onset—igure 1(b): low gas puff, βN = 1.7.
3. The pedestal width evolution between ELMs has no clear trend, and the peeling-ballooning boundary is not reached at the ELM onset—igure 1(c): high gas puff, βN = 1.7.
4. The pedestal width shows signs of broadening as the ELM is approached, but the peeling ballooning boundary is not reached at the ELM onset—igure 1(d): high gas puff, βN = 1.9.
We study representative examples for each of these cases in this section.
3.1. Peeling-ballooning constraint
Figure 1(a) shows the evolution of pedestal width and height between ELMs for discharge 84797, which has low gas puff and low βN = 1.3. We see that the peeling-ballooning
boundary is reached at the onset for the ELM, as is typically the case for low gas puff in JET-ILW [23]. The pedestal width irst reduces as it recovers from the previous ELM and then, within error bars, is consistent with being approximately con-stant as the ELM is approached—perhaps slightly increasing. The EPED assumption that the peeling-ballooning mode is triggered at the ELM onset is therefore satisied in this case. Figure 1(b) is for discharge 84795, which is again low gas puff, but a higher βN = 1.7. Again we see that the discharge
is peeling-ballooning limited at the time of ELM onset, but there is no clear trend in the pedestal width and, if anything,
it is decreasing as the ELM is approached, while the ped-estal height (and therefore βp,ped) remains approximately
constant. Figure 1(c) is for discharge 87350, which has the same βN = 1.7 as igure 1(b), but at high gas puff. Again we
observe a falling pedestal width as the ELM is approached, but this time the discharge is clearly well short of the peeling-ballooning boundary at the time the ELM is triggered. Finally, igure 1(d) is for discharge 87342 which also has high gas puff but a slightly higher βN = 1.9. For this case, the pedestal
width broadens towards the ELM onset, but the peeling bal-looning boundary is again not reached.
In summary, we ind that the peeling-ballooning boundary is typically reached in JET-ILW discharges when there is low gas puff, but at higher gas puff the pedestal is often far from this boundary (except at the lowest βN), suggesting that additional
physics is required to explain the ELM onset in these cases. This is consistent with earlier results presented in [23] which provide a more detailed analysis of the peeling-ballooning sta-bility close to the time of ELM onset, including their position relative to the stability boundary plotted in terms of current density and pressure gradient. Speciically, igure 9(b) of [23] shows discharge 87341 (medium gas puff, βN = 2), which
only approaches second stable access close to ELM onset and does not reach the peeling-ballooning boundary; igure 11(a) of [23] shows discharge 84794 (low gas puff, βN = 2.76)
which has second stability access throughout most of the ELM cycle and does reach the peeling ballooning boundary. Finally, we note that there is no clear, consistent relationship between the inter-ELM evolution of the pedestal width and
[image:6.595.120.480.61.336.2]βp,ped (which is proportional to the pedestal height).
Figure 1. Evolution of pedestal height and width for JET discharges (a) 84797, (b) 84795, (c) 87350 and (d) 87342 (1: 20–40% blue diamond; 2: 40–60% red diamond; 3: 60–80% green diamond; 4: 80–99% purple diamond). The curve shows the peeling-ballooning boundary evaluated for the 80–99% period. (a) and (b) are low gas puff, while (c) and (d) are high gas puff.
et al
3.2. KBM constraint
We now turn to consider the KBM constraint in a little more detail, and address the question of whether the local pedestal gradient is limited by this mode. Saarelma et al [24] studied this in two high triangularity discharges in JET with the carbon wall, JET-C. In particular, they generally found good agreement between the threshold pressure gradient predicted by the ininite-n ideal MHD ballooning mode and the KBM threshold evaluated using the local gyrokinetic code, GS2. For this study, our main focus is therefore on comparing the measured pedestal pressure gradient with the local ideal bal-looning threshold, assumed to be a reliable proxy for the onset of the KBM.
3.2.1. Low gas puff discharges. Figure 2 compares the mea-sured proile of the normalised pressure gradient, α, with the calculated threshold for ideal MHD ballooning modes for the discharge 84797 (igure 1(a)). This threshold is calcu-lated using HELENA [30], which scales the pressure gradient (α) coeficient of the curvature drive until marginal stability is reached—the threshold is this scaled value of α, and is accurate provided the equilibrium is close to marginal stabil-ity (we return to this important issue below). Recall that this discharge does reach the peeling-ballooning mode bound-ary at ELM onset. Note the region of higher α in the range 0.96 < ψ < 1, which corresponds to the edge transport barrier of the pedestal region. It is remarkable how closely the mea-sured pedestal pressure gradient tracks the theoretical thresh-old as it evolves, the threshthresh-old increasing by almost a factor of 2 between ELMs. Finally the pressure gradient is suficient to drive the peeling-ballooning mode, triggering the ELM and
collapse of the pedestal, for the cycle to then repeat. In this case we have good quantitative agreement with the two phys-ics hypotheses underpinning EPED—the local pedestal gra-dient is constrained by KBMs, and the pedestal evolution is terminated by the onset of a global peeling-ballooning mode in the 80–99% window, triggering an ELM. A key point is that while this provides strong evidence that the pedestal evo lution is constrained by the KBM, this is not a constant pressure gra-dient constraint—the threshold increases through the ELM cycle. We shall return to consider this in more detail shortly.
The error bar in α is calculated by irst using the its to the Thomson data for electron density and temperature to derive the uncertainties in the pedestal parameters (width, height, slope, etc). Thousands of calculations of pressure gradient were then derived, generated by Monte Carlo with a Gaussian distribution in the parameters that contains the calculated uncertainty. This provides a distribution of pressure gradients, and the error bar provided is the 1σ width of that distribution.
[image:7.595.140.458.61.317.2]We now proceed to consider discharge 84795, which was also at the peeling-ballooning limit at the time of the ELM crash, but the pedestal width evolution is more complex (see igure 1(b)). Figure 3 compares the measured edge pressure gradient proile with the ideal MHD ballooning limit. We see it is very similar to discharge 84797, which also hit the peeling-ballooning limit, but the ballooning threshold starts to increase in the pedestal somewhat earlier in the cycle, allowing the pressure gradient to also increase earlier. Again, the pressure gradient tracks the threshold throughout, only lagging behind in the last time phase when the threshold increases very rapidly. Therefore, despite the somewhat com-plex width evolution, the pedestal dynamics are again con-sistent with the physics that underpins the EPED model—the
Figure 2. Comparison of the measured edge pressure gradient proile (blue, lower curve) with the ideal MHD ballooning limit (red, upper curve) as a function of normalised lux for JET-ILW discharge 84797 for each time window: (a) 20–40%, (b) 40–60%, (c) 60–80% and (d) 80–99%. ψ is the poloidal lux, normalised to ψ = 1 at the separatrix. The vertical line is the 1σ error bar in the measured value of the maximum α.
et al
ELM is triggered by the peeling-ballooning mode and the gra-dient tracks the ideal MHD ballooning limit as it increases, except in the inal time window when the threshold increases rapidly. We will now explore why the threshold is increasing so strongly.
In a simple model, one might assume the KBM clamps the pressure gradient at a ixed threshold. Figures 2 and 3 show that this is not always the case, and in fact the threshold pres-sure gradient can rise signiicantly between ELMs. To under-stand this, we show in igure 4 the ideal ballooning stability using so-called s-α plots, where s is the magnetic shear, which decreases with increasing current density. We analyse for discharge 84795 the surface ψ = 0.98, which is close to the maximum in the pressure gradient, and show in igure 4 the results for each of the four inter-ELM time slices. Note that these igures illustrate a regime of stability at low pressure gradient, the irst stability region, and then a second region of stability at higher pressure gradient. The two stable regions connect at suficiently low shear, i.e. suficient current den-sity, providing the possibility of access to the second stability region. These features are highlighted in igure 4(a). The width of this region of ‘second stable access’ (i.e. how much current density is required to access it) depends on a number of factors in separatrix geometry, including shape, poloidal
β and safety factor [31]. The marginal stability contours in the s-α plots are derived by modifying the equilibrium and ballooning stability in a self-consistent way as s and α are varied, retaining the impact on local shear [31]; for HELENA the curvature drive in the ballooning equation is simply scaled until marginal stability is found, without retaining the modi-ications to the equilibrium and, speciically, does not take account of the modiication to local shear. Both approaches
are meaningful estimates when the equilibrium is close to marginal stability and therefore α requires little scaling to reach the stability boundary. However, because the HELENA approach does not include the impact of varying α on local shear it can lead to unphysical stability boundaries when the equilibrium is far from marginal stability (and hence requires signiicant scaling of α). In particular, local shear is key to second stability, which is why igures 3(b)–(d) indicate an unphysical threshold at ψ = 0.98, while the associated s-α
plots of igures 4(b)–(d) show the plasma to be clearly in the second stable regime, with no threshold in α.
[image:8.595.148.455.59.320.2]In the early phase of the cycle, igure 4(a), the plasma does not have suficient current density to access the second stability regime, so the pressure gradient is clamped at a low level—the irst stability boundary. However, later on, ig-ures 4(b) and (c), perhaps as the current starts to build on a current diffusion timescale, the shear is reduced, and the equilibrium starts to get into the second stable access region, where the threshold α increases rapidly for a small decrease in magnetic shear (i.e. small increase in current density). The current density in the pedestal is dominated by the bootstrap current, which is proportional to the pressure gradient, but also depends on collisionality, with low collisionality plasmas having higher bootstrap current density. On the other hand, the current density can only grow on a current diffusion time—if this is longer than the energy diffusion time that the pressure gradient grows on (i.e. at high temperatures where the resis-tivity is low) then the current density will lag behind its boot-strap value. Thus, the dynamics of how s and α vary relative to each other between ELMs, and therefore whether one has access to second stability, is likely subtle and depends on the transport processes as well as equilibrium plasma parameters.
Figure 3. Comparison of the measured edge pressure gradient proile (blue, lower curve) with the ideal MHD ballooning limit (red, upper curve) as a function of normalised lux for JET-ILW discharge 84795 for each time window: (a) 20–40%, (b) 40–60%, (c) 60–80% and (d) 80–99%. The vertical line is the 1σ error bar in the measured value of the maximum α.
et al
In our calculation we have assumed the current density is the fully penetrated bootstrap current.
It is worth commenting on the impact of the error in α. Because the threshold (red curve in igures 2 and 3) depends on the local bootstrap current density, which in turn depends on pressure gradient, it will also have an error bar. Speciically, if the true pressure gradient were at the upper end of its error bar, then the current density would be higher than we have used for the threshold calculation, the plasma would be deeper in second stability and the HELENA prediction for the threshold would be higher (in such plasmas in close proximity to the second stability regime). Thus there is a robustness of the relative positions of the experimental pressure gradient and the threshold to uncertainties in the pressure gradient.
We can now start to understand the complex behaviour of the pedestal width evolution. On several tokamaks, this width is observed to expand monotonically throughout the inter-ELM period at ixed gradient [13, 14]. There is some evidence that micro-tearing modes may play a role in the dynamics [13, 24, 32], but a complete understanding of the physics that controls the width evolution is not yet available. In these JET discharges, the steepest gradient region which deines the pedestal is that part which has access to second sta-bility. Therefore, the pedestal width evolution is determined at least to some extent by the width of the region that has second stable access—if this is narrow, the pedestal width will narrow as it pushes up into second stability during the latter
part of the ELM cycle. This width of second stable access is strongly inluenced by shaping and the amount of bootstrap current density lowing for a given pressure gradient, leading to possible dependencies on collisionality and resistivity (e.g. impurity species).
[image:9.595.116.481.61.372.2]As the plasma starts to enter the second stable access region, the KBM threshold rises and we see that the equilibrium gra-dient tracks it closely at irst, providing strong evidence for the KBM constraint on the pressure gradient. However, once the plasma is deeply into the second stable access region, the ininite n ideal ballooning proxy predicts no threshold to the KBM. It is possible that other micro-instabilities play an important role determining the gradient in this situation, such as microtearing modes and electron temperature gradient (ETG) driven modes [33], or that kinetic effects can destabilise the KBM relative to the ideal ballooning mode in such second stable access regimes. Another possibility is that global effects associated with inite (but large) n KBMs cause a coupling to the kink mode that restricts the second stable access, as found in global ideal MHD calculations [7, 28]. The coupling to the kink mode cannot be tested with gyrokinetic codes, as the necessary terms are formally O(1/n), and are ordered out of the standard gyrokinetic theory. Nevertheless, they can be important when the current density gradient is large, as is the case for a second-stable pedestal with strong bootstrap current [29]. It is interesting to note that global simulations (without the kink drive) of the KBM do indicate they can be unstable
Figure 4. s-α diagrams for the ψ = 0.98 surface of discharge 84795 for (a) the 20–40% time window; (b) the 40–60% time window; (c) the 60–80% time window, and (d) the 80–99% window (note, β′ is proportional to the normalised pressure gradient parameter, α). The red star denotes the equilibrium parameters.
et al
when local calculations indicate second stability [8], so it is likely that they will play an important role in pedestal trans-port even in second stable plasmas.
To explore a possible role for local kinetic instabilities in discharge 84795 at ψ = 0.98 just before the ELM where the pedestal is deep in the second stability region (corresponding to igure 4(d)), we have performed some local linear gyrokin-etic stability calculations using GS2 [34]. As expected from our ideal ballooning analysis, and as found in [24], the con-ventional KBM (which propagates in the ion diamagnetic drift direction) is found to be stable within such a local analysis. We have identiied three other ion-scale instabilities all with comparable growth rates and all with twisting parity:
(1) One which propagates in the electron diamagnetic drift direction with features of the hybrid trapped-electron/ kinetic ballooning mode (hybrid TEM/KBM) identi-ied in [35], having a growth rate that is sensitive to the parallel component of the magnetic ield luctuations and collision frequency.
(2) An electrostatic mode that propagates in the ion direction. (3) A second electrostatic mode which propagates in the ion
direction but with an unusually large radial wavenumber.
We also ind an instability at electron scales which has fea-tures of the ETG mode. While simple mixing length estimates suggest the transport would be dominated by the ion scale instabilities, it is necessary to perform non-linear simulations and retain low shear in order to make a deinitive statement about their relative transport contributions.
The different ion scale modes mentioned above have been identiied by performing scans in the pressure gradient param-eter β′, scaling the (logarithmic) density and temperature gradients to enhance β′, but keeping their ratio, ηi,e, ixed for
both ions and electrons. The results from two approaches are shown in igure 5: one where the local equilibrium is adjusted self-consistently (blue curve, circle symbols), and one where only the local instability drive is modiied (similar to the HELENA approach for ideal ballooning modes). We have
chosen kyρs = 0.1, (i.e. n = 24) where ky is the poloidal mode number and ρs is the sound speed ion Larmor radius—the results for other kyρs values are qualitatively similar. Below the equilibrium value of β′, denoted by the vertical dashed line in igure 5, we see lipping between modes (1) and (2)—these modes have very similar growth rates, but propagate in oppo-site directions (GS2 reveals the most unstable mode for given plasma parameters). As we increase β′ above the equilibrium value, adjusting the equilibrium in a self-consistent way (as for the s-α plots of igure 4), there is a modest increase in the growth rate and a new dominant mode emerges, propa-gating in the ion direction (blue curve, closed circle symbols of igure 5). While the direction of propagation is consistent with the KBM, there are three features that suggest it is not this mode: (1) we ind an increase in its growth rate when magnetic luctuations are switched off, while the KBM is electromagnetic; (2) the frequency is independent of β′ while the KBM mode frequency is expected to follow the ion dia-magnetic frequency (i.e. proportional to β′), and (3) there is no dramatic rise in growth rate beyond a threshold as expected for the KBM. Furthermore, the ballooning eigenfunction for this mode has a large radial wavenumber (the ballooning angle, θ0 > 2π). In contrast, the inconsistent scan, increasing
only the instability drive, (yellow curve, cross symbols of igure 5) reveals both the strong increase in growth rate and a frequency proportional to β′ above a threshold in the region of |β′| = 0.21—classic signatures of the KBM. The conclusion is that according to the local theory, the KBM is stable in the second stable region of this discharge, and reliable KBM sta-bility calculations likely require gobal effects to be retained.
We have also searched for micro-tearing modes, varying the ratio of logarithmic derivatives of temperature to density gradients at the equilibrium pressure gradient, but found no evidence to support a signiicant role for them in the pedestal dynamics at this position in the pedestal where the pressure gradient is a maximum.
[image:10.595.125.480.56.208.2]To summarise the results for these two low gas puff discharges, we have shown that the pedestal evolves to a
Figure 5. (a) Growth rate γ and (b) mode frequency ω from a local solution to the gyrokinetic equation provided by the GS2 code for the 80–99% window of discharge 84795 at ψ = 0.98, which is in the ideal ballooning second stability region (corresponding to igure 4(d)). We have ixed kyρs = 0.1 (i.e. n = 24), and ω < 0 corresponds to propagation in the electron diamagnetic direction. The vertical dashed line
denotes the equilibrium value of normalised pressure gradient, β′, about which we perturb by increasing density and temperature gradients at the same rate (i.e. ixed ηi,e). The blue curve with full circles shows the result for self-consistently modifying the local equilibrium,
while the yellow curve with crosses shows the result when the equilibrium is not adjusted with β′; γ and ω are normalised to vth/a (vth is the
thermal velocity and a the minor radius). The horizontal bar is the 1σ error in the experimental value of β′.
et al
second-stable inal state at the ELM onset consistent with KBM constraining the local pressure gradient through much of the ELM cycle and peeling-ballooning modes terminating the evolution in an ELM crash. Thus the physics is consistent
[image:11.595.140.458.61.320.2]with that which motivates the EPED model, but the dynamics controlled by the KBM can be more complex than a widening pedestal at ixed gradient, especially for these plasmas with second stability access.
Figure 6. Comparison of the measured edge pressure gradient proile (blue, lower curve) with the ideal MHD ballooning limit (red, upper curve) as a function of normalised lux for JET-ILW discharge 87350 for each time window: (a) 20–40%, (b) 40–60%, (c) 60–80% and (d) 80–99%. ψ is the poloidal lux, normalised to ψ = 1 at the separatrix. The vertical line is the 1σ error bar in the measured value of the maximum α.
Figure 7. Comparison of the measured edge pressure gradient proile (blue, lower curve) with the ideal MHD ballooning limit (red, upper curve) as a function of normalised lux for JET-ILW discharge 87342 for each time window: (a) 20–40%, (b) 40–60%, (c) 60–80% and (d) 80–99%. ψ is the poloidal lux, normalised to ψ = 1 at the separatrix. The vertical line is the 1σ error bar in the measured value of the maximum α.
[image:11.595.147.455.384.635.2]et al
3.2.2. High gas puff discharges. Let us now turn to consider the high gas puff discharges that do not reach the peeling-ballooning stability limit. In igure 6 we show how the mea-sured pressure gradient proile compares with the ballooning stability threshold for discharge 87350, which has the same
βN = 1.7 as the low gas puff discharge 84795. We see that
in this case the pressure gradient is again constrained just below the ideal ballooning boundary, indicating that the KBM is playing a key role, particularly as the ELM is approached. However, there is no time when the threshold pressure gradi-ent rises sharply, although there is just the irst sign of a slight increase in the inal time window. This indicates that the ped-estal does not have second stability access in this higher gas puff discharge, presumably because the bootstrap current is suppressed at the higher collisionality. Thus the normalised pressure gradient is constrained at a lower value than the low gas puff cases and the peeling-ballooning boundary is not reached. The slight increase in the ideal ballooning threshold in the inal time window may indicate that this plasma is close to having second stable access—if so, that might be having an impact on the pedestal width, but we would need more accu-rate estimates of the current density to be sure.
Finally, in igure 7 we consider the higher βN = 1.9
dis-charge 87342 which also does not reach the peeling-ballooning boundary. This shows very similar behaviour to discharge 87350. Speciically, the pressure gradient is constrained below, but near to, the ideal MHD ballooning boundary, par-ticularly in the second half of the ELM cycle, indicating a role for KBM physics. Again, there is little sign of any access to second stability. It is interesting to note from igure 1(d) that the pedestal width of this discharge does broaden as the ELM is approached, as observed in other, smaller tokamaks.
3.3. Pedestal stability overview
In all 11 low triangularity discharges we have analysed [29] (beyond those described in detail here), if the pedestal has access to second stability, then it reaches the peeling-bal-looning boundary at the ELM onset, and the local pressure gradient is constrained below the local ideal ballooning proxy for the KBM (and close to the threshold except at radii where the plasma is in the second stability region). As second sta-bility is predicted to open up, indicating an increase in the
KBM threshold, the pedestal pressure gradient rises into it. These results are consistent with KBM and peeling-ballooning playing a dominant role in the physics controlling the pedestal evolution and ELMs. This provides supporting evidence for the physics underlying the EPED model, even though the ped-estal width does not always increase monotonically between ELMs at ixed pressure gradient. If the pedestal does not have access to second stability, then the gradients are constrained below, and close to, the predicted ideal ballooning proxy for the KBM threshold as the ELM is approached, but the peeling ballooning boundary is not reached. This then begs the ques-tion of what triggers the ELM if the peeling-ballooning boundary is not reached? To begin to address this question, we consider the ELM characteristics in the following section.
4. ELM characteristics
Type I ELMs are widely believed to be a consequence of peeling-ballooning modes. However, in section 3 we pre-sented evidence that indicates the peeling-ballooning stability boundary is not reached in the high gas puff JET-ILW dis-charges we have considered (consistent with earlier work, which also showed that it is reached in high gas puff discharges at lower βN [23]). In this Section we will seek to shed more
light on the underlying physics of the ELM trigger in these cases by characterising their behaviour in more detail, and comparing discharges where the peeling-ballooning boundary is reached at ELM onset to those where it is not.
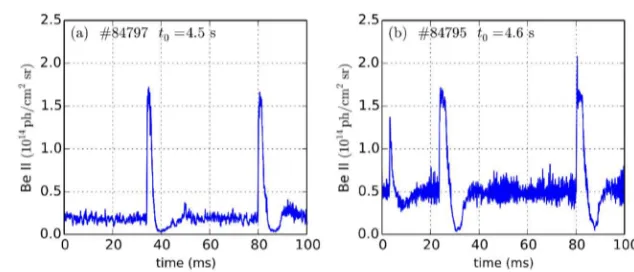
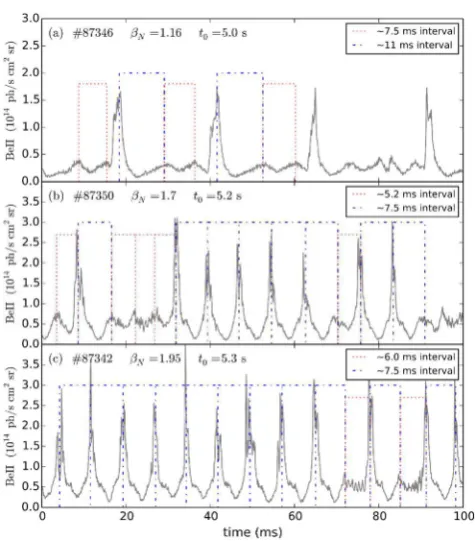
In igure 8, we show Be II emission integrating over the ten chords which view the inner divertor for the two low gas puff discharges we have analysed, 84797 and 84795, both of which reach the peeling-ballooning boundary at ELM onset. They show the classic sharp rise in emission and slower decay that is characteristic of Type I ELMs. In igure 9 we show the same traces, but for three high gas puff discharges, including shot numbers 87350 and 87342 presented earlier, and now also including a lower βN = 1.16 discharge that has lower heating
[image:12.595.136.453.59.195.2]power, 87346; this third discharge is close to the peeling-ballooning stability boundary at ELM onset [23]. Notice that the ELMs in igures 9(b) and (c) have a different character to the peeling-ballooning triggered ELMs of igure 8— spe-ciically they are more symmetric about the peak in emis-sion and there are shoulders in emisemis-sion before and after the
Figure 8. Emission of Be II from the inner divertor, starting at time t0, showing the ELMs in the low gas puff discharges (a) 84797 and (b)
84795, which do reach the peeling-ballooning boundary at the ELM onset time.
et al
ELM spike. Consider irst discharge 87350 in igure 9(b). At irst sight there are two types of periodic behaviour evident in this trace—a low amplitude oscillation and periodic, sharp spikes which are the signatures for ELM-events. The dashed boxes show the period between the peak emission of two con-secutive events, independent of whether they are an oscilla-tion or a spike. All the higher blue, dashed boxes have a time period of 7.5 ms and all the lower red, dotted boxes have a time period of 5.2 ms. It is remarkable how regular the events are. Following each spike, the time to the maximum emission of the next event is 7.5 ms, independent of whether it is an oscillation or a spike. Following each oscillation, the time to the next event is 5.2 ms, again independent of whether it is an oscillation or a spike.
A possible interpretation is that the oscillation has a well-deined frequency, and can trigger an ELM as it approaches its maximum amplitude. The resulting crash caused by the ELM takes the plasma slightly longer to recover from, leading to the longer period following an ELM than fol-lowing an oscillation. If this interpretaton is correct, then igure 9 indicates the coupling between the oscillation and ELMs is β-dependent: at higher βN, an ELM is triggered at
the maximum amplitude of almost every oscillation (igure 9(c)), while at lower βN (igure 9(a)) the ELMs do not appear
to be paced by the oscillation (which is barely discernable for this discharge) at all. We will see below that this trend with βN is not observed for the low gas puff discharges
ana-lysed, however, so it seems unlikely that βN is the only
con-trol parameter.
To explore this triggering in a more statistical sense, we plot in igure 10 the distribution of ELM periods throughout each of the three high gas puff dicharges analysed. Note how distinct, narrow bands of ELM periods form for discharges 87350 (c) and 87342 (e)—the lowest band corresponds to an ELM being triggered on the irst oscillation; the next band to an ELM triggered after two oscillations, and the highest one after three oscillations. For the lowest βN case (a) there
is no sign of bands forming, and little evidence for a correla-tion between the oscillacorrela-tions and the ELMs. The coupling gets stronger for the higher βN cases (c) and then (e). The ELM
period probability distributions are shown in igures 10(b), (d) and ( f ). For the lowest βN (igure 10(b)) there is a broad
dis-tribution of relatively long ELM times; for medium βN (igure
10(d)) the ELM periods are signiicantly shorter, and cluster around the harmonics of the oscillation; for higher βN (igure
10( f )) the majority of ELM periods are in the irst harmonic, with a few in the second (indicating almost every oscillation triggers an ELM).
A similar banding of ELM periods was observed in [36, 37] by averaging over many similar discharges. Here we observe such features even within a single discharge.
It is interesting to note that of the three high fuelling dis-charges analysed, the stronger the apparent coupling between the oscillations and the ELMs (i.e. the more ELMs that fall in the lower band of ELM periods), the further the pedestal is from the peeling-ballooning boundary. This, together with the banding of the ELM periods, provides evidence that (a) the oscillations are pacing the ELMs at a frequency which is higher than their natural frequency, and (b) the consequent triggering of the ELM before the peeling-ballooning boundary is reached leads to a degraded pedestal and hence reduced coninement. To test this, we have also looked for the oscil-lation in Be-II emission in the low gas puff discharges which do reach the peeling-ballooning boundary. A careful inspec-tion reveals that the oscillainspec-tion is there, but the effect on ELM pacing is reduced or completely absent. Indeed, igure 11(a) for the higher βN = 1.7 low gas puff discharge 84795 shows
there is no band at the short ELM period matching that of the oscillations, and there is only a broad range of ELM frequen-cies at the longer, natural periods. On the other hand, in the lower βN = 1.3 low gas puff discharge 84797 there is a clear
band of ELMs at period 7–8 ms which matches the oscillation period, but most of the ELMs have a broad distribution across the longer periods. Note, however, that the few (paced) ELMs that follow closely after the preceding ELM in this discharge were not included in the averaged proile data discussed in section 2, so the stability analysis of section 3 for 84797 is per-tinent only to the ELMs with longer periods, and not the low period band paced by the oscillation. There is thus consistency in the picture that when the ELMs are not paced by the oscilla-tion, they are triggered at the peeling-ballooning boundary. It is interesting to note that, unlike the high gas puff discharges, in these low gas puff discharges the coupling between the oscillations and ELMs does not apparently increase with βN.
[image:13.595.52.290.59.330.2]Our results indicate that it is important to identify the mechanism behind the oscillations in order to improve ped-estal performance. We have looked at many discharges,
Figure 9. Emission of Be II from the inner divertor, starting at time t0, showing the ELMs in JET-ILW discharges (a) 87346, (b) 87350
and (c) 87342 all with high gas puff but with different (increasing) βN. The dotted and dashed boxes denote the time intervals shown in
each panel (the different heights of these merely aid distinguishing between them).
et al
and in most the oscillation starts after several ELMs occur. However, we have found some examples where the oscilla-tion precedes the irst ELM (discharge 89238, for example, which has Ip/B = 2.0/2.2 MA/T and the outer strike point is on
the horizontal target plate inboard of the pumping duct). This
provides further evidence that the oscillation is not simply a
‘ringing’ effect caused by the previous ELM. The oscillations are also seen in other line emissions and all are in phase with each other. Figure 12(a) compares the emission for Be-II with
[image:14.595.115.484.58.478.2]Dα, C-III and W-I for the high gas puff discharge 87350 where Figure 10. ELM separation time through the pulse for discharges (a) 87346, (c) 87350 and (e) 87342 and their corresponding ELM time probability distributions (b), (d) and ( f ).
Figure 11. ELM separation times for the low gas puff shots (a) 84795 (βN = 1.7) and (b) 84797 (βN = 1.3).
[image:14.595.123.480.518.666.2]et al
the oscillations, eg between 5.21 s and 5.23 s are clearly vis-ible in phase in all channels. The ELM spikes also correlate well for the C-III, W-I and Be-II lines. However, note that for the Dα emission, the ELM corresponds to a reduction in the
emission. Such ‘negative ELMs’ have been reported earlier, such as in [38]. There it was argued that the inner divertor was in a detached regime between ELMs, where the Dα emission
is a consequence of recombination, and then the ELM power lux results in an increase in the number of ionisations per Dα
photon, reattachment of the inner divertor, and a consequent decrease in emission. However, between the ELMs in 87350,
we see that the Dα rises and falls in phase with the Be II in
the oscillations so it is not so clear that this interpretation also holds in this case. This rich divertor physics could shed addi-tional light on the physics of high gas puff discharges, with possible consequences for ELM heat loads (e.g. on ITER) and should be explored further in the future.
To probe the physics of the oscillation in more detail, we compare in igure 13 the Be-II light emission from the 10 channels that view the inner divertor for the medium βN, high
[image:15.595.135.456.59.313.2]gas puff discharge 87350 (see igure 14). The data we showed in previous igures combines all these channels. Here we can
Figure 12. A comparison of emission from lines of Dα, C-III, W-I and Be-II showing that they all exhibit the oscillations in phase for (a) the high gas puff discharge 87350 and (b) the low gas puff discharge 84797. Note the ELMs in the high gas puff discharge (a) correspond to a drop in the Da emission, rather than the more typical positive spike seen in the low gas puff discharge (b).
Figure 13. Be II light emission showing clear ELMs and fainter oscillations (upper) and the corresponding prism contour plot, emphasising changes in Be II emission, showing oscillations and ELMs. The channels are viewing the inner divertor region (see right-hand axis for major radius); channels 4–8 view the inner target. Shot 87350—medium β, high gas puff, starting at time t0 = 5.2s.
[image:15.595.98.504.364.579.2]et al
see that the oscillation, more clearly visible in the lower prism plot, is strongest in those channels which directly view the divertor target (channels 4–8), while the ELM is seen across all channels. Viewing the outer divertor yields the same result, exactly in phase with the inner divertor. There is a similar picture from the other views—only those channels viewing the divertor target see the oscillation in Be-II, but the ELM is seen in all channels. The data in igure 13 seem to rule out a signiicant displacement of the whole plasma as a possible mechanism for the oscillation in Be II emission. Speciically, note for all channels 3–7, the emission rises and falls at the same time, rather than the emission peak migrating from one channel to another, as might be expected if the plasma (strike-point) is moving. This suggests that the Be-II oscilla-tion is due to a pulse of heat and particles that travels along the scrape-off layer, arriving at the two divertor targets at the same time, and creating a plume of Be that results in the observed emission there. If so, we are not directly observing the origin of the oscillation by viewing the Be-II emission—rather, a symptom of it. An alternative explanation is provided in [39] related to an instability of the detachment front, as follows. Impurities released from the target plate strike point enter the divertor region, radiate and cool the plasma there. The divertor then detaches, reducing the heat lux to the target plates so that less impurities are released. The impurities in the divertor then diminish, radiation falls, the divertor plasma heats back up and re-attaches for the process to cyclicly repeat.
To understand whether the fundamental drive for the Be II oscillation originates from an instability of the core/ped-estal, we have studied Mirnov coil data, which reveals high frequency activity across a range 150–350 kHz with a modu-lated amplitude. Furthermore, for all the coils we have looked at, over a range of poloidal and toroidal locations, this mod-ulation of the amplitude is in phase with the oscillations in the Be-II emission. Before we consider our data set, we show in igures 15 and 16 a particularly striking example from the discharge 82806 (Ip/B = 2.5/2.65 MA/T, higher triangularity
[image:16.595.54.289.62.228.2]δ = 0.4 and the outer strike point is on the horizontal target plate inboard of the pumping duct); this is convenient because of the larger number of oscillations that occur between ELMs. This discharge is one of a series discussed in [22]. Figure 16(a) shows the oscillations in the Be-II emission compared to the Mirnov coil data in igure 16(b). This coil is positioned out-board of the plasma, above the mid-plane, but all coils we have looked at, across a range of poloidal and toroidal angles, show the same behaviour, with the modulation in the ampl-itude all in phase with each other. The high frequency oscil-lations are broad-band, typically in the range 150–350 kHz
Figure 14. Lines of sight for the Be II emission data shown in igure 13 with channel #1 at the left increasing to channel #10 at the right. Superimposed is the separatrix for shot 87350 at t = 5.7s. The blue line denotes the line of sight for channel #6, which is close to the strike point—the peak in emission is between channels
#5 and #6.
[image:16.595.310.544.64.248.2]Figure 15. Spectrogram for JET discharge 82806, showing high frequency (150–350 kHz) luctuations in magnetic ield with modulated amplitude occurring between the ELMs (characterised by the events that span all frequencies).
Figure 16. (a) Oscillations in the Be II light emission from the inner divertor during an inter-ELM period in discharge 82806 (red curve shows smoothed data) compared to (b) Mirnov coil data from the T001 coil positioned outboard of the plasma above the mid-plane, and (c) luctuation amplitude integrating over the 100– 250 kHz frequency range.
[image:16.595.313.544.309.542.2]et al
(see igure 15), modulated in phase with the Be II emission. In igure 16(c) we show the magnetic luctuation amplitude, which we have determined by isolating the high-frequency activity using a 100–250 kHz band-pass ilter and then cal-culating the analytic signal amplitude, which can be obtained using the Hilbert transform [40]. This yields the instantaneous amplitude of the signal as a function of time. The analytic signal amplitude time-series has been smoothed with a 0.1 ms Gaussian moving average to yield the mean luctuation level over time shown. Note that in this case, the Mirnov signal falls to background levels around the minima in the Be-II emission, indicating that the activity is switching off between successive bursts.
In igure 17 we compare the Be II emission with the luctu-ation amplitude derived from the same Mirnov coil as studied in igure 16, but this time for our high gas puff, medium βN
discharge 87350. Again we see enhanced high frequency magn etic luctuations associated with the oscillation in the Be-II emission. There is a difference between this discharge and that of igure 16 however, in that the magnetic signal does not always fall to background levels between oscillations, but stays high relative to the background until the onset of the ELM.
For the discharges studied in [36, 37], it was postulated that the ELMs might be paced by an oscillation of the plasma position caused by the control system. Such an explanation would help to explain why the oscillation period is so constant across many discharges. However, it is dificult to explain the high frequency magnetic activity in terms of bulk motion of the plasma and, as mentioned above, it is dificult to reconcile a bulk plasma motion with the Be-II emission across the chan-nels viewing the inner divertor (igure 13). Also, one would expect the amplitude of the Mirnov activity of coils above and below the mid-plane to be out of phase if the plasma were oscillating up and down, and we see them very much in phase. A rapidly rotating, high n, ilamentary magnetic structure near
the plasma edge that repetitively pushes out and relaxes back to provide the amplitude modulation seems a more likely explanation, as we discuss in the following Section.
5. Conclusions
We have considered the pedestal evolution and ELM charac-teristics of JET-ILW low triangularity discharges. We have found that for low gas puff the pedestal often has second stability access to ideal MHD ballooning modes and, as this opens up, the pedestal pressure gradient rapidly rises to track the increasing instability threshold. This provides strong evidence that the KBM is constraining the inter-ELM evo-lution in these pedestals, but not at a ixed pressure gradient. Furthermore, we have argued that the pedestal width evo lution is inluenced by the region of edge plasma that has access to second stability, and this can lead to complex dynamics—
including a reduction in the pedestal width when only a small part of the pedestal penetrates into the second stability region. The regions of plasma that are second-stable to n = ∞ ideal MHD are also expected to have enhanced stability to the KBM [24], so it is possible that other microinstabilities control the pedestal transport in these regions. Our local gyrokinetic sta-bility calculations for discharge 84795 conirm the absence of the local KBM in those second stable regions of the pedestal. Three ion-scale instabilities have been identiied, including one with characteristics of a hybrid TEM/KBM [35], as well as electron-scale electron-temperature gradient modes. It is important to note, however, that global effects are known to destabilise KBMs in the second stability regime [8], so the local analysis is unlikely to be suficient in such situations. Furthermore, high n ideal MHD calculations [7, 28, 29] indi-cate that the kink/peeling drive can become important due to the high bootstrap current, and this also restricts access to the second stability regime (but at higher pressure gradient than the irst stability boundary). The kink drive is ordered out of standard gyrokinetics, so testing the inluence of this physics on kinetic KBM stability thresholds requires further theor-etical developments.
Of all the 11 discharges analysed across all three gas puff levels [29], if the pedestal accesses second stability, it reaches the peeling-ballooning boundary at the onset of the ELM. In these cases, there is consistency with the physics basis of the EPED model—the pressure gradient tracks the KBM threshold (modiied as appropriate, e.g. for global effects), which is not constant between ELMs, and the ELM is trig-gered by a peeling-ballooning mode. The low gas puff dis-charges analysed fall into this category.
If the pedestal does not have second stability access it is often some way short of the peeling-ballooning boundary at the time of the ELM, even though the gradient is close to the ideal ballooning KBM threshold proxy. In those cases we have identiied an oscillation in the Be-II emission that seems to pace the ELMs, triggering them at a higher frequency and lower pressure gradient than required for intermediate
[image:17.595.53.285.59.242.2]n peeling-ballooning instability. Thus we expect the meas-ured pedestal height in these cases to be degraded somewhat
Figure 17. (a) Be II light emission in discharge 87350 compared to (b) the magnetic ield luctuation amplitude in the 100–250 kHz range. The vertical dashed lines align with the peak of the
oscillations in Be II emission. The magnetics data is taken from the T001 Mirnov coil positioned outboard of the plasma above the mid-plane.
et al
compared to the EPED model predictions, leading to reduced coninement.
It has recently been proposed that JET is sitting at a trans-ition point in normalised ion Larmor radius, ρ∗, below which
shear low is ineffective at suppressing the ion temperature gradient mode and the associated transport. Reducing ρ∗
through this transition point would also lead to a degraded pedestal and reduced overall coninement [41]. It is clearly important in extrapolating to ITER that we identify which is the dominant effect and, if the effect of the oscillation on ELMs is key, we need to identify its origin and seek ways to eliminate it, or inluence its ability to trigger ELMs and con-sequent pedestal collapse.
Speculating on the origin of the oscillation, we have shown that (1) the plasma pressure gradient is close to the ideal MHD ballooning mode proxy for the KBM, and (2) the oscillations have a clear 150–350 kHz magnetic signal observed in Mirnov coil data, with an amplitude that is mod-ulated in phase with the oscillations in the Be-II emission. A possibility we propose, therefore, is that the oscillation we are observing is a non-linear consequence of the KBM. Non-linear theory has previously shown that ideal MHD bal-looning modes can erupt explosively even without the kink/ peeling drive [42], and this provides a possible model for ELM dynamics. A more recent theory has shown that as the irst stability boundary is approached, the ballooning insta-bility can result in a inite displacement of plasma ilaments rather than an eruption [43]; these hot ilaments would be expected to drain diffusively into the cooler surrounding plasma to remove the free energy driving them so that they subsequently relax back towards their initial position, for the process to then repeat, cyclically. This could be consistent with the observed Mirnov activity, with the high frequency corresponding to the multiple ine ilaments rotating past the coils, and the modulation in the amplitude associated with the ilaments pushing out and relaxing back. We cannot yet quanti fy the theoretical conditions required for a ballooning mode to provide a benign displacement (the oscillation?), and when it drives an explosive eruption (the ELM?), so it is dif-icult to comment more quantitatively at this stage; however a possibility to explore further in the future is that we are observing an evolution from an oscillatory state to an explo-sive state as the plasma approaches and then exceeds the linear stability boundary.
There is a second possible explanation related to generic linear ballooning theory (i.e. not just a property of MHD) in the presence of sheared toroidal lows. Because the rational surfaces then rotate relative to each other, the poloidal angle where individual poloidal Fourier harmonics centered on their respective rational surfaces constructively interfere to form the ballooning modes evolves in time. When the peak in amplitude is on the outboard side, the growth rate is typically maximum, and while it is on the inboard side it is typically minimum (and can even damp). This is a Floquet mode, which periodically grows and decays with a well-deined period related to the ratio of low shear to magnetic shear [44, 45]. This physics could provide the basis for a model for the evolution of the oscillations and then, perhaps, the ELM as the proiles (e.g.
low shear) evolve through a critical point [45]. Tests would require careful measurements of low and magnetic shear in the vicinity of the mode (which are challenging), as well as more accurate, quantitative non-linear models.
The above two possibilities are related to pedestal physics, with a ballooning-type instability increasing transport into the SOL, enhancing the interaction with the divertor target plates and releasing the Be which we observe through the Be II emission. Another possibility proposed in [39] is that the oscillation is related to the release of impurities from the target plates which radiate in the divertor, cooling the plasma there and causing detachment. The resulting reduction in target plate interaction reduces the impurity inlux, lowering the radiation, heating the divertor plasma, causing it to re-attach and the cycle to repeat. It remains to be understood how this mechanism might relate to the observed magnetic signal and the ELM trigger, but a possibility is the impact of detachment on the pedestal proiles and hence stability (like the mechanisms discussed in [25], for example).
While the role of the oscillation in the JET pedestal dynamics remains uncertain, there is a clear practical message suggested by this study—avoiding the oscillation and max-imising the region of edge plasma that has access to second stability will help to optimise the pedestal and therefore con-inement. The relationship between current density and pres-sure gradient is important for navigating under the nose of the s-alpha diagram to access second stability. Plasma shaping plays a role here, so an important direction for future research is to repeat this study in high triangularity discharges.
Acknowledgments
The authors are grateful for the detailed comments and sug-gestions from J. Hillesheim during the preparation of this paper. This work has been carried out within the framework of the EUROfusion Consortium and has received funding from the Euratom research and training programme 2014-2018 under grant agreement No 633053. The views and opin-ions expressed herein do not necessarily relect those of the European Commission. We also acknowledge support from the EPSRC grants EP/L01663X/1 and EP/K504178/1, which fund the EPSRC Centre for Doctoral Training in the Science and Technology of Fusion Energy. The authors acknowledge access to the EUROfusion High Performance Computer (Mar-coni-Fusion) through EUROfusion and to the ARCHER com-puting service through the Plasma HEC Consortium EPSRC grant number EP/L000237/1.
To obtain further information about the data and models underlying this paper please contact publications.oficer@ euro-fusion.org.
Appendix. Peeling-ballooning stability methodology