Int. J. Electrochem. Sci., 7 (2012) 1724 - 1733
International Journal of
ELECTROCHEMICAL
SCIENCE
www.electrochemsci.orgA Graphene-Based Electrochemical Sensor for Sensitive
Detection of Vanillin
Jinyun Peng1,2, Chuantao Hou1, Xiaoya Hu1,*
1
College of Chemistry and Chemical Engineering, Yangzhou University, Yangzhou 225002, China
2
Department of Chemistry and Biological Science, Guangxi Normal University for Nationalities, Chongzuo 532200, China
*
E-mail: [email protected]
Received: 1 January 2012 / Accepted: 19 January 2012 / Published: 1 February 2012
A simple and rapid electrochemical method was developed for the determination of trace-level vanillin, based on the excellent properties of graphene. The graphene film-coated glassy carbon electrode (GCE) was constructed and the electrochemical behavior of vanillin at the electrode was investigated in detail. The results indicated that graphene modified GCE exhibited efficiently electrocatalytic oxidation for vanillin with relatively high sensitivity and stability. The electrocatalytic behavior was further exploited as a sensitive detection scheme for the analyte determinations by differential pulse voltammetry (DPV). Under the optimized conditions, the oxidation peak current was proportional to vanillin concentration in the range of 6.0×10⁻⁷ to 4.8×10⁻⁵ mol L−1 with the correlation coefficient of 0.9996 and the detection limit of 5.6×10⁻⁸ mol L−1 (S/N = 3). The proposed method was successfully applied to biscuits samples with satisfactory results. The recovery of the method was in the range of 97.9-103.5%.
Keywords: Graphene, Vanillin, Differential pulse voltammetric, Determination
1. INTRODUCTION
pharmaceuticals, foods and perfumery. Vanillin also used as inhibition of the oxidation of human low density lipoproteins, which leading to lower rates of cardiac disease mortality [2]; and used as an antisickling effect in sickle cell anaemia sufferers [3]. So, controlling the quality of vanillin is of great importance.
Several methods for determining vanillin from several drink samples or vanilla extracts were described using UV spectrophotometry [4], GC–MS [5,6], high-performance liquid chromatography (HPLC) [3,7,8] and capillary electrophoresis (CE) [9,10]. These methods may be costly and involve time-consuming sample pretreatment processes. Recently, novel approaches for vanillin detection using electrochemical sensor have been reported, which are environmental friendly and using extremely low sample consumption as well [11-16]. Due to the simplicity, fast response, high sensitivity and online detection ability, electrochemical sensors have potential advantages to determine vanillin.
Owing to its large specific surface area, extraordinary electrical and thermal conductivities [17], good biocompatibility [18], and low manufacturing cost [19], graphene and its derivatives, including graphene oxide (GO), have attracted ever increasing attention in recent years as a novel class of 2D carbon-based nanomaterials. Like carbon nanotubes (CNTs), which have been widely used for the study of electrode materials, graphene provides a new avenue for fabricating electrochemical devices because it can facilitate electron transfer between electroactive species and electrodes. Moreover, they are more easily produced in mass quantities as compared with the CNTs. In the recent past graphene-modified electrodes have been used for the determination of a variety of electroactive species, such as NADH [20], hydrogen peroxide[21], dopamine [22], glucose [23] and azithromycin [24].
To our knowledge, voltammetric determination of vanillin using a graphene/GCE has not been reported yet. The objective of the present work is to develop a convenient and sensitive method for the determination of vanillin based on the unusual properties of graphene modified electrode. Here we report the electrochemical oxidation of vanillin on graphene modified GCE. The ability of the modified electrode for voltammetric response of selected compound was evaluated. Finally, this modified electrode was used for the analysis of vanillin in biscuits samples. The proposed sensor exhibits high sensitivity, rapid response, good reproducibility, long-term stability and freedom of other potentially interfering species.
2. EXPERIMENTS
2.1. Reagents and apparatus
The transmission electron microscope (TEM) image was obtained at JEOL-1200 EX TEM (Japan). The image of scanning electron microscope (SEM) was obtained at Hitachi S-4800 (Japan). Electrochemical experiments were performed with a CHI660D electrochemical workstation (Shanghai Chenhua Co., China) with a conventional three-electrode cell. A bare or graphene modified GCE (φ=3mm) was used as working electrode. A saturated calomel electrode (SCE) and a platinum wire were used as reference electrode and auxiliary electrode, respectively.
2.2. Preparation of the graphene-modified electrode
Before modification, the GCE surface (Alda Co. Ltd., China) was polished with 0.05 μm alumina slurry, and sonicated in redistilled water to give a clean surface. About 1 mg of graphene particles was dissolved in 1 mL of N,N-dimethylformamide (DMF) and then subjected to ultrasonication for about 30 min to facilitate the complete dissolution of graphene. Finally, the treated GCE surface was coated with 5 μL graphene suspension and dried under an infrared lamp. Prior to use, the modified electrode was carefully rinsed with water to remove the loosely attached graphene at the electrode, and dried under an infrared lamp.
2.3 Sample preparation
The analyzed samples were commercial biscuits purchased in a local super-market, containing vanillin. First of all, the solid samples were ground in a mortar with a pestle. About 0.4 g was weighed and 10ml of ethanol was added. The mixture was mechanically shaken for 1 h. After centrifugation at 3000 rpm for 10 min, the clear part of the solution in the tube was used for analysis.
2.4 Analytical procedure
The pH 5.0 Na2HPO4·12H2O-C6H8O7·H2O buffer was used as the supporting electrolyte for
vanillin. After 3 min of stirring, the DPV curves were recorded from 0.50 to 0.90 V, and the oxidation peak currents at 0.65 V was measured for vanillin. The pulse amplitude is 50 mV, the pulse width is 0.2 s.
3. RESULTS AND DISCUSSION
3.1. Characterization of graphene dispersed in DMF
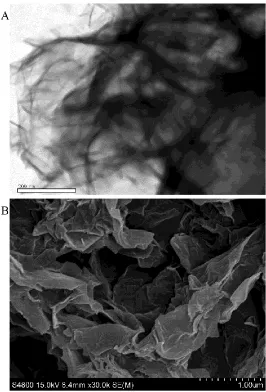
[image:4.596.166.432.129.521.2]
the GCE, revealing the typical crumpled and wrinkled graphene sheet structure on the rough surface of the film.
Figure 1. TEM (A) of graphene in DMF solvent and SEM (B) image of graphene-film modified GCE.
3.2. Electrochemical behaviour of vanillin
The voltammograms of vanillin at a bare GCE and graphene/GCE in Na2HPO4·12H2
O-C6H8O7·H2O buffer (pH 7.0) were shown in Fig. 2. It can be seen that the vanillin oxidation peak at the
bare GCE was weak due to slow electron transfer, while the response was improved at the graphene/GCE. The peak potential at above two electrodes was almost the same, at about 0.57 V. The oxidation peak current value (Ip) of vanillin at graphene/GCE was 2.186×10⁻⁶
Figure 2. CVs recorded at a bare GCE without vanillin(a); bare GCE with 2.4×10⁻⁵ mol L−1 vanillin(b); graphene/GCE with 2.4×10⁻⁵ mol L−1 vanillin (c) in the buffer of Na2HPO4·12H2
O-C6H8O7·H2O, pH 7.0, scan rate: 50 mV s-1.
3.3. Effect of pH value
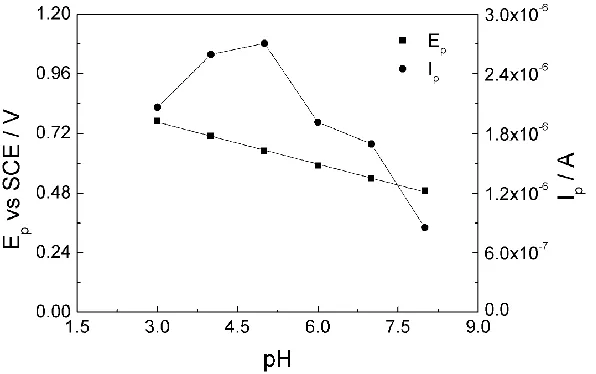
[image:5.596.156.417.87.268.2]The effect of solution pH on the electrochemical response of 2.4×10⁻⁵ mol L−1 vanillin at graphene/GCE was investigated in the pH range from 3.0 to 8.0 by DPV. As can be seen in Fig. 3, the solution pH obviously influenced the oxidation peak current and the maximum current response was obtained at pH 5.0. Thus this pH was chosen for the subsequent analytical experiments.
Figure 3. Influence of pH on the oxidation peak current and potential of 2.4×10⁻⁵ mol L−1 vanillin.
[image:5.596.151.449.486.673.2]
indicating protons take part in electrode process, which is in agreement with that obtained by [14]. The peak potential (Ep) moved in negative direction with pH rising and they showed such relation ship as: Ep(V) = −0.058 pH+ 0.942 (R = 0.9994). The slope of −0.058 V pH-1 demonstrated that the numbers of electron and proton transferred in the electrochemical reaction of vanillin were equal.
3.4 Effect of scan rate
Useful information involving electrochemical mechanism usually can be acquired from the relationship between peak current and scan rate. Therefore, the electrochemical behaviors of vanillin at different scan rates were investigated on the surface of the graphene modified GCE by DPV. A linear relationship (Ip = -3.12×10⁻⁸ v-9.29×10⁻⁷, n=13, R=0.9975) with a correlation coefficient of R = 0.9985 was observed between the peak current and the scan rate in the range of 20–250 mV/s, which revealed that the oxidation of vanillin was an adsorption-controlled step.
The peak potential shifted to more positive values with increasing the scan rates. The linear relation between peak potential and logarithm of scan rate can be expressed as Ep (V) = 0.0152 lnυ (V/s) + 0.7682 (n=13, r=9956). As for an irreversible electrode process, according to Laviron [28], Ep is defined by the following equation:
'
ln
p
RT
E E
nF
(1)
where Ep is the peak potential (V vs. SCE), Eθ’ is the formal potential (V vs. SCE), R is the universal gas constant (8.314 J K−1 mol−1), T is the temperature (K), α (alpha) is the charge transfer coefficient for the oxidation step, n is the number of electrons involved in the rate determining step, and F is the Faraday constant (96,485 C mol−1). According to Bard and Faulkner [29], for a totally irreversible wave, Ep is a function of scan rate, shifting (for an oxidation) in a positive direction by an amount 1.15RT/αF (or 30/αmV at 25°C) for each ten fold increase in v. So, from this we get the value of α to be 0.789. The number of electron (n) transferred in the electro-oxidation of Syn was calculated to be 2.140 (approximately equal to 2). The conclusions are well consistent with previous report on the electrochemical oxidation of vanillin [16].
3.5. Chronocoulumetry
The electrochemically effective surface areas (A) of GCE and graphene/GCE were investigated by chronocoulometry using 1.0×10⁻⁴ mol L−1 K3[Fe(CN)6] as model complex (the diffusion coefficient
of K3[Fe(CN)6] in 1.0 mol L−1 KCl is 7.6×10⁻⁶ cm2 s−1 [30] based on Anson equation [31]:
1/ 2 1/ 2
1/ 2
2
( ) nFAcD t dl ads
Q t Q Q
where c is substrate concentration, D is the diffusion coefficient, n is electron transfer number, Qdl is double layer charge which could be eliminated by background subtraction, Qads is Faradic charge. Other symbols have their usual meanings. Based on the slopes of the curves of Q versus t1/2, A was calculated to be 0.087 cm2 (GCE) and 0.21 cm2 (graphene/GCE), indicating that the electrode effective surface area was increased obviously after electrode modification, which would increase the electrochemical active site, enhance the electrochemical response, and decrease the detection limit.
3.6. Calibration curve
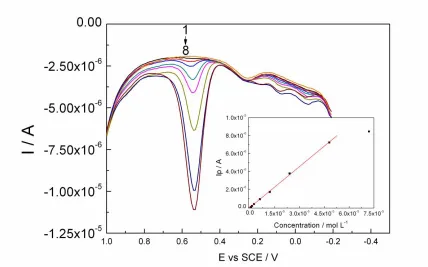
Under the optimal conditions, differential pulse voltammetry (DPV) was used to determine vanillin due to its higher sensitivity than cyclic voltammetry. Fig. 4 shows the differential pulse voltammograms of different concentrations of vanillin in pH 5.0. As can be seen in the insert of Fig. 4, the oxidation peak current was proportional to vanillin concentration in the range of 6.0×10⁻⁷
to 4.8×10⁻⁵
mol L-1 with the linear regression equation of I (A) =0.1523c (mol L-1)− 2.8×10⁻⁸ (R = 0.9996). The detection limit was estimated to be 5.6×10⁻⁸
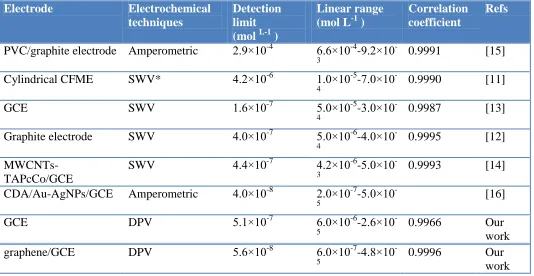
mol L-1 (S/N = 3). Analysis of vanillin by DPV at a GCE was investigated and was listed in Table 1. The comparison of graphene/GCE with other modified electrodes for vanillin determination was also listed in Table 1. It can be seen that the graphene/GCE offered reasonable linear range for vanillin detection and the detection limit was lower than some of previous reports. These results indicated that graphene/GCE is an appropriate platform for the determination of vanillin.
Figure 4. Differential pulse voltammograms of graphene/GCE in different concentrations of vanillin solutions. (1)–(8) 0, 6.0×10⁻⁷, 1.2×10⁻⁶, 2.4×10⁻⁶, 6.0×10⁻⁶, 1.2×10⁻⁵, 2.4×10⁻⁵, 4.8×10⁻⁵, 7.2×10
-5
[image:7.596.85.513.433.700.2]
Table 1. Comparison of different modified electrodes for vanillin determination
Electrode Electrochemical
techniques
Detection limit (mol L-1 )
Linear range
(mol L-1 )
Correlation coefficient
Refs
PVC/graphite electrode Amperometric 2.9×10⁻⁴ 6.6×10⁻⁴-9.2×10
-3 0.9991 [15]
Cylindrical CFME SWV* 4.2×10⁻⁶ 1.0×10⁻⁵-7.0×10
-4
0.9990 [11]
GCE SWV 1.6×10⁻⁷ 5.0×10⁻⁵-3.0×10
-4
0.9987 [13] Graphite electrode SWV 4.0×10⁻⁷ 5.0×10⁻⁶-4.0×10
-4
0.9995 [12]
MWCNTs-TAPcCo/GCE
SWV 4.4×10⁻⁷ 4.2×10⁻⁶-5.0×10
-3
0.9993 [14] CDA/Au-AgNPs/GCE Amperometric 4.0×10⁻⁸ 2.0×10⁻⁷-5.0×10
-5
[16]
GCE DPV 5.1×10⁻⁷ 6.0×10⁻⁶-2.6×10
-5
0.9966 Our
work
graphene/GCE DPV 5.6×10⁻⁸ 6.0×10⁻⁷-4.8×10
-5 0.9996 Our
work * SWV: square wave voltammetry
3.7. Reproducibility, stability and interferences
For investigating the fabrication reproducibility, a 6.0×10⁻⁶
mol L−1 vanillin solution was measured by six modified electrodes prepared independently and the RSD of the peak current was 3.52%, revealing excellent reproducibility. After the electrode was stored for 15 days at 4℃ in humidity environment, it could retain 92.35% of its original response, suggesting acceptable storage stability. In addition, 800-fold concentration of K+, Na+, Mg2+, Zn2+, Cl-, NO-3,
2-4
SO , glucose, sucrose, aminoacetic acid, VB1; 400-fold concentration of urea; 250-fold concentration of Ca2+; 200-fold concentration of Al3+, Fe3+; 150-fold concentration of Pb2+; 8-fold concentration of Vc; 6-fold concentration of Mn2+; 2.5-fold concentration of hypoxanthine do not interfere with the oxidation signal of 6.0×10⁻⁶
mol L−1 vanillin (peak current change < 5%). These results indicated that graphene/GCE has an excellent selectivity for vanillin, and it might be applied to determine vanillin in real samples.
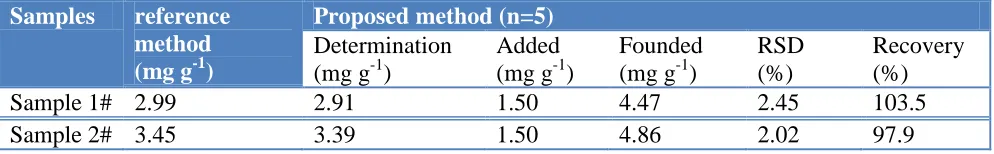
3.8. Analytical application
[image:9.596.51.548.160.237.2]
adopted ) were compared in Table 2 and were in good agreement. The recovery of the method was in the range of 97.9-103.5 %.
Table 2. Determination of vanillin in biscuit samples
Samples reference
method
(mg g-1)
Proposed method (n=5)
Determination (mg g-1)
Added (mg g-1)
Founded (mg g-1)
RSD (%)
Recovery (%)
Sample 1# 2.99 2.91 1.50 4.47 2.45 103.5
Sample 2# 3.45 3.39 1.50 4.86 2.02 97.9
4. CONCLUSIONS
An electrochemical sensor for rapid detection of vanillin was developed using graphene sensing film. Owing to large surface area and subtle electronic properties, the graphene film enhances the oxidation signals of vanillin. So, the sensitivity of detection of vanillin is greatly improved at graphene/GCE. The proposed method was applied to detect vanillin in real samples with detection limit (5.6×10⁻⁸
mol L-1) and satisfied recoveries from 97.9% to 103.5%.
ACKNOWLEDGEMENTS
This work was supported by the National Natural Science Foundation of China (Nos. 21075107).
References
1. N.J. Walton, M.J. Mayer, A. Narbad, Phytochemistry, 63(2003) 505 2. P.L. Teissedre, A.L. Waterhouse, J. Agric. Food Chem., 48(2000): 3801
3. D. Farthing, D. Sica, C. Abernathy, I. Fakhry, J.D. Roberts, D.J. Abraham, P. Swerdlow, J. Chromatography B, 726 (1999) 303
4. E.W. Ainscough, A.M. Brodie, J. Chem. Educ., 67 (1990) 1070
5. L.S.D. Jager, G.A. Perfetti, G.W. Diachenko, Food Chem., 107 (2008) 1701 6. T. Sostaric, M.C. Boyce, E.E. Spickett, J. Agric. Food Chem., 48 (2000) 5802 7. V.S. Sobolev, J. Agric. Food Chem., 49(2001) 3725
8. K.N. Waliszewski, V.T. Pardio, S.L. Ovando, Food Chem., 101 (2006) 1059 9. M.C. Boyce, P.R. Haddad, T. Sostaric, Anal. Chim. Acta, 485 (2003) 179
10. M. Ohashi, H. Omae, M. Hashida, Y. Sowa, S. Imai, J. Chromatography A, 1138 (2007) 262 11. L. Agüí, J.E. López-Guzmán, A. González-Cortés, P. Yáñez-Sedeño, J.M. Pingarrón, Anal. Chim.
Acta, 385 (1999) 241
12. F. Bettazzi, I. Palchetti, S. Sisalli, M. Mascini, Anal. Chim. Acta 555 (2006) 134 13. J.L. Hardcastle, C.J. Paterson, R.G. Compton, Electroanalysis, 13 (2001) 899
14. D.J. Kong, S.F. Shen, H.Y. Yu, J.D. Wang, N.S. Chen, Chinese J. Inorg. Chem., 26 (2010) 817 15. M. Luque, E. Luque-Pérez, A. Ríos, M. Valcárcel, Anal. Chim. Acta, 410 (2000) 127
16. D.Y. Zheng, C.G. Hu, T. Gan, X.P. Dang, S.S. Hu, Sensors and Actuators B, 148 (2010) 247
Firsov, Science, 306 (2004) 666
18. H. Chen, M.B. Müller, K.J. Gilmore, G.G. Wallace, D. Li, Advanced Mater. 20 (2008) 3557 19. M. Segal, Nature Nanotechnol. 4 (2009) 612
20. L. Zhang, Y. Li, L. Zhang, D. Li, D. Karpuzov, Y. Long, Int. J. Electrochem. Sci., 6 (2011) 819 21. S. W. Ting, A.P. Periasamy, S. Chen, R. Saraswathi, Int. J. Electrochem. Sci., 6 (2011) 4438 22. T. Tsai, Y. Huang, S. Chen, M.A. Ali, F.M.A. AlHemaid, Int. J. Electrochem. Sci., 6 (2011) 6456 23. P. Norouzi, H. Ganjali, B. Larijani, M.R. Ganjali, F. Faridbod, H.A. Zamani, Int. J. Electrochem.
Sci., 6 (2011) 5189
24. J.Y. Peng, C.T. Hou, X.X. Liu, H.B. Li, X.Y. Hu, Talanta, 86 (2011) 227
25. D.R. Dreyer, S. Murali, Y. Zhu, R.S. Ruoff, C.W. Bielawski, J. Mater. Chem., 21 (2011) 3443 26. X. Fan, W. Peng, Y. Li, X. Li, S. Wang, G. Zhang, F. Zhang, Advanced Mater. 20 (2008) 4490 27. H.C. Schniepp, J.L. Li, M.J. McAllister, H. Sai, M. Herrera-Alonso, D.H. Adamson, R.K.
Prud’homme, R. Car, D.A. Saville, I.A. Aksay, J. Phys. Chem. B, 110 (2006) 8535 28. E. Laviron, J. Electroanal. Chem., 100 (1979) 263
29. A.J. Bard, L.R. Faulkner, Electrochemical Methods Fundamentals and Application, 2nd ed., Wiley, (2004)
30. R.N. Adams, Electrochemistry at Solid Electrodes, Marcel Dekker, New York, (1969) 31. F.C. Anson, Anal. Chem., 36 (1964) 932