Jehangir Nazir Ahmed
A thesis submitted for the degree of Doctor of Philosophy of the Australian National University
November 2015
The results presented in this thesis are, except where otherwise acknowledged, my own original
work. It has not been submitted, in whole or in part, for any other degree.
“Read in the name of your Lord who created”
“Created man, out of a (mere) clot of congealed blood”
“Read, and your Lord is the most Generous”
“Who taught by the pen”
“Taught man that which he knew not.”
Acknowledgments
I am thankful to the Almighty for making me capable of pursuing a Doctor of Philosophy (PhD).
The PhD journey was made possible due to the support and guidance of several people and I
take this opportunity to recognize their contributions.
First and foremost I am grateful to my supervisor, Ruth Arkell, for the opportunity to conduct
research under her tutelage and providing guidance and ingenious advice. I am indebted to her
for funding my PhD and the assistance and feedback she provided for preparation of seminars
and writing of this thesis. I have indeed learnt several skills while working under her supervision,
but if there was one thing that I had to take away, it will be her insistence to, “make smart
choices.”
Members of the Arkell lab (past and present) have contributed immensely to my development
as a research scientist. Most notably, I am grateful to Radiya Ali for paving the way for my
research career, and Nicole Thomsen for her helpful and dependable presence in the lab. My
gratitude is extended to other lab members (Alaa, Koula, Kristen, and Hannah) for their support
and assistance during my time in the lab, particularly Koula who time and again proved to be a
gem.
I owe everything to the two people who form the biological basis of my existence. My parents
have ensured provision of everything I needed to reach here. Moreover, the numerous lessons
they have taught me has made my life a pleasurable and gratifying experience. I am grateful to
my father for teaching me the value of hard work and my mother for instilling steadfastness in
Lastly I thank my darling wife, Natasha, for being a pillar of support. I consider myself lucky to
have her as my partner, owing to her loving, supportive, encouraging and patient nature that
has made this journey significantly easier. Her unwavering belief in my ability has allowed me to
Abstract
The zinc finger of the cerebellum (Zic) genes encode a family of transcriptional regulators critical for early embryogenesis. All ZIC proteins contain a zinc finger domain (ZFD) and other
evolutionary conserved regions. They are pleiotropic in nature since they can influence gene
expression directly by acting as transcription factors due to their ability to bind target DNA
sequences, or indirectly as co-factors by interacting with protein partners. Little is known,
however, about the structural components that allow ZIC proteins to perform these functions.
Among ZIC family members the protein structure of ZIC3 is relatively well characterised, yet
details regarding its transactivation domain remain unknown. During embryonic development
ZIC3 is involved in maintaining pluripotency of embryonic stem cells, formation of the left-right
(L-R) axis and arrangement of visceral organs. Mutations in Zic3 in humans and animal models cause congenital L-R axis defects. The work presented in this thesis maps structural domains
required for ZIC3 molecular function. Characterisation of a novel allele of murine Zic3 revealed
that removal of the ZFD and C-terminus renders the mutant protein functionally null and
incapable of dominantly interfering with the function of other ZIC proteins. To further assess the
transcription factor function of ZIC3, a new cell-based transactivation assay system using target
ZIC3-DNA binding sequences was designed. This assay was used to identify regions within the
ZFD and C-terminus vital for transactivation via ZIC3. In addition other evolutionary conserved
domains were implicated in transactivation. This study provides a reliable and robust platform
Table of Contents
ACKNOWLEDGMENTS ... V
ABSTRACT ... VII
TABLE OF CONTENTS ... IX
LIST OF FIGURES ... XIV
LIST OF TABLES ... XVII
ABBREVIATIONS ... XVIII
CHAPTER 1 – INTRODUCTION ... 1
1.1 TRANSCRIPTION FACTORS: KEY MEDIATORS OF BIOLOGICAL FUNCTION ... 3
1.1.1REGULATION OF TRANSCRIPTION FACTOR STEADY STATE LEVELS AND ACTIVITY ... 5
1.1.1.1 Transcription: mRNA synthesis ... 5
1.1.1.2 RNA Degradation ... 6
1.1.1.3 Translation: Protein Synthesis ... 7
1.1.1.4 Protein modifications ... 7
1.1.1.5 Nuclear Localization ... 8
1.1.1.6 Mechanisms of nuclear export ... 10
1.1.1.7 Dimerization ... 10
1.1.1.8 Dominant-negative interference: ... 10
1.1.1.9 Protein Degradation ... 11
1.2 THE ZIC FAMILY OF PROTEINS ... 12
1.2.1GENOMIC ARRANGEMENT ... 13
1.2.2PROTEIN STRUCTURE AND FUNCTION ... 14
1.2.2.1 The ZIC proteins function as transcription factors in vitro and in vivo ... 17
1.3.3REGULATION OF ZIC3FUNCTION ... 23
1.3.3.1 Via nucleocytoplasmic shuttling ... 23
1.3.3.2 Via dominant-negative interference ... 23
1.4 HETEROTAXY ... 25
1.4.1MOUSE MODELS OF ZIC3 DYSFUNCTION ... 27
1.5 SCOPE OF THESIS ... 29
CHAPTER 2 – MATERIALS AND METHODS ... 31
2.1 GENOTYPING OF KATUN MICE ... 33
2.1.1GENOMIC DNAEXTRACTION ... 33
2.1.2GENOTYPING PCR AND PRIMERS ... 33
2.1.3AGAROSE GEL ELECTROPHORESIS ... 35
2.1.4GENOTYPING ASSAYS ... 36
2.1.4.1 Allelic Discrimination ... 36
2.1.4.2 High Resolution Melt Analysis ... 38
2.1.5REVERSE-TRANSCRIPTASE (RT)-PCR ... 40
2.2 PLASMIDS ... 41
2.2.1PURCHASED PLASMIDS ... 41
2.2.2WILD-TYPE EXPRESSION CONSTRUCTS ... 42
2.2.3MUTANT ZIC3 CONSTRUCTS ... 44
2.2.3.1 Pathogenic variants ... 44
2.2.3.2 Synthetic variants ... 45
2.2.4REPORTER CONSTRUCTS ... 45
2.2.4.1 Genomic promoters ... 45
2.2.4.2 Minimal promoters ... 46
2.2.4.3 Synthetic enhancers ... 47
2.3 MOLECULAR CLONING ... 49
2.3.1BACTERIAL TRANSFORMATION ... 49
2.3.2PLASMID ISOLATION ... 49
2.3.3PCR BASED MUTAGENESIS AND SCREENING ... 50
2.3.3.1 Site-directed mutagenesis ... 50
2.3.3.4 DNA sequencing ... 55
2.3.4RESTRICTION ENZYME DIGESTS ... 56
2.3.5ANTARCTIC PHOSPHATASE TREATMENT ... 56
2.3.6ETHANOL PRECIPITATION ... 57
2.3.7RECOMBINATION BASED CLONING ... 57
2.3.7.1 In-Fusion™ Dry-Down PCR Cloning ... 57
2.3.7.2 Gateway® Recombination Cloning Technology ... 58
2.3.8LIGATION BASED CLONING ... 59
2.3.8.1 Insert preparation ... 59
2.3.8.2 Vector preparation ... 60
2.3.8.3 Ligation reaction ... 60
2.4 CELL CULTURE ... 61
2.4.1CELL LINES AND CULTURE CONDITIONS ... 61
2.4.2TRANSFECTION ... 61
2.4.3IMMUNOFLUORESCENCE (IF) ... 62
2.4.3.1 Staining and microscopy ... 62
2.4.3.2 Quantification of subcellular localization ... 63
2.4.4CELL LYSIS AND SUBCELLULAR FRACTIONATION ... 64
2.4.5SODIUM DODECYL SULPHATE-POLYACRYLAMIDE GEL ELECTROPHORESIS (SDS-PAGE) ... 65
2.4.6WET TRANSFER ... 67
2.4.7WESTERN BLOTTING (WB) ... 67
2.4.8LUCIFERASE REPORTER ASSAYS ... 68
2.4.9CHIP-QPCR ... 70
CHAPTER 3 – THE KATUN MOUSE STRAIN IS A ... 73
NULL ALLELE OF ZIC3 ... 73
3.1 INTRODUCTION ... 75
3.1.1ZIC3 MUTANT MICE MODEL HETEROTAXY ... 75
3.1.2THE KATUN MUTATION ... 76
3.2.2THE KATUN TRANSCRIPT EVADES NMD ... 85
3.2.3STABLE EXPRESSION OF KATUN PROTEIN IN MAMMALIAN CELL LINES ... 87
3.2.4SUBCELLULAR LOCALIZATION OF THE KATUN PROTEIN ... 88
3.2.5THE KATUN PROTEIN IS A FUNCTIONAL NULL ... 91
3.2.5.1 Katun cannot transactivate ... 91
3.2.5.2 Katun cannot behave in dominant-negative manner ... 91
3.2.5.3 Katun does not inhibit expression of Wnt target genes ... 92
3.2.6PTC-CONTAINING ZIC3 MUTANT TRANSCRIPTS PRODUCE PROTEINS THAT DO NOT COMPETE WITH WILD-TYPE ZIC3 ... 94
3.2.7PTC-CONTAINING ZIC3 MUTANT TRANSCRIPTS PRODUCE PROTEINS THAT DO NOT COMPETE WITH WILD-TYPE ZIC2 AND ZIC5 ... 96
3.3 DISCUSSION ... 98
3.3.1THE KATUN MOUSE STRAIN CARRIES A NULL ALLELE OF ZIC3 ... 98
3.3.2INCOMPLETE NMD CAN ALLOW ZIC3PTC-INDUCING MUTATIONS TO HAVE SOME FUNCTION ... 100
CHAPTER 4 – THE ZICFLASH ASSAY ... 103
4.1 INTRODUCTION ... 105
4.1.1TRANSACTIVATION ASSAYS FOR ZIC PROTEINS ... 105
4.1.2AIMS ... 109
4.2 RESULTS ... 110
4.2.1AN IMPROVED TRANSACTIVATION ASSAY PROTOCOL ... 110
4.2.2A NEW GENERATION REPORTER PLASMID (WHEN OLD IS NOT GOLD) ... 113
4.2.3ZIC-SPECIFIC TRANSACTIVATION VIA SYNTHETIC ENHANCERS ... 115
4.2.4CHOICE OF NEGATIVE CONTROL ... 121
4.2.5CHOOSING A MINIMAL PROMOTER ... 123
4.3 DISCUSSION ... 130
4.3.1GOOD EXPERIMENTAL DESIGN DECREASES VARIABILITY ... 130
4.3.1.1 Practices used to minimize external variability ... 131
4.3.1.2 Practices used to minimize internal variability ... 132
4.3.1.3 Other experimental considerations ... 133
4.3.2ZICFLASH REPORTER BOOSTS ZIC3-DEPENDENT TRANSACTIVATION... 134
4.3.2.4 Inclusion of minimal promoter alters signal ... 137
CHAPTER 5 – LINKING STRUCTURE TO FUNCTION ... 139
5.1 INTRODUCTION ... 141
5.1.1C2H2 TYPE ZINC FINGERS ... 141
5.1.2OTHER EVOLUTIONARY CONSERVED DOMAINS ... 145
5.1.3AIMS ... 146
5.2 RESULTS ... 147
5.2.1ZIC3 VARIANT PROTEINS ... 147
5.2.2THE ZFD AND C-TERMINAL REGIONS OF ZIC3 ARE REQUIRED FOR TRANSACTIVATION ... 149
5.2.3MUTATIONS WITHIN ZF-1 ABATE TRANSACTIVATIONAL ABILITY OF ZIC3 ... 153
5.2.4MULTIPLE DOMAINS CONTRIBUTE TO AN OVERALL REPRESSIVE EFFECT OF THE ZIC3N-TERMINUS. . 155
5.3 DISCUSSION ... 157
5.3.1TRANSACTIVATION DOMAIN OF ZIC3 RESIDES IN THE C-TERMINUS ... 157
5.3.2EACH ZF HAS A ROLE TO PLAY IN TRANSACTIVATION ... 159
5.3.3THE N-TERMINUS CONTRIBUTES TO TRANSCRIPTION REPRESSION ... 160
CHAPTER 6 – CONCLUDING SUMMARY ... 163
SUPPLEMENTARY INFORMATION ... 170
APPENDIX 1:CHOICE OF CELL LINE ... 170
APPENDIX 2:GENOTYPING PCR OPTIMISATION ... 174
List of Figures
Figure 1.1: Transcription regulation via transcription factors……….…4
Figure 1.2: Dominant-negative interference………..…...11
Figure 1.3: Genomic arrangement of vertebrate ZIC genes………14
Figure 1.4: Schematic illustration of ZIC proteins………..15
Figure 1.5: X-linked Inheritance………21
Figure 1.6: Situs arrangements………..………26
Figure 1.7: Schematic representation of L-R axis formation in the mouse………28
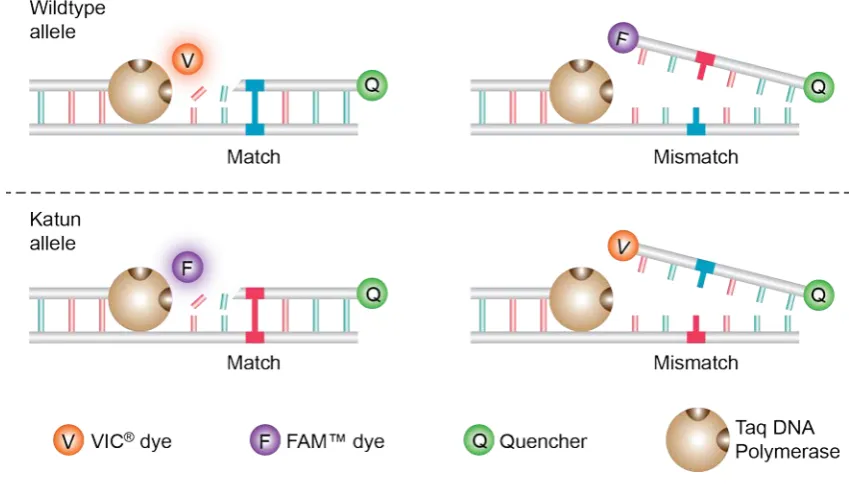
Figure 2.1: Allelic discrimination using fluorogenic probes………37
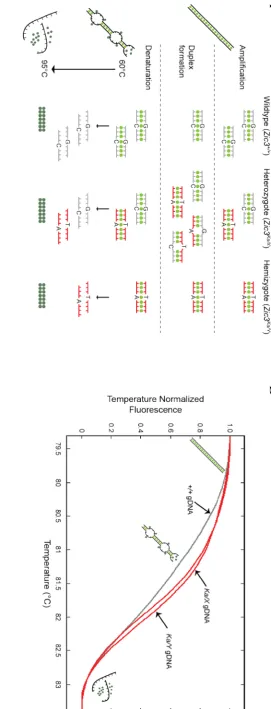
Figure 2.2: Schematic illustration of HRMA………..39
Figure 2.3: Plasmids maps of vectors used for Gateway recombination cloning……….41
Figure 2.4: Plasmid map for B:luc2………..42
Figure 2.5: ZIC-specific synthetic enhancer motifs………47
Figure 2.6: Creating deletion mutants by overlap extension PCR………..53
Figure 2.7: Gateway® LR Recombination Cloning……….58
Figure 2.8: Quantifying subcellular localization……….…64
Figure 3.1: Amino acid sequence alignment of human and mouse ZIC3 proteins………75
Figure 3.2: The katun mutation……….78
Figure 3.3: Genotyping of katun mouse colony using Allelic Discrimination………..81
Figure 3.4: Identifying an HRMA assay that can distinguish between all genotypes in the katun mouse colony……….83
Figure 3.5: HRMA increases reliability of sextyping assay………...84
Figure 3.7: The katun transcript accumulates in gastrulation and organogenesis stage mutant
embryos……….87
Figure 3.8: Generation of katun mutation on Human ZIC3 cDNA………88
Figure 3.9: Truncated katun protein diffuses into the nucleus……….90
Figure 3.10: The katun protein is functionally inert……….93
Figure 3.11: ZIC3-heterotaxy associated mutant proteins do not compete with wild-type ZIC3..95
Figure 3.12: Dominant-negative behaviour of ZIC3-heterotaxy associated mutant proteins in the presence of wild-type ZIC2 and ZIC5………..97
Figure 4.1: Luciferase reporter gene assay……….106
Figure 4.2: Zic genes are not co-expressed with Apoe during gastrulation………108
Figure 4.3: Putative ZIC3 DNA-binding sites………..109
Figure 4.4: Modifications in transactivation assay protocol………111
Figure 4.5: A more robust transactivation assay protocol………112
Figure 4.6: Vector backbone influences transactivation assay performance………..114
Figure 4.7: Known DNA-binding sites of ZIC proteins………..116
Figure 4.8: Construction of synthetic enhancer reporter constructs………...117
Figure 4.9: Transactivation via reporter vectors containing synthetic enhancers………...118
Figure 4.10: Finding the best response element for transactivation via ZIC3………..120
Figure 4.11: Choosing an appropriate negative control……….122
Figure 4.12: Inclusion of minimal promoters in the B:luc2 reporter………..124
Figure 4.13: Choosing an appropriate minimal promoter………...125
Figure 4.14: Combining a minimal promoter with the Z3M2 synthetic enhancer………...126
Figure 5.2: ZF motif is highly conserved across ZIC family members……….143
Figure 5.3: Subcellular distribution of ZIC3 variants……….148
Figure 5.4: ZIC3 PTC-containing mutants are unable to activate transcription………..150
Figure 5.5: Mutations in ZFs of ZIC3 protein abolish the ability to activate transcription…………152
Figure 5.6: Conserved amino acids in ZF1 of ZIC3 are required for transactivation……….154
Figure 5.7: N-terminal of ZIC3 is required for transactivation………...156
Figure 5.8: Schematic illustration of the K408X mutation……….158
Figure 5.9: Chemical effect of the cysteine to serine conversion on ZFs……….159
Figure 5.10: Multiple transcription factor binding locus on mouse Nanog gene promoter……..161
Figure 6.1: C-terminus of ZIC3 contains a high percentage of residues commonly found in transactivation domains ……….165
Figure 6.2: Sequence alignment of N-terminal evolutionary conserved region………...166
Figure S1: Transfection efficiency across cell lines………...171
Figure S2: Transactivation via B:luc2:APOE-M2 and B:luc2:Z3M2 reporters across cell lines…..172
Figure S3: Transactivation via synthetic enhancers in U87 and C3H10T1/2 cells……….173
List of Tables
Table 1.1: ZIC DNA-binding sequences ………18
Table 1.2: Murine alleles for Zic3………...27
Table 2.1: Thermal profiles of PCR programs used for optimization of genotyping assay………….34
Table 2.2: Primers used for genotyping assays………34
Table 2.3: Primers used for amplifying minimal promoters………47
Table 2.4: Primers used for site-directed mutagenesis……….51
Table 2.5: Thermal cycling parameters for site-directed mutagenesis………..51
Table 2.6: Primer design for creation of deletion mutants using overlap extension PCR………52
Table 2.7: Thermal cycling parameters for overlap extension PCR………54
Table 2.8: Bacterial colony PCR parameters……….54
Table 2.9: Thermal cycling parameters for DNA sequencing PCR………..55
Table 2.10: Restriction enzymes used to digest DNA………..56
Table 2.11: Thermal cycling parameters for insert amplification………..59
Table 2.12: Transfection amounts based on culture plate………..62
Table 2.13: SDS-PAGE gel recipes……….66
Table 2.14: Antibodies used for Western blotting………68
Table 3.1: Zic3/ZIC3 splice site homology and scores……….94
Table 4.1: Non-biological factors that can distort the outcome of reporter gene assays………...130
Abbreviations
ANOVA: analysis of variance bp: base pairs
CD: circular dichroism
cDNA: complimentary deoxyribonucleic acid CDS: coding deoxyribonucleic acid sequence ChIP: Chromatin immunoprecipitation CMV:cytomegalovirus
DBD: DNA-binding domain
DMEM: Dulbecco’s Modified Eagle Medium DNA: deoxyribonucleic acid
dpc: days post coitum
EDTA: Ethylenediaminetetraacetic acid EGFP: enhanced green fluorescent protein ESC: embryonic stem cell
HRP: horse radish peroxidase HRMA: high resolution melt analysis Ka: katun
kDa: kilo Daltons L-R: left-right
LPM: lateral plate mesoderm LSD: least significant difference MCS: multiple cloning site
mRBP: messenger ribonucleic acid binding protein mRNA: messenger ribonucleic acid
MW: molecular weight
PTC: premature termination codon PTM: post-translational modification PVDF: polyvinylidene difluoride
qPCR: quantitative polymerase chain reaction RT: reverse transcriptase
RNA: ribonucleic acid
RLA: relative luciferase activity SD: standard deviation
SDS: Sodium dodecyl sulphate
SDS-PAGE: Sodium dodecyl sulphate polyacrylamide gel electrophoresis SEM: standard error of means
SV40: simian virus 40
TBP: TATA-binding protein TBS: Tris buffered saline TCF: T-cell factor
Tris: Tris(hydroxymethyl)aminomethane tRNA: transfer ribonucleic acid
TK: thymidine kinase
UAS: upstream activating sequence WMISH: whole mount in situ hybridisation ZF: zinc finger
ZFD: zinc finger domain
ZFNC: zinc finger N-flanking conserved ZIC: zinc finger of the cerebellum ZOC: Zic-Opa conserved
C
HAPTER
1
1.1 TRANSCRIPTION FACTORS: KEY MEDIATORS OF
BIOLOGICAL FUNCTION
An adult organism develops from a single cell, the fertilized zygote. This diploid cell has the
potential to divide and grow into a multicellular organism that contains a multitude of
differentiated cell types, each with its own specialized function, but with the same genomic DNA.
The method by which cells with the same DNA become specialised and assemble into tissues
and organs is the central problem of developmental biology. At the core of this phenomenon is
the fact that specific regions in the genome (genes) code for proteins that influence cell identity.
Hence by using different parts of the genome to express varying combinations (or an
assortment) of proteins, cells become specialised for different functions. This differential gene
expression is therefore fundamental to all cellular differentiation and tissue formation.
Differential gene expression is achieved by the combinatorial function of various classes of
proteins (Kadonaga, 1998), one of which is called transcription factors (Latchman, 1990).
Transcription factors are modular proteins which contain distinct DNA-binding and
transcriptional regulatory domains. Typically they bind specific DNA sequences in the promoter
region (upstream of the coding region of the gene) and/or distal regulatory elements through
their DNA-binding domains, and interact with the basal transcriptional machinery through their
transcriptional regulatory domains to promote or repress gene expression (Figure 1.1) (Mitchell
et al., 1989). Additionally these proteins may also have a protein-protein interaction domain that allows them to form dimers or bind with cofactor molecules (co-activator or co-repressor)
required for their function (Latchman, 1997). Therefore transcription factors either act directly
to activate/repress transcription, or indirectly by interacting with co-factors molecules which
common target of mutations that result in human congenital defects and diseases
(Jimenez-Sanchez et al., 2001).
More than 1700 transcription factors have been identified in humans and most of these are
conserved in other taxonomic groups such as yeast, plants, Drosophila, C. elegans, Xenopus and mice (Brivanlou et al., 2002, Vaquerizas et al., 2009). Transcription factors are classified based on sequence similarities and tertiary structure of their DNA-binding domains (Stegmaier et al., 2004). These proteins drive the development of whole organisms, maintain physiological
homeostasis and are involved in repair and regeneration (Latchman, 1997).
Figure 1.1: Transcription regulation via transcription factors. Transcription factors (TF) influence gene
1.1.1 Regulation of Transcription Factor Steady State Levels and
Activity
Transcription factors actively influence the rate of gene expression and it is vital their steady
state levels and activity be strictly regulated. The first step in the synthesis of all proteins is
conversion of the DNA code to messenger RNA (mRNA). The mRNA molecule is then processed
for transport to the cytoplasm where the protein synthesizing machinery is located. The protein
synthesizing machinery translates mRNA into a polypeptide chain, which may require further
modification to form a mature protein. The mature protein in turn can be held in an inactive
state, shuttled to and from its site of activity, modified and/or targeted for destruction. The
regulation of protein steady state levels and activity can therefore occur at many different
stages.
1.1.1.1 Transcription: mRNA synthesis
mRNA synthesis occurs in the nucleus, where genes are converted into mRNA via the
transcriptional machinery. The main enzyme involved in transcription is RNA polymerase, which
identifies specific DNA binding sites (called promoters), unwinds the double helix structure of
DNA, catalyzes the formation of the mRNA molecule based on the DNA template and recognizes
a termination sequence that specifies where the transcript should end (Berg et al., 2002). In addition, RNA polymerase can interact with activator or repressor proteins (such as hormones,
growth factors or transcription factors) to modulate the rate at which transcription takes place.
In eukaryotes when DNA is transcribed into nascent mRNA, the mRNA molecule undergoes
several processing steps in the nucleus before transport to the cytoplasm for translation. These
include 5’-end capping, splicing, 3’-end cleavage and polyadenylation. The modifications at the
excluded from the mature mRNA transcript via alternate splicing (Nilsen et al., 2010). Hence a single gene can produce multiple mRNA transcripts. Following the formation of the mature
mRNA transcript it is bound by several mRNA binding proteins (mRBPs), which interact with
other proteins in the nuclear membrane to enable cytoplasmic transport.
1.1.1.2 RNA Degradation
In addition to preparation of mRNA for translation, other mechanisms can regulate mRNA
stability, inevitably effecting protein steady state levels. These include:
• miRNA mediated regulation: miRNAs are single-stranded RNA molecules of made up of ~22
nucleotides (Bartel, 2004). In animals, these molecules have been found to have important
functions in regulation of signaling pathways, apoptosis, metabolism, cardiogenesis and
brain development (Kloosterman et al., 2006). miRNAs typically regulate protein synthesis via mRNA degradation or translational inhibition. In order to target an mRNA molecule for
degradation, miRNAs form imperfect hybrids with the 3’UTR of the target mRNA and employ
exonucleases for degradation of the transcript. For translational inhibition, miRNAs bind to
mRBPs that attach themselves onto the target mRNA and obstruct the binding of the
translational machinery, hence inhibiting protein synthesis (Pillai et al., 2007).
• Nonsense Mediated Decay (NMD): NMD is an evolutionary conserved quality-control
process in yeast, Drosophila, C. elegans, mammals and plants, which selectively degrades mRNAs harbouring premature termination codons (PTCs) (Chang et al., 2007). PTCs can arise as a result of mutations (nonsense or frame-shift) or errors during RNA processing; hence
NMD protects cells from deleterious truncated proteins that may perturb the normal
cellular homeostasis (Brogna et al., 2009). A critical feature of NMD is that factors involved in this process are able to distinguish between PTCs and canonical stop codons. How exactly
this is achieved is not completely understood, however it appears dependent upon the
bypass NMD as most are located within the last exon. In addition PTCs in the last exon and
genes lacking introns escape NMD (Maquat et al., 2001).
1.1.1.3 Translation: Protein Synthesis
Once a mature mRNA transcript reaches the cytoplasm, it is recognized by the protein
synthesizing machinery. Major components of this machinery are ribosomes (site of protein
synthesis) and transfer RNA (tRNA; forms a link between nucleic acids and amino acids). Each
tRNA molecule carries a particular amino acid, which is coded for by a combination of three
specific nucleotides present on the mRNA transcript (Lodish et al., 2007). The first amino acid of all proteins is always methionine. Hence translation is initiated when a tRNA molecule carrying
methionine binds on to the corresponding nucleotides on the mRNA template. Once the amino
acid is incorporated, the tRNA molecule carrying it exits the ribosome and makes way for
subsequent tRNAs to bind and add relevant amino acids to the peptide chain. When tRNAs
encounter a stop codon, addition of amino acids to the peptide chain halts and the nascent
peptide chain is released from the ribosome to be further processed. The three-dimensional
structure of proteins and their activity is dependent on the linear order of amino acids. Hence
assembly of amino acids in their correct order is critical to the production of functional proteins.
1.1.1.4 Protein modifications
When peptide formation is complete at ribosomes, nascent peptides are transported to the
rough endoplasmic reticulum and golgi apparatus in the cell where they undergo
post-translational modifications (PTMs). PTMs involve attachment of specific chemical groups (for
Additionally PTMs allow cells to respond to environmental stimuli via PTMs of extant proteins
(Wells et al., 2001).
1.1.1.5 Nuclear Localization
Although transcription factors operate in the nucleus of a cell, they are usually held in the
cytoplasmic compartment of the cell and only translocated to the nucleus upon receipt of
specific cellular cues (Xu et al., 2004). Once activated, the proteins travel from the cytoplasm to the nucleus to reach their target DNA-binding sites. The transport of proteins occurs through
openings in the nuclear envelope, known as nuclear pores (composed of nucleoporin proteins)
(Cartwright et al., 2000). The mechanism of transport differs among the various families of transcription factors, however in general nuclear import requires the presence of specific
molecular signals (amino acid sequences in the transcription factor), mobile (shuttling) carriers
and energy (Nigg, 1997). The molecular signals either directly interact with the nucleoporins or
interact with other (so called) chaperone proteins that bind to nucleoporins to allow transport
of the transcription factor by the consumption of energy. In addition the importance of these
transport mechanisms is highlighted by many mutations resulting in human diseases and
congenital defects (Brivanlou et al., 2002, Ware et al., 2004, Xu et al., 2004).
There are several mechanisms by which transcription factors can be directed into the nucleus:
• Nuclear localization signal-mediated nuclear import: Previous studies investigating the
biochemical events that take place during nucleocytoplasmic shuttling have characterized
the specific molecular signals within transcription factors that promote nuclear import (Jans
et al., 2000). These molecular signals are known as Nuclear Localization Signals (NLSs), which are short stretches of basic amino acids that are either monopartite (a cluster of basic
residues preceded by a helix-breaking residue) or bipartite (two clusters of basic residues
to the NLSs and also associates with nucleoporins (via HEAT repeats in importin-β) allowing
nuclear import of the transcription factor (Stewart, 2007).
• Transport via chaperones: Various transcription factors have been found to move into the
nucleus in an NLS-independent manner (Xu et al., 2004). These transcription factors interact with ‘chaperone’ proteins that contain NLSs required for nuclear import. For example, the
transcription factor STAT itself does not contain an NLS. However its binding partner,
interferon-γ, consists of a monopartite NLS; it is therefore through this interaction that STAT
is able to translocate into the nucleus (Johnson et al., 1998).
• Transport into the nucleus via armadillo repeats: Some transcription factors that do not
contain NLSs instead possess armadillo repeats that are similar to the HEAT repeats found
in importin-β. These amino acids facilitate nuclear import through recognition of
nucleoporins. Armadillo repeats were first identified in the Drosophila melanogaster β-catenin orthologue, Armadillo, which is a classic example of a protein transported into the
nucleus without a NLS (Peifer et al., 1994).
• Transport into the nucleus via sumoylation and related mechanisms: Many transcription
factors are targets for sumoylation, an event wherein small ubiquitin related modifier
(SUMO) molecules are conjugated to the protein. Although the consequences of
sumoylation are diverse, it can regulate the subcellular distribution of a protein. Models
demonstrating the mechanisms by which sumoylation facilitates nuclear import have been
suggested and in most instances appear to require a NLS (Melchior et al., 2003). In some cases, however, sumoylation of the target proteins is in itself not required for nuclear
localization. For example, the enzyme essential for sumoylation, Ubc9, was capable of
1.1.1.6 Mechanisms of nuclear export
Transcription factor function can be dampened by nuclear export. The export process is
fundamentally similar to the import process, as the former also requires the presence of specific
molecular signals (nuclear exit signals) or proteins that assist the transcription factor in
interacting with the nuclear export machinery at the nuclear envelope (Wen et al., 1995). Mutations in these signals lead to accumulation of the transcription factor in the nucleus, which
continually promotes gene expression. Hence the biochemical homeostasis is disturbed causing
various diseases, such as cancer (Giannini et al., 2004).
1.1.1.7 Dimerization
Some transcription factors require a physical interaction with an identical molecule (homo-) or
with another molecule (hetero-) to form a functional dimer in order to bind DNA (Amoutzias et al., 2008). Depending on the type of transcription factor, the choice of partner and the ongoing cellular events, the dimerization process can activate or repress the activity of the transcription
factor (Klemm et al., 1998).
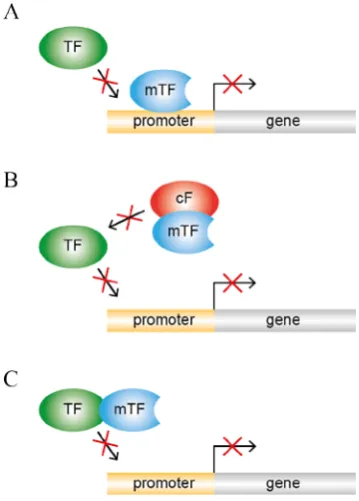
1.1.1.8 Dominant-negative interference:
This is a phenomenon where the function of a wild-type protein is abolished due to interference
by a mutant isoform (formed via alternate splicing or a genetic mutation) (Herskowitz, 1987,
Stamm et al., 2005). The resultant protein derivative can potentially interfere in the molecular functioning of wild-type transcription factor via binding to the target DNA sites, interacting with
1.1.1.9 Protein Degradation
Since transcription factors are highly active in contrast to other proteins in the cell, maintenance
of their steady-state levels needs to be tightly regulated via keeping a balance between synthesis
and degradation. This selective and programmed mechanism for protein degradation is
provided by the ubiquitin-proteasome system (Desterro et al., 2000). The proteasome is a multi-catalytic protease complex that identifies and specifically degrades ubiquitin-tagged proteins.
Ubiquitin is a highly conserved protein present in a vast variety of eukaryotic species (Hershko
[image:33.595.112.292.57.308.2]et al., 1998), which is covalently conjugated with lysine residues on proteins that are destined for degradation via the proteasome.
1.2 THE ZIC FAMILY OF PROTEINS
Genes that encode developmental regulatory proteins are generally conserved across the
invertebrate-vertebrate divide (Ohno, 1970). For example, genes involved in the development
of the Drosophila embryo often have vital roles in development of the vertebrate embryo, even though the complexity and developmental mechanisms of the organisms are significantly
different (Grinberg et al., 2005). The Zic genes are no exception; the vertebrate Zic genes were discovered by homology to the Drosophila odd-paired (opa) gene (Aruga et al., 1994). Opa itself was isolated from a genetic screen for mutations that disrupt segmentation of the Drosophila embryo. Flies unable to produce functional opa gene product lack a portion of every alternate body segment and fall into the group of mutants known as pair-rule mutants (Nusslein-Volhard et al., 1980). Further analysis of opa mutant flies revealed it also regulates expression of genes
required for the development of visceral mesoderm and midgut morphogenesis (Benedyk et al., 1994).
As observed for many vertebrate genes, evolutionary genome duplication events have expanded
the one Drosophila opa to multiple paralogs (Grinberg et al., 2005). Mammals have five paralogous Zic genes: Zic1, Zic2, Zic3, Zic4 and Zic5, each significantly homologous to the invertebrate opa gene and to their respective Zic orthologues. The name ‘Zic’ denotes zinc fingers of the cerebellum (the tissue from which they were first isolated) (Aruga et al., 1994). Mutational analysis in a variety of vertebrate and mammalian organisms has shown that Zic genes play important roles in differentiation of ectoderm and mesoderm derived structures
during embryogenesis (Houtmeyers et al., 2013). Nonetheless, much remains unknown about the molecular mechanism of Zic gene function and regulation. Moreover, the long-standing uncertainty regarding whether ZIC proteins act as bona fide transcription factors or co-factors is
only now beginning to be clarified with evidence that they can act as either class of molecule,
1.2.1 Genomic Arrangement
Sequencing, assembly and annotation of multiple genomes has revealed the ZIC genes have an unusual arrangement within the genomes of all vertebrates examined (Houtmeyers et al., 2013). In mammals, the five Zic genes reside at three genomic loci. Zic1 and Zic4 exist as a divergently transcribed tandem gene pair, as do Zic2 and Zic5, whilst Zic3 is an X-linked singleton in each species (Figure 1.3) (Ali et al., 2012). Examination of exon-intron boundaries and phylogenetic analysis has revealed that Zic genes can be divided into two subgroups (Subgroup A and Subgroup B), based on similarities in nucleotide sequence and protein structure (Aruga et al., 2006). A hypothetical model of Zic gene evolution by Aruga et al. (2006) proposes that the ancestral single copy Zic gene contained one intron and a set of conserved structural domains. Tandem duplication of the ancestral gene and sequence modifications led to the generation of
two isoforms: one that acquired an additional intron, while the other gene copy underwent
sequence divergence accompanied with the loss of certain structural domains (Houtmeyers et al., 2013). Additional genome duplication events produced eight Zic genes organized in four bigene clusters, with each cluster containing a Zic gene from Subgroup A (Zic1, Zic2 and Zic3) and Subgroup B (Zic4 and Zic5). Nonetheless the maximum number of Zic genes identified in any species to date is seven in zebrafish (Grinblat et al., 1998, Toyama et al., 2004), with the varying Zic gene copy numbers observed across vertebrate species having arisen by a combination of gene loss and de novo duplication events.
The retention of some Zic genes as tandem gene pairs has implications for their function and study. For example, it is likely that the gene pairs share regulatory sequences and have
overlapping expression patterns. This provides the potential for functional redundancy and/or
other modes of paired activities, such as dominant-negative interference between co-expressed
1.2.2 Protein Structure and Function
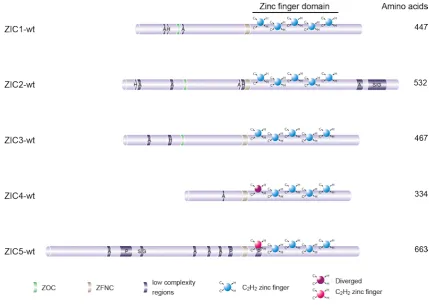
The defining feature of the OPAprotein and its vertebrate orthologues (ZIC1-5) is a zinc finger
domain (ZFD) that consists of five tandem C2H2-type zinc fingers (ZFs) (Figure 1.4). This type of ZF consists of two cysteine and two histidine residues that ligate the zinc (Zn2+) ion, enabling the protein to bind DNA (Iuchi, 2001). The ZFD spans over a third of the gene in the C-terminal half.
Sequence comparisons show that the first zinc finger (ZF1) is well conserved amongst ZIC1-3,
but is more divergent in ZIC4 and ZIC5 (Aruga et al., 2006). This is part of the basis for the sub-division of the Zic genes into structural subclasses with Zic1-3 belonging to Subgroup A and Zic4-5 belonging to Subgroup B. The ZIC ZFD possesses not just DNA-binding ability, but also protein binding ability and appears responsible for nuclear localization. Mutations within the ZFD
[image:36.595.57.486.59.282.2]adversely affect the function of these proteins by altering these properties (Mizugishi et al., 2004, Brown et al., 2005, Bedard et al., 2007).
Figure 1.3: Genomic arrangement of vertebrate ZIC genes. Illustration of the arrangement of ZIC genes
Biochemical and genetic experiments have shed some light on the ZFs responsible for DNA and
protein binding activities. For example, structural analysis of ZIC3 suggests that ZF1 and ZF2 may
[image:37.595.109.539.55.360.2]not be canonical (DNA-binding) C2H2-type ZFs. These fingers together form a single structural unit called the tandem CWCH2 motif, which is characterized by the presence of a tryptophan (W) residue between the two canonical cysteines of each ZF (Aruga et al., 2006). This motif is present in the first and second ZFs of a wide range of metazoan species, and may be of biological
Figure 1.4: Schematic illustration of ZIC proteins. Structural features of the five human ZIC proteins are
shown. All contain a C2H2-type ZFD that is highly conserved, with only the first zinc fingers of ZIC4 and
2013). Furthermore, mutational analysis of Zic2 has revealed that mutation of ZF4 ablates DNA-binding (Brown et al., 2005) and causes in vivo loss-of-function (Elms et al., 2003b) without necessarily affecting protein-protein interactions (Pourebrahim et al., 2011). Further work is required, however, to clearly delineate individual and co-operative ZF functions.
The N- and C-terminal sequences that flank the ZFs vary significantly among all the family
members. Nonetheless there is one short region (14-21 amino acids in length) at the N-terminus
of the ZFD (ZFNC) found in all family members across a wide range of species (Aruga et al., 2006) whose function remains unknown. Additionally, a small (9-10 amino acids in length) N-terminally
located domain is conserved amongst vertebrate ZIC proteins that belong to Subgroup A. OPA,
the Drosophila orthologue, also contains this domain hence it was named the ZIC/Odd-paired conserved (ZOC) motif (Aruga et al., 1996, Layden et al., 2010). This domain is required for protein-protein interactions (Mizugishi et al., 2004, Himeda et al., 2013). Other structural features of the ZIC family include low complexity regions (polyalanine, histidine, proline and
-serine/glycine tracts) located outside the ZFD. The functional relevance of these regions is still
unclear, however expansion mutations of the C-terminal alanine tract of ZIC2 (Brown et al., 2005) and the N-terminal alanine tract of ZIC3 (Wessels et al., 2010) are associated with human pathology.
Immunohistochemical staining has revealed that the protein products of Zic genes predominantly localize in cell nuclei (Aruga et al., 1994, Yokota et al., 1996), consistent with a role in gene expression, DNA replication and repair, or regulation of chromatin and other nuclear
structures (Aruga, 2004). The ZIC proteins are thought to behave as transcription factors, since
the orthologous opa is a ZF containing pair-rule gene and all other pair-rule genes are transcription factors. Nonetheless recent evidence shows ZIC proteins can influence gene
expression also as a cofactor or by complexing with transcription machinery or chromatin
1.2.2.1 The ZIC proteins function as transcription factors in vitro and in vivo
Perhaps the best evidence that mammalian ZIC proteins act as transcription factors comes from
the study of point mutations in the human and mouse Zic2 genes. A pathogenic human ZIC2 variant (ZIC2-R409P) with a missense mutation in ZF5, displayed diminished affinity to target ZIC
DNA-binding sequence and reduced transactivation ability in cell-based assays (Hatayama et al., 2011). The mouse ZIC2 variant (ZIC2-C370S) carries a missense mutation in ZF4 and animals
homozygous for this mutation have a phenotype that shifts in the same direction as an allele in
which decreased levels of wild-type protein are produced (Elms et al., 2003b). In vitro analysis shows that the ZIC2-C370S protein cannot bind DNA or activate transcription (Brown et al., 2005). These data imply that phenotypes, in either case, are produced due to loss of
transcription factor function.
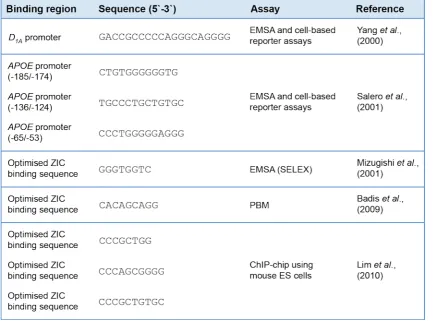
Several studies have attempted to define the consensus DNA binding sequence for ZIC proteins
(Table 1.1). The first putative ZIC DNA-binding site was identified via a yeast-one hybrid assay,
where human brain cDNAs were used to identify transcription factors that could regulate the
expression of the DOPAMINE RECEPTOR 1A (D1A) gene (Yang et al., 2000). Electrophoretic
mobility shift assay (EMSA) and cell-based reporter assays showed that ZIC2 binds the D1A
promoter and represses transcription. Similar experiments identified three ZIC binding sites on
ZIC3 is involved in regulating the pluripotency of ES cells. More molecular evidence is required,
however, to conclusively determine the regulatory targets of ZIC proteins. Despite the lack of
confirmation on the in vivo validity of the identified motifs, these binding sequences have been
used to construct in vitro ZIC transactivation assays, which serves as an important tool in
assessing the functionality of mutant ZIC proteins and identifying the structural domains
[image:40.595.56.490.246.567.2]necessary for normal protein function (Brown et al., 2005, Ahmed et al., 2013).
Table 1.1: ZIC DNA-binding sequences. All studies identified GC-rich sequences as potential ZIC binding
1.2.2.2 The ZIC proteins function as cofactors in vitro
The first evidence that ZIC proteins may act as co-factors came from a candidate approach,
based on the fact that the ZIC ZFD is highly homologous to that of the GLI proteins (Aruga, 2004).
GLI proteins are vertebrate orthologues of the Drosophila cubitus interruptus gene, which is the transcriptional mediator of the developmentally important Hedgehog signaling pathway
(Koebernick et al., 2002). The ZIC proteins bind GLI DNA binding sites (GLI-BS), albeit with much lower affinities and do not stimulate transcription from GLI-BS (Mizugishi et al., 2001). Furthermore ZIC and GLI proteins form heterodimers, with both proteins interacting through
their ZF3-5 (Koyabu et al., 2001), while no heterodimer formation has been observed between the ZIC family members (Brown et al., 2005). This interaction promotes translocation of GLI proteins, predominantly localized in the cytoplasm, to the nucleus. Consequently this stimulates
transcription at GLI-BS above that observed in the presence of only GLI proteins (Mizugishi et al., 2001). Although GLI-ZIC heterodimers have never been purified from an in vivo situation, Zic3 loss-of-function rescues the digit phenotype in the Gli3 mouse mutant known as extra toes, implying some functional relationship between these two molecules (Quinn et al., 2012). More recently ZIC proteins have been implicated in the transcriptional response to canonical
WNT signaling (Pourebrahim et al., 2011, Fujimi et al., 2012). The presence of WNT ligand alters transcription of a variety of genes involved in virtually every aspect of embryonic development
(Clevers, 2006). Upon binding of WNT ligand to its receptor, β-catenin (a cytoplasmic protein)
translocates to the nucleus where it binds its co-activator TCF to activate expression of target
genes at TCF DNA-binding sites (Daniels et al., 2005). In the absence of WNT ligand, TCF proteins form a repressor complex at TCF DNA binding sites. In vitro and in vivo reporter assays have
1.2.3 Role during Embryogenesis
The Zic genes have dynamic expression patterns during embryogenesis and in adults their expression has mainly been documented in the central nervous system (Grinberg et al., 2005). In the developing embryo all Zic genes are differentially expressed in midline regions, such as the dorsal neural tube (forms the brain and spinal cord) and dorsal part of somites (forms
muscles and vertebrae) (Nagai et al., 1997). In addition, distinct combinations of Zic genes are expressed in the limb buds, tail buds and the developing eyes.
Zic genes are often expressed in overlapping domains providing the possibility of functional redundancy. Nonetheless, when mutated individually a range of unique phenotypes are found
illustrating at least some exclusive functions during mammalian development. For example, loss
of Zic2 function causes holoprosencephaly, heart defects, hindbrain patterning defects, and neural tube defects (Elms et al., 2003b, Warr et al., 2008, Barratt et al., 2014)
.
Mutations in ZIC3lead to left-right (L-R) axis malformations and neural tube defects (Gebbia et al., 1997, Purandare et al., 2002, Ware et al., 2004) and lack of Zic5 causes craniofacial abnormalities and neural tube defects (Furushima et al., 2005). Deletion of Zic1 in mice leads to cerebellar malformations and axial skeleton abnormalities (Aruga et al., 1998). Heterozygous deletion of ZIC1 and ZIC4 leads to a defect in cerebellar development, known as Dandy-Walker malformation (Grinberg et al., 2004). In the case of Zic genes, mutations in Zics1/4, Zic2 and Zic3 in the mouse give rise to the same defects, as associated with human mutations in these genes.
Due to practical and ethical constraints the study of developmental processes in humans is
hindered. Therefore the mouse is used as a model organism for studying human genetic
1.3 ZIC3
1.3.1 Gene Location and Inheritance
Zic3 is the only mammalian Zic gene family member located on the X-chromosome (Zhu et al., 2007). In zebrafish there is evidence of a Zic6 remnant, however, in mammals Zic3 is unpaired (Ali et al., 2012). X-linkage is associated with a specific pattern of inheritance in man and mouse, since in males all X-linked genes have no allelic counterpart; a situation described as
hemizygosity. Different progeny classes are generated depending upon whether the mutation
is passaged through the mother or father (Figure 1.5). Both hemizygous males and heterozygous
females inherit one copy of the mutant allele, however, male carriers generally display
phenotypes that are more severe than the females due to a combination of factors: (i) all male
cells have only one copy of the Zic3 gene and hemizygous mutations are functionally equivalent to a homozygous autosomal mutation, and (ii) all female cells have only one active Zic3 gene and due to the random nature of X-inactivation, females are mosaics of cells that are wild-type
or mutant.
Figure 1.5: X-linked Inheritance. (A) Passage through a female carrier (XmX) produces a heterozygous
female, a hemizygous male and a normal male and female. (B) Passage through a male carrier (XmY)
1.3.2 Zic3 expression during murine gastrulation
Expression of Zic3 mRNA can be detected via whole mount in situ hybridisation (WMISH) in the
extraembryonic ectoderm of the mouse embryo as early as 5.0 dpc, when the embryo is still a
symmetrical cylinder of cells (Elms et al., 2004). This expression is maintained until the onset of
gastrulation. As gastrulation starts (6.5 dpc), expression of Zic3 shifts distally from the
extraembryonic ectoderm to the epiblast of the embryo. When the primitive streak emerges
(6.75 dpc), Zic3 expression is confined to the primitive streak and the anterior ectoderm
(prospective head region). As the node forms at the anterior of the primitive streak (7.0 dpc),
Zic3 expression is seen in the primitive streak and surrounding ectoderm but not in the node
(Elms et al., 2004). As gastrulation proceeds (7.5 dpc), this expression remains relatively constant
with Zic3 transcripts also found in mesodermal wings of the embryonic region, the primitive
streak and the adjacent ectoderm. When headfolds start to develop (7.75 dpc) Zic3 expression
departs from the primitive streak and begins in the node. This expression becomes more
prominent as development proceeds and symmetric expression of Zic3 at the node can be
viewed until 8.5 dpc (Purandare et al., 2002). At the completion of gastrulation, Zic3 transcripts
are present at high levels in:
1. the mesoderm (gives rise to cardiac muscles, skeletal muscles, somites and vertebrae)
2. parts of the ectoderm (gives rise to the central nervous system, eyes and skin).
Zic2 and Zic5 are also expressed prior to the onset of gastrulation and are later found in the
mesodermal and ectodermal germ layers (Furushima et al., 2000, Elms et al., 2004). There is also
expression overlap during organogenesis where all Zic genes are expressed in the dorsal neural
tube. Zic1-3 are co-expressed in the dorsomedial somites and the eye, whereas Zics2, Zic3 and
Zic5 are co-expressed in the limb buds and developing brain, while Zic2 and Zic3 are
co-expressed in the tail bud(Furushima et al., 2005). Despite the overlap in Zic3 expression with
that of Zic2 and Zic5, analysis of human and mouse mutants shows Zic3 has a unique role in
1.3.3 Regulation of Zic3 Function
1.3.3.1 Via nucleocytoplasmic shuttling
As previously described, nuclear entry of transcription factors is facilitated by the presence of
NLSs, which are recognized by and interact with nuclear import receptors on the nuclear
membrane (Jans et al., 2000). NLSs usually consist of multiple monopartite or bipartite clusters of positively charged basic amino acids, such as arginine (R), lysine (K) and histidine (H) (Hicks et al., 1995). No such canonical NLS is found in any ZIC protein sequence; instead two recent studies suggest that the ZIC3 ZFD contains an interspersed type NLS, spanning a wide region
containing other amino acids (Bedard et al., 2007, Hatayama et al., 2008). For example, Bedard et al. (2007) reported that 90% of wild-type ZIC3 (in NIH3T3 cells) localized exclusively in the nucleus, whereas when putative NLS mutations were made in the ZFD, nuclear localization of
the mutant proteins was limited to 20-30%. Interspersed NLSs are recognized by the nuclear
import machinery (importin-α/β complex) near the NPC and the protein allowed entry to the
nucleus via the NPC (Hicks et al., 1995). In addition, the in vivo significance of failed nuclear localization is implied by human genetics. Mutations in the NLS have been identified in human
patients with ZIC3-related Heterotaxy, implying the inability of ZIC3 to reach the nucleus causes
L-R axis malformation (Ware et al., 2004).
1.3.3.2 Via dominant-negative interference
Two experiments raise the possibility that a second post-translational mechanism of ZIC3
regulation is dominant-negative interference. Firstly, Kitaguchi et al. (2000) injected truncated Xenopus zic3 mRNAs (coding for amino acids 1-214 only) in Xenopus blastomeres and allowed development to proceed until L-R axis formation. They observed that overexpression of the
vivo, due to the X-linked location of the gene (as previously described). It can potentially act as
a dominant-negative against co-expressed family members such as ZIC2 and ZIC5. This study,
however, failed to show any interaction of the mutant ZIC3 with its wild-type counterpart, or
binding of the mutant protein to DNA or essential co-factors. Furthermore Brown et al. (2005) investigated the possibility that mutant ZIC2 can interact and interfere with its wild-type
counterpart. Co-immunoprecipitation and yeast two-hybrid analysis showed that the ZIC
proteins do not form dimers (Brown et al., 2005). Nevertheless this study demonstrated, via reporter gene transactivation assays, that some ZIC2 mutants were capable of antagonizing the
activity of wild-type ZIC2, in a dose-dependent manner. The mutant proteins evidently retain
their DNA-binding or protein binding capabilities. Mutational analysis revealed that a functional
1.4 HETEROTAXY
Despite displaying outward symmetry, most organisms have several internal asymmetries, for
example humans have both unpaired organs (like the heart or liver) or paired organs in which
each one of the pairs have asymmetry (like the lungs). These asymmetries derive from an initial
symmetry breaking event that propagates to one side of the embryo, distinguishing left from
right (and establishes the embryonic L-R axis). A failure to establish these differences leads to
laterality disorders, known as Heterotaxy (Figure 1.6), which is a greek term meaning “other
arrangement” (Ware et al., 2006a). Heterotaxies are therefore characterised by abnormal positioning of the thoracic and/or visceral organs and can cause multiple congenital
malformations (Sutherland et al., 2009). The major cause of morbidity and mortality are complex cardiovascular malformations that are sometimes accompanied by defects in the pulmonary,
gastrointestinal, genitourinary, immune and muscoskeletal systems (Kearns-Jonker, 2006).
Epidemiological surveys show Heterotaxy underlies 3% of congenital heart defects and has an
estimated prevalence of 1:10,000 live births (Lin et al., 2000). Although the true prevalence may be underestimated due to the wide spectrum of possible phenotypic abnormalities, variable
expressivity and incomplete penetrance associated with laterality defects.
Heterotaxy has a complex aetiology, most commonly it is sporadic and both genetic and
environmental factors contribute to this condition. Associated environmental factors include
maternal diabetes, maternal cocaine use and monozygotic twinning (Kuehl et al., 2002). Mutational analysis in affected children and families has identified associated heterozygous
ZIC3 was the first gene implicated in human Heterotaxy (Gebbia et al., 1997) and remains the gene most frequently associated with this condition. Mutations within ZIC3 have been found to contribute to 5% of all familial cases of Heterotaxy and 1% to sporadic cases of Heterotaxy (Ware
et al., 2004). To date twenty-three different mutations in ZIC3 have been reported: twelve missense, ten nonsense, one frameshift (Gebbia et al., 1997, Megarbane et al., 2000, Ware et al., 2004, D'Alessandro et al., 2011, Cowan et al., 2014). Males are hemizygous for the mutation and manifest situs ambiguus (Heterotaxy) with varying degrees of severity. However some male carriers (from a family with a history of ZIC3-related congenital defects) have been reported to be phenotypically normal (Megarbane et al., 2000, D'Alessandro et al., 2011), indicating that other proteins might be able to compensate for ZIC3 function. Females that are heterozygous
for the mutation are usually asymptomatic. Nevertheless in one family some females carrying
the mutation have situs inversus (Gebbia et al., 1997). The different phenotypes in females can be due to skewed X-inactivation where one X-chromosome carrying normal ZIC3 is inactivated
Figure 1.6: Situs arrangements. Situs solitus shows the normal arrangement of visceral organs, with the
[image:48.595.120.425.54.263.2]diagnosis difficult. Specifically it is difficult to pinpoint the particular tissues and the exact stage
of development where ZIC3 function is required using human clinical data.
1.4.1 Mouse models of Zic3 dysfunction
Mice present an excellent system for analysing the function of genes required for mammalian
development, providing function of the gene of interest is well conserved between man and
mouse. There is ample evidence that this is the case for ZIC3/Zic3, since multiple strains of mice
are available with Zic3 loss-of-function mutations (Table 1.2) and in each case mutant embryos
display similar anatomic abnormalities as observed in human patients of Heterotaxy (Purandare
et al., 2002).
Much is known about the molecular circuitry that establishes the murine L-R embryonic axis
(Figure 1.7) and analysis of embryos null for Zic3 shows they have aberrant expression of Nodal
and Pitx2, at 8.5 dpc. It was initially proposed that Zic3 may control Nodal expression during L-R
patterning (Ware et al., 2006b). Recent studies, however, using conditional inactivation of Zic3
Zic3 is thought to be instrumental in other developmental process as it is required to maintain
pluripotency in ESCs (Lim et al., 2007) and is expressed in an array of developing embryonic
tissues, such as those that form the central nervous system, muscles and aspects of the visual
system (Herman et al., 2002). Precisely how Zic3 acts to prevent Heterotaxy and its relevance in
other developmental processes is yet to be discovered.
Figure 1.7: Schematic representation of L-R axis formation in the mouse. 1: the node is induced to form
at mid-gastrulation (7.0 dpc) and in the next 24 hours develops into a shallow, crescent shaped depression on the ventral side of the embryo. The cells within the depression are termed pit cells, whereas those that form the raised surface that rings the pit are called crown cells (Norris, 2012). 2: a monocilium, extending into the extracellular space, forms on the apical surface of each pit and crown cell; these become posteriorly polarised over time. Signalling molecules (such as Nodal) are expressed in the crown cells. 3: the cilia of the pit cells rotate in a clockwise direction directing first a disorganised, then laminar, leftward flow of extracellular fluid within the node. It is posited that this leftward nodal-flow is sensed by crown cell cilia, prompting a Ca2+ flux in the left crown cells which modifies gene
1.5 SCOPE OF THESIS
Given the criticality of ZIC proteins for embryogenesis, it is important to understand how ZIC
proteins function at the molecular level. This includes not only identifying target DNA-binding
sites or protein partners, but also characterisation of structural domains required for particular
functions. This thesis aims to:
1 determine the importance of the ZFD and C-terminus for ZIC3 function, using a novel
murine allele
2 design a new ZIC-specific transactivation assay
C
HAPTER
2
2.1 GENOTYPING OF KATUN MICE
2.1.1 Genomic DNA Extraction
The katun mouse colony was maintained at the Australian Phenomics Facility at The Australian
National University according to Australian Standards for Animal Care under protocols approved
by The Australian National University Animal Ethics and Experimentation Committee.
Mice were genotyped (sections 2.1.2 and 2.1.4) by PCR screening of genomic DNA extracted
from ear biopsy tissue. Ear notches were collected in 50 μL of lysis solution [50 mM
Tris(hydroxymethyl)aminomethane (Tris)-HCl (pH 8.5), 1 mM Ethylenediaminetetraacetic acid
(EDTA), and 5% Tween 20] containing 2 μL of Proteinase K (10 μg/μL; Sigma Aldrich, Cat. No.
P2308) and incubated at 55°C for 60 mins, followed by 95°C for 10 mins to inactivate Proteinase
K. Tissue debris was pelleted by centrifuging at 2,000 g for 5 mins and each sample was diluted
1:10 in Analar H2O. Embryos were genotyped using a fragment of extra embryonic tissue/ectoplacental cone (7.5 dpc) or yolk sac (8.5 dpc and 9.5 dpc). Tissue was collected in 20
μL (7.5 dpc), 25 μL (8.5 dpc) or 35 μL (9.5 dpc) of lysis buffer (50 mM Tris-HCl, pH 8.5, 1 mM
EDTA, 0.5% Tween 20) containing 1 μL of Proteinase K (10 μg/μL), followed by incubation at 55°C
for 25 mins and 95°C for 5 mins to inactivate Proteinase K.
2.1.2 Genotyping PCR and primers
PCR reactions for optimising genotyping assay involved two buffers: ThermoPrime ReddyMix
PCR Mastermix (Thermo Scientific; Cat. No. AB-0575/DC/LD/B) and ImmoMix™ (Bioline; Cat. No.
BIO-25020). All reactions were carried out in a 15 μL volume in the presence of 0.67 μM of each
oligonucleotide. The ThermoPrime buffer led to final reaction conditions of 75 mM Tris-HCL (pH
Top PCR plates (Axygen; Cat. No. PCR-96-FLT-C) and the plate was sealed with an Easy Pierce
Heat Sealing Film (Axygen; Cat. No. MF-111). All PCRs were performed in an Eppendorf
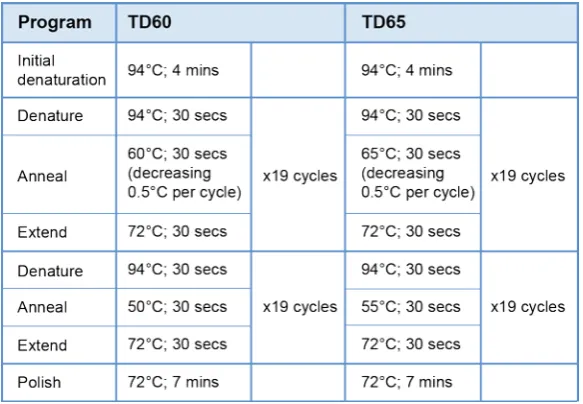
Mastercycler® using two Touchdown PCR programs: TD60 and TD65 (Table 2.1). Information on
primers used for all reactions can be found in Table 2.2.
[image:56.595.56.348.196.398.2]Table 2.1: Thermal profiles of PCR programs used for optimization of genotyping assay.
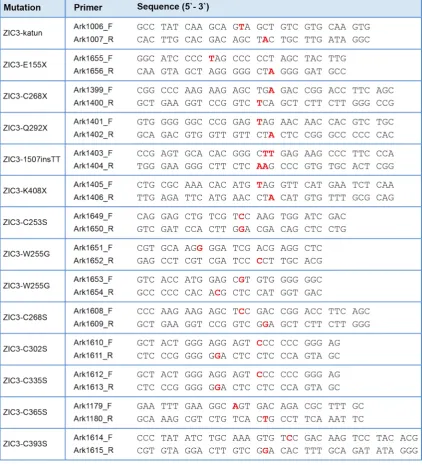
Table 2.2: Primers used for genotyping assays. F: forward
2.1.3 Agarose Gel Electrophoresis
After PCR amplification or digestion of DNA via restriction enzymes, the size of the resulting
bands was visualized using agarose gel electrophoresis. Size of the fragment determined
percentage of agarose in solution. Agarose gels were made by dissolving UltraPure™ Agarose
(Life Technologies; Cat. No. 16500-500) in TBE buffer (0.1 M Tris-HCl, 0.09 M Boric acid and 0.001
M EDTA; Amresco). The mixture was heated in a microwave to dissolve the agarose, followed by
addition of RedSafe™ Nucleic Acid Staining Solution (1:20,000 dilution; Intron Biotechnology,
Cat. No. 21141). Dissolved agarose solution was poured into a cassette and allowed to set for 60
mins.
DNA was prepared for electrophoresis by adding 1 µL of 5x loading dye [20% glycerol (Merck),
19.2% 0.5 M Na2EDTA (Sigma-Aldrich) and 0.001% bromophenol blue (Sigma-Aldrich)] to every 5 µL of sample. Samples were loaded in separate wells on the agarose gel, with 0.6 µg of 1 Kb
Plus DNA Ladder (Invitrogen™; Cat. No. 10787-026) added on either side of the sample group.
2.1.4 Genotyping assays
Genotyping of animals and embryos from the katun mouse colony was done using the following
techniques:
2.1.4.1 Allelic Discrimination
PCR for allelic discrimination was done using TaqMan® Universal PCR Master Mix (Life
Technologies; Cat. No. 4304437). All reactions were carried out in a final volume of 10 μL with
~30 ng of digested ear notch DNA in the presence of 0.9 μM of primers Ark241-Ark242 (Table
2.2). Additionally 0.25 μM of allele-specific probes (Applied Biosystems®) were used to identify
the wild-type allele (VIC-CAT CAA GCA GGA GCT G-MGBNFQ) and katun allele (FAM-CAT CAA
GCA GTA GCT G-MGBNFQ) (Figure 2.1). Reactions were set up in 96-well Half-Skirted PCR
Microplates (Axygen®; Cat. No. PCR-96-LP-AB-C) covered with Axygen Microplate Sealing Film
(Fisher Scientific; Cat. No. UC500) and performed using the StepOnePlus™ Real-Time PCR System
(Applied Biosystems®). The StepOne Software (version 2.2.2; Applied Biosystems®) was used to
run the assay using the following conditions: an initial pre-PCR read at 60°C for 30 secs to record
background fluorescence, followed by 95°C for 10 mins to denature the template and a cycling
stage of 95°C for 15 secs and of 60°C for 1 min for 50 cycles. A post-PCR read was performed at
60°C for 30 secs to collect data after completion of the PCR. Data was analysed using the same
software that records the pre- and post-PCR reads and calculates normalized dye fluorescence
(∆Rn) from the wild-type and mutant alleles as a function of cycle number. Based on this data
the software called the sample as homozygous for either wild-type or mutant allele, or