Int. J. Electrochem. Sci., 10 (2015) 1953 - 1965
International Journal of
ELECTROCHEMICAL
SCIENCE
www.electrochemsci.org
Glycerol Stabilized NaBH
4Reduction for Preparation Carbon
Supported Pt-Ni Alloy Nanoparticles Used as Oxygen-Reduction
Electrocatalysts for Microbial Fuel Cells
Zhong Wang1,2, Zhenhua Yan3, Min Wang1,*, Jinsheng Zhao1,*
1
Liaocheng Hospital, Liaocheng Shandong Province, 252000, P.R. China
2
Shandong Key Laboratory of Chemical Energy-storage and Novel Cell Technology, Liaocheng University, Liaocheng, 252059, P. R. China.
3
Tobacco Research Institute of CAAS, Qingdao 266101, P. R China
*
E-mail: [email protected]; [email protected]
Received: 15 November 2014 / Accepted: 17 December 2014 / Published: 19 January 2015
The high cost and insufficient catalytic activity of carbon-supported Pt nanoparticle catalysts are two main problems in the commercial deployment of microbial fuel cell (MFC). In an effort to address these barriers, three carbon-supported Pt-Ni alloy electrocatalysts with varying Pt:Ni atom ratios (Pt3
-Ni/C, Pt2-Ni/C, Pt-Ni/C) were prepared by simple NaBH4 reduction in glycerol at room temperature.
All of the prepared Pt-Ni alloy nanoparticles (NPs) are highly dispersed on a carbon support and show a single-phase face-centered cubic structure with a particle size of 2.4-3.0 nm. The electrocatalytic performances of the synthesized Pt-Ni alloy catalysts werecompared with that of commercial Pt/C by cyclic voltammetry and linear sweep voltammetry; among these NPs, the Pt2-Ni/C catalyst exhibits the
highest activity for oxygen reduction reaction (ORR) in 0.1M HClO4. As the cathode catalyst, the
maximum power density produced from MFC with Pt2-Ni/C (1724 mW m-2) was 22% higher than that
with commercial Pt/C (1413 mW m-2).
Keywords: Pt-Ni alloy; Oxygen reduction reaction; Electrocatalyst; Cathode; Microbial fuel cell
1. INTRODUCTION
[5]. The most sustainable electron acceptor is oxygen due to its easy availability in the environment and capacity to produce high power output [6].
To achieve commercial application of MFC, several limiting factors need to be considered, the biggest technical challenge in MFC is the poor kinetics of the cathodic reaction and the high costs of Pt-based electrocatalysts [7], even on the most active Pt surface, the over-potential of ORR is considerable. Although significant advances have been made for developing non-Pt catalysts in recent years, Pt-based catalysts still represent the highest ORR activity [8, 9]. Currently, the commercial ORR catalyst is in a form of fine Pt nanoparticles (~3 nm) dispersed on carbon supports (Pt/C) [10]. While the mass activity of this type of cathode catalyst is still far from satisfactory, an even more serious problem for these materials is their exorbitant price and poor stability. The Pt-based catalyst is currently one of the key components in fuel cells, which accounts for about 30% of the cost of fuel cell manufacturing [11]. Due to the corrosion of the carbon support and the weak interaction between the catalyst and support [12], the Pt nanoparticles usually undergo aggregation, dissolution and Oswald ripening which would induce enormous loss of the electrochemical surface area (ECSA) and fuel cell performance during long-term operation [13].
Substantial improvement of catalyst performance for the ORR requires reducing the amount of Pt needed. Demonstrably the most feasible way to reduce the Pt loading, and enhance commercialize these devices, is to alloy Pt with other non-precious metals and improve the ORR activity. For this reason, Pt alloy has attracted growing interests for developing advanced electrocatalysts. The Pt based bi- or tri-metallic electrocatalysts, such as Fe [14-16], Ni [17, 18], Cu [19] and Cr [20] alloying with Pt has been found to exhibit obviously higher electrocatalytic activities towards the ORR than Pt alone in low-temperature fuel cells. Plenty of previous work demonstrated that alloying Pt with 3d transition metals is really a prospective approach to enhance catalytic activity and durability for everyday catalytic applications. Among different Pt alloy catalysts used for the ORR, Pt-Ni alloy catalysts have been extensively studied and showed 1.3-20 folds higher mass activity compared to pure Pt [21-25]. However, most of Pt alloy syntheses routes have reported being quite complicated, and synthetic circumstances were relatively severe. They either need to reflux for a long time under inert gases or annealed at high temperatures. These will add the cost of the catalyst and hinder its large-scale application. Moreover, the optimal content of cobalt in Pt-Ni alloy is still not very clear.
Ethylene glycol is widely used as a reducing agent for the preparation of metal nanoparticles, but the reduction reaction of a metallic nickel in the alcohol process needs to be activated by high temperature or microwave irradiation [26], and the ethylene glycol is moderately toxic to humans. Previous studies have proven that a partially oxidized species produced from ethylene glycol could serve as an efficient stabilizer to prevent the growth of metal NPs during the formation of a highly dispersed carbon-supported Pt catalyst with a narrow particle-size distribution [27, 28]. As a low-toxicity alcohol, glycerol has three hydroxyl groups, may be used as an efficient stabilizing agent and is environmentally friendly. NaBH4, a stronger reducing agent, can reduce metallic ions at room
temperature. Therefore, well-dispersed and narrow particle-size distribution Pt-based electrocatalysts may obtained by NaBH4 reduction in a glycerol solution at room temperature.
procedure at room temperature without further heat treatment. Alloy catalysts with varying Pt:Ni atomic ratios were fabricated to better understand the effect of Pt-Ni composition on the ORR activity. Inductively coupled plasma atomic emission spectrometer (ICP-AES), X-ray diffraction (XRD) and transmission electron microscopy (TEM) were used to evaluate the composition and structure. Electrochemical activity towards ORR in 0.1 M HClO4 were examined. Finally, the synthesized Pt-Ni
alloys were applied as the cathode catalyst in air cathode MFCs, and their performances were compared with that of a commercial Pt/C catalyst.
2. EXPERIMENTAL
2.1. Electrocatalyst preparation
Pt-Ni binary electrocatalysts were use Vulcan XC-72 (Cabot, BET surface area of 235 m2 g-1, denoted as C) as the carbon support, H2PtCl6·6H2O (Aladdin) and Ni(NO3)2·6H2O (Aladdin) as Pt and
Ni precursor, respectively. The carbon support (80 mg) was dispersed with known amounts of Pt and Ni precursor in glycerol (Aladdin) with ultrasonic (150 W) and stirring treatment for 1.5 h. Sodium borohydride (Aladdin) 0.2 g was added to the mixed solution slowly, only with vigorous stirring. After stirring at room temperature for 4 hours, an aqueous solution of 20 mL 10% HCl was added. Ten minutes later, the black precipitate was isolated by centrifugation at 8000 rpm, washed with abundant ultra-pure water and then dried at 60 °C vacuum overnight to obtain a carbon-supported Pt-Ni alloy catalyst [29]. To find out the best atom ratio of Pt:Ni, three kinds of carbon-supported Pt-Ni alloy catalysts (Pt3-Ni/C, Pt2-Ni/C, Pt-Ni/C ) were prepared by reducing the Pt and Ni precursor with NaBH4
in glycerol solution. Metal loading are 20 wt.% for all the catalyst’s synthesis system.
2.2. Physical characterization
Structural features of various catalysts were studied by XRD (D-MAX 2200VPC, RIGAKU) using Cu Kα radiation (λ= 0.15406 nm) operating at 40 kV and 250 mA. Data collection was
implemented in the scanning angle range of 10 to 90° with a scan rate 5° min-1
. The crystallite size of the catalysts was estimated from XRD data using the Scherrer equation. All XRD patterns were analyzed by the software Jade 6.0. TEM images were obtained on a JEOL-2010 at an acceleration voltage of 200 kV. The catalyst sample was dispersed in ethanol, and a drop was placed on a copper grid, followed by solvent evaporation in air at room temperature. The particle size distribution of the NPs was analyzed using the software Digital Micrograph Demo with 200 particles inside a TEM image being selected. All of the catalysts were subjected to elemental analysis via ICP-AES (Optima 2100) before the tests were performed.
2.3. Electrochemical activity
treatment for at least 30 minutes. Measured volume of this ink was deposited on a freshly polished glassy carbon disk (5 mm in diameter), then dried at room temperature. Each electrode contained 18 μg cm-2 of the total metal. All chemicals used were of analytical grade. Electrochemical measurements were carried out by an Autolab potentiostat/galvanostat (PGSTAT302N) with rotation control (AFMSRCE, Pine Instruments) in a conventional three-electrode cell. A saturated Ag/AgCl electrode was used as the reference and a Pt wire as the counter electrode. Rotating disk electrode (RDE) was used to evaluate the catalytic activity for the ORR. Electrochemical experiments were performed in 0.1 M HClO4 electrolyte. Electrolytes were deaerated by high-purity nitrogen or oxygen. And a gentle
nitrogen or oxygen flow was kept above the electrolyte solutions surface during the measurements. All electrochemical experiments were performed at room temperature. The electrochemical surface area (ECSA) of the Pt based catalyst was calculated by integrating hydrogen adsorption charges. The charge of monolayer adsorption of hydrogen on Pt was assumed to be 210 μC cm-2 [30].
2.4. Microbial fuel cell test 2.4.1. Electrode preparation
Activities of the catalysts were evaluated using single chamber air cathode MFCs. The MFC was self-assembled according to the previous work [31]. Carbon cloths (3×5 cm) (type A, non-wet proofed, E-TEK) were used as anodes. And all the anodes were first cleaned by dipping them in pure acetone (Aladdin) for a night, subsequently treated by soaking the carbon cloths in a solution of concentrated sulfuric acid (100 mL L-1) and ammonium peroxydisulfate (200 g L-1) for 15 min. After that, heat treating the carbon cloths in a muffle roaster at 450 ºC for 30 min. Before being used in MFCs, all the cloths were washed three times with ultra-pure water. Cathodes were also made of carbon cloths with a 4.5 cm2 projected surface area; the waterproof layer was made according to the following method, lightly coated with of a mixture of poly tetrafluoroethylene (PTFE, 60%) and Vulcan XC-72 (2.5 mg cm-2) at the first layer, two hours later, heat treated the carbon cloth in a muffle roaster at 370 ºC for 30 min, and four layers of PTFE (30%) were coated on the air-facing side with heat treating. The catalytic layer was then made as follows: Defined amount of as prepared catalysts (with metal loading of 0.4 mg cm-2), 5 wt% Nafion solution 200 µL and pure iso-propanol 100 µL were mixed in a plastic sample vial, then coat the suspension onto the surface of water-facing side of the cathode. For comparison, the cathode coated with commercial Pt/C (0.4 mg cm-2 of Pt) was prepared by the same process. All the cathodes must be dry at room temperature for at least 24 hours before use.
2.4.2. MFC construction and operation
other side of the MFC, with a distance of 1.0 cm away from the cathode and without proton exchange membrane between the two electrodes. Pre-domesticated bacteria from another MFC were used to inoculate the single chamber MFCs. MFC reactors were filled with a solution containing 1 g L-1 glucose, and a phosphate buffered solution medium described as previous work [32, 33]. At the end of each cycle, when the voltage was less than 50 mV, the solution was replaced. All tests were proceeding in 30 °C, and two parallel MFCs were carried out for each catalyst.
After the voltage output was in steady-state kept 20,000 Ω for two hours. Polarization and power density curves of the MFCs were obtained by measuring the stable voltage at 10 min intervals generated under various external resistances (R) varying from 20,000 to 20 Ω. The voltage was collected by a data-acquisition system connected to the computer, and the power density (P, mW m-2) was obtained through the formula (1).
2 cell
ex
V R A
P (1)
and the current density (I, A m-2) was calculated by the formula (2).
cell ex V I R A (2)
where A is the project area of the cathode. Internal resistance (Ri) was obtained by linear
regression of voltage and current plots, and the open circuit voltage (OCV) was the voltage calculated at zero current.
3. RESULTS AND DISCUSSION
3.1. Physical characterization
Pt-Ni alloy catalysts were synthesized by a simple NaBH4 reduced method with the glycerol as
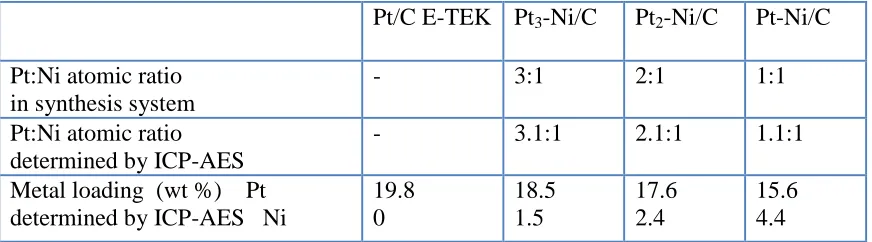
[image:5.596.82.518.615.736.2]a stabilizer and solvent at room temperature, without the reflux and heat treatment. The actual composition of the catalyst was obtained by ICP-AES analysis. The evaluated results from ICP-AES for all the catalysts compositions are listed in Table 1.
Table 1. Pt-Ni atomic ratio, metal loading of the four catalysts.
Pt/C E-TEK Pt3-Ni/C Pt2-Ni/C Pt-Ni/C
Pt:Ni atomic ratio in synthesis system
- 3:1 2:1 1:1
Pt:Ni atomic ratio determined by ICP-AES
- 3.1:1 2.1:1 1.1:1
Metal loading (wt %) Pt determined by ICP-AES Ni
The actual compositions of Pt in the as-prepared Pt-Ni bimetallic catalysts are found to be almost the same as the stoichiometric values, but the Ni component is a little lower than the stoichiometric values, this may ascribe to the HCl added at the end of the synthesis. These results show that the Pt and Ni were successfully reduced. Ni may be alloyed with Pt for the glycerol stabilized NaBH4 reduction procedure used.
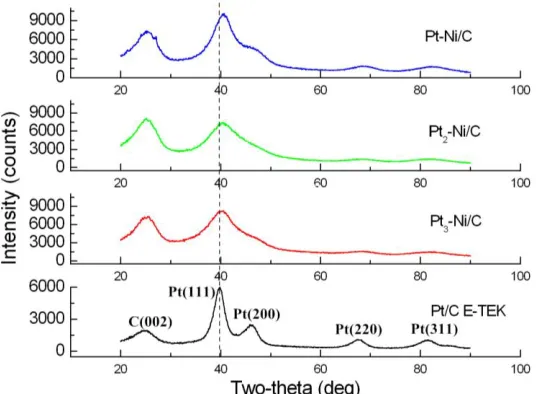
XRD patterns of carbon supported Pt and Pt-Ni alloy catalysts recorded in the 2θ range of 20°-90° are shown in Fig. 1. The diffraction peak at around 2θ value of 25° corresponds to the (0 0 2) plane of the carbon support, and the peaks centered at about 40°, 47°, 68° and 82° are attributed to the Pt (1 1 1), (2 0 0), (2 2 0) and (3 1 1) crystalline planes, respectively, corresponding to the crystalline Pt with face-centered cubic structure. In the Pt-Ni alloy catalyst, no crystalline form of Ni was noticed, and the reflection peaks of the Pt-Ni alloy samples are switched to higher angles compared to the Pt/C, revealing the lattice parameters decreased and a high level of alloy. And it indicates that by the incorporation of Ni component into the Pt, the lattice has contracted due to alloy formation. This will decrease the binding strength and/or coverage of oxygenated adsorbate on the catalyst. It may enhance ORR activity. Crystallite size of the Pt/C E-TEK (3.4nm), Pt3-Ni/C (3.0nm), Pt2-Ni/C (2.8nm) and
Pt-Ni/C (2.6nm) calculated from XRD data utilize the Scherrer equation by Jade software, which the (2 2 0) peak of the Pt was selected. The sizes of the catalyst prepared in this study are relatively small, which was attributed to the use of glycerol as stabilizer and without high-temperature annealing. The crystallite size of the as prepared catalyst is decreasing with the Ni component increasing.
[image:6.596.167.435.432.629.2]
Figure 1. XRD patterns of the carbon supported Pt and Pt-Ni alloy catalysts.
to the crystallite size calculated with the XRD. And Pt-Ni alloy catalysts synthesized in this report are with narrow particle size distribution and well-dispersed. Both the activity and the reaction mechanism may be affected by the particle size. Pt-size effect is due to enhance the energy of adsorption of anions, in particular OH (OHad formed from oxidation of water) on smaller particles with decreased average
coordination numbers. The lattice fringe of Pt/C E-TEK catalysts is 0.19±0.06, corresponding to the (200) interplanar distance of face-centered cubic Pt. While the d-spacing of Pt3-Ni/C, Pt2-Ni/C and
Pt-Ni/C is 0.21±0.05, 0.22±0.05 and 0.22±0.04 nm, corresponding to the (111) interplanar distance of fcc PtNi (as shown in the inset of Fig.3). These are indicating that the pure Pt nanoparticles grow along the {200} direction while Pt-Ni alloy {111}. And these will enhance the ORR activity.
Figure 2. TEM images of (a) Pt3-Ni/C, (b) Pt2-Ni/C, (c) Pt-Ni/C and (d) Pt/C E-TEK catalysts .
3.2. Electrochemical activity
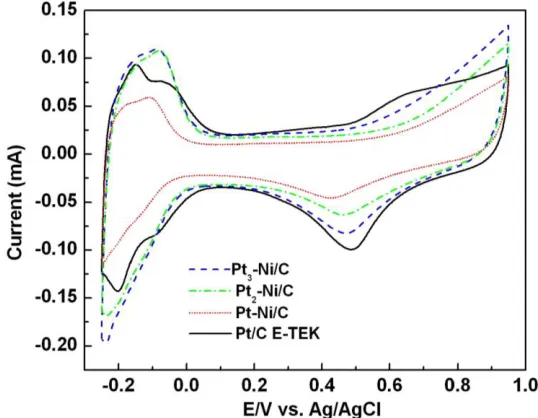
The electrochemical properties of the Pt-Ni alloy catalysts were first evaluated in N2 saturated
0.1 M HClO4 with a scan rate 100 mV s-1 between 0.06 V and 1.2 V (vs. RHE). The potential was
constantly cycled between 0.06 V and 1.0 V for 20 cycles till a stable cyclic voltammetry (CV) was recorded. Fig. 4 shows the CVs of the Pt/C E-TEK, Pt3-Ni/C, Pt2-Ni/C and Pt-Ni/C catalysts, the
[image:7.596.139.457.253.575.2]
polycrystalline Pt [9]. Electrochemical surface areas (ECSAs) of all CV curves were normalized by corresponding integrating hydrogen adsorption charges. Commonly accepted value for Pt is 210 μC cm-2. The ECSAs of these catalysts measured by CVs is listed in Table 2. The ECSAs of Pt3-Ni/C and
Pt2-Ni/C are bigger than the commercial Pt/C, and the Pt2-Ni/C possesses the largest ECSA (81 m2 g-1)
in this work, which was 1.53 times as large as the ECSA of Pt/C E-TEK. ORR catalytic activity depends greatly on the ECSA of the catalyst; therefore, these Pt-Ni alloy catalysts with large ECSA may show commendable electro-catalytic activities.
Figure 3. Cyclic voltammograms (CVs) for carbon supported Pt and Pt-Ni alloy catalysts in N2
[image:8.596.160.429.224.433.2]-saturated 0.1 M HClO4; scan rate 100 mV s-1 .
Table 2. Electrochemical surface area, onset potential, half-wave potential and mass activities of Pt/C and Pt-Ni alloy catalysts.
Pt/C E-TEK Pt3-Ni/C Pt2-Ni/C Pt-Ni/C
Electrochemical surface area (m2 g-1)
53 72 81 45
Onset potential (V vs. Ag/AgCl)
0.606 0.626 0.630 0.565
Half wave potential (V vs. Ag/AgCl)
0.460 0.486 0.511 0.414
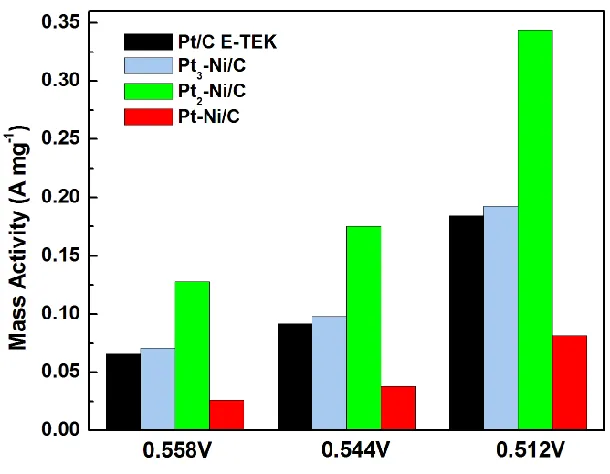
Mass activity (A mg-1Pt )
at 0.512V (vs. Ag/AgCl)
0.183 0.192 0.345 0.083
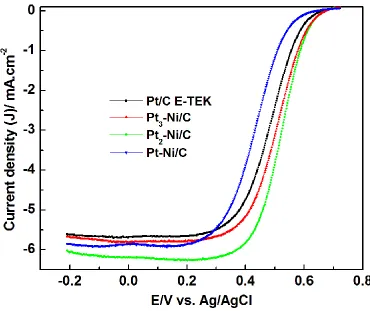
Linear sweep voltammetry (LSV) of carbon supported Pt and Pt-Ni alloy catalysts are measured in O2-saturated 0.1 M HClO4 at a scan rate of 10 mV s-1. Fig. 4 shows the ORR polarization
[image:8.596.47.538.544.680.2]
current region between -0.2 and ~0.25 V and the mixed kinetic-diffusion control region from ~0.25 to ~0.6 V. All the onset potentials of the catalysts is listed in Table 2. They are following the order Pt2
-Ni/C > Pt3-Ni/C > Pt/C E-TEK > Pt-Ni/C. The half-wave potential (E1/2)of an ORR polarization curve
is often used to evaluate the electrocatalytic activity of a catalyst. As shown in Table 2, the E1/2
decreased in the order of Pt2-Ni/C > Pt3-Ni/C > Pt/C E-TEK > Pt-Ni/C. The Pt2-Ni/C exhibits
remarkable ORR activity improvements of Pt/C E-TEK and other alloy catalysts. The E1/2 of ORR
curves of the Pt2-Ni/C and Pt3-Ni/C is about 51 mV and 26 mV positively shifted as compared to that
[image:9.596.109.479.235.546.2]of the Pt/C E-TEK, respectively.
Figure 4. ORR polarization curves for the Pt-Ni alloy and Pt/C E-TEK catalyst in an O2-saturated 0.1
M HClO4 solution with a sweep rate of 10 mV s-1 and a rotation rate of 1600 rpm.
Fig. 5 show the mass activities of the above different catalysts calculated from the results shown in Fig. 4 at different potentials, and the compositions were identified using ICP-AES analysis of the corresponding samples. Mass activities of the catalysts are following the order of Pt2-Ni/C > Pt3
-Ni/C > Pt/C E-TEK > Pt--Ni/C, as shown in Table 2. The above results reflect that the Pt2-Ni/C catalyst
Figure 5. Mass activities for different materials.
Table 3. Comparison the parameters of the four MFCs with different catalysts
Pt/C E-TEK Pt3-Ni/C Pt2-Ni/C Pt-Ni/C
Maximum power density (mW m-2)
1413 1581 1724 1294
Internal resistance (Ω) 216 151 143 159
Open circuit voltage (V) 0.76 0.77 0.78 0.77
3.3 Microbial fuel cell tests
To evaluate the utility of different catalysts, the performance of MFC with the Pt/C E-TEK, Pt3-Ni/C, Pt2-Ni/C and Pt-Ni/C catalysts as the cathode was monitored at 303 K and 1 atm. The
measured power densities and the polarization curves of the MFCs are shown in Fig. 6. Table 3 summarized the main parameters of MFCs. Obviously; the maximum power density of the MFC with Pt3-Ni/C and Pt2-Ni/C alloy catalyst were significantly higher than that of the commercial Pt/C. In this
study, Pt2-Ni/C shows the highest ORR activity in the MFC test. The maximum power density
produced from MFC with Pt2-Ni/C (1724 mW m-2) was 22% higher than that with commercial Pt/C
[image:10.596.61.537.396.516.2]
Figure 6. Power density curve and polarization curve for Pt/C E-TEK , Pt3-Ni/C, Pt2-Ni/C and Pt-Ni/C
catalyst of the MFCs .
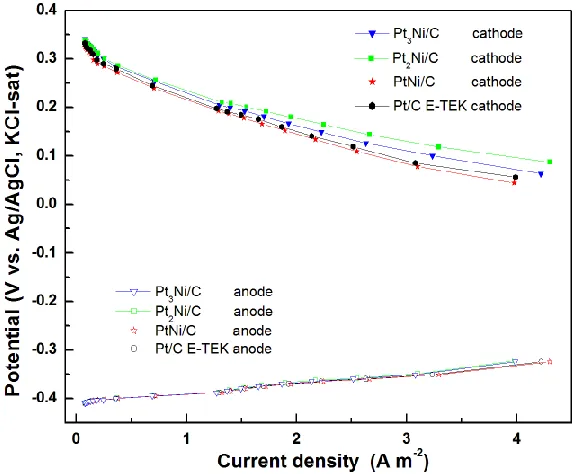
Figure 7. Individual electrode potentials (vs. Ag/AgCl KCl-sat) versus current density curves.
[image:11.596.154.444.429.666.2]
obvious that cathode potentials followed the same trend as the power density curves, and anode potentials behaved almost the same for different MFCs, providing evidence that the difference on the MFC performances mainly resulted from the variation of the catalytic activity of the catalysts in cathodes. These results are strongly supported that the MFC performance enhancement is derived from Pt-Ni alloy catalyst enhanced the ORR.
The electrochemical properties of the catalyst, in particular, electrical conductivity, will make different internal resistance of MFC. Because of the Rin consists of two parts: the first is electronic
ohmic losses caused by the movement of electrons through the electrolyte, and the second is electronic ohmic loss caused by electrons through the electrode and the wire. The MFCs used in this study using the same configuration (such as, anode materials, electrode distance and dimension), differences of Rin
between MFCs may have originated from the electrical properties of different cathodes, especially the conductivity. Internal resistances were estimated from the slope of the plot of voltage versus current, and listed in Table 3. All the internal resistances of MFCs with the alloy catalysts are lower than the Pt/C E-TEK. Among the prepared catalysts, the MFC with Pt2-Ni/C showed the lowest internal
resistances (143 Ω). This may indicate that the conductibility of the Pt2-Ni/C in this paper is better than
the commercial Pt/C catalyst [34]. All the Open circuit voltage (OCV) of the MFC coated with Pt-Ni alloys cathode were a little higher than that with a Pt/C E-TEK cathode, shown in Table 3, demonstrating that the alloy catalysts produced a potential closer to the thermodynamic equilibrium potential for oxygen reduction to water, compared to the Pt/C E-TEK catalyst.
4. CONCLUSIONS
In this study, we successfully fabricate a series of nanostructure Pt-Ni alloy catalysts with varying Pt:Ni ratio by a facile method (glycerol stabilized NaBH4 reduction at room temperature). The
Pt-Ni alloy nanoparticles are 2.4-3.0 nm and all the metal are highly dispread on carbon support, and the Pt-Ni alloys possess higher ECSA and 0.45-1.9 times mass activities of Pt for ORR than those of the commercial Pt/C catalyst in acid solution. The results presented above bring out the role of Ni in the bimetallic catalyst clearly, and the Pt2-Ni/C shows the best ORR performance. This special catalyst
design method may be utilized in the preparation of superior activity and durability Pt based catalyst for the ORR especially in MFC.
ACKNOWLEDGEMENTS
The work was financially supported by the National Natural Science Foundation of China (31400044, 51473074), the General and Special Program of the postdoctoral science foundation China (2013M530397, 2014T70861)
Reference
3. D.R. Lovely, Curr. Opin. Biotech, 17 (2006) 327
4. Y. Li, A.H. Lu, H.R. Ding, X. Wang, C.Q. Wang, C.P. Zeng, Y.H. Yan, Electrochem. Commun, 12 (2010) 944
5. S. E. Oh, B. Min, B. E. Logan, Environ. Sci. & Technol, 38(18) (2004) 4900 6. L. Feng ,Y. Chen, L. Chen, ACS nano, 5(12) (2011) 9611
7. S. Khilari, S. Pandit, M. M. Ghangrekar, et al. RSC Advances, 3(21) (2013) 7902 8. H. A. Gasteiger and N. M. Markovic, Science, 324 (2009) 48
9. A. Morozan, B. Jousselme and S. Palacin, Energy Environ. Sci., 4 (2011) 1238
10. H. A. Gasteiger, S. S. Kocha, B. Sompalli and F. T. Wagner, Appl. Catal., B, 56 (2005) 9 11. J. D. Aiken, R. G. Finke, J. Mol.Catal. A, 145 (1999) 1
12. C. K. Acharya, W. Li, Z. F. Liu, G. Kwon, C. H. Turner, A. M. Lane, D. Nikles, T. Klein, M. Weaver, J. Power Sources, 192(2) (2009) 324
13. Z. Z. Jiang, Z. B. Wang, Y. Y. Chu, D. M. Gu and G. P. Yin, Energy Environ. Sci., 4 (2011) 728 14. W.Z. Li , Q. Xin, Y.S. Yan, Int. J. Hydrogen Energ., 35 (2010) 2530
15. A. M. Castro Luna , A. Bonesi , W. E. Triaca , V. Baglio ,V. Antonucci and A. S. Aricò , J. Solid State Electrochem., 12 (2008) 643
16. S. J. Guo, S. H. Sun, J. Am. Chem. Soc., 134 (2012) 2492
17. U. A. Paulus, A. Wokaun , G. G. Scherer ,T. J. Schmidt , V. Stamenkovic , V. Radmilovic ,N.M. Markovic , P. N. Ross, J.Phys. Chem. B, 106 (2002) 4181
18. T. Toda, H. Igarashi, H. Uchida, M. Watanabe, J. Electrochem. Soc., 146 (1999) 3750 19. C.H. Cui, H.H. Li , X.J. Liu , M.R. Gao, S.H. Yu, ACS Catal., 2 (2012) 916
20. C.V. Rao, A.L.M. Reddy , Ishikawa Y, P. M. Ajayan, Carbon, 49 (2011) 931
21. D. F. van der Vliet, C. Wang, D. Tripkovic, D. Strmcnik , X. F. Zhang, M. K. Debe , R. T. Atanasoski, N. M. Markovic, V. R. Stamenkovic, Nat. mater., 11(12) (2012) 1051
22. Q. H. Huang, H. Yang, Y. W. Tang, T. H. Lu, D. L. Akins, Electrochem. Comm., 8 (2006) 1220 23. C. Wang, G.F. Wang , D.V. Vliet , K.C. Chang , N. M. Markovic, V. R. Stamenkovic, Phys. Chem.
Chem. Phys., 12 (2010) 6933
24. M. Oezaslan , F. Hasch´e , P. Strasser, J. Electrochem. Soc., 159 (2012) B394
25. D. L. Wang, H. L. Xin, R. Hovden, H. S. Wang, Y. C. Yu , D. A. Muller, F. J. DiSalvo, H. D. Abruña, Nat. Mater., 12 (2012) 81
26. E. Lebègue, S. Baranton, C. Coutanceau, J. Power Sources, 196 (2011) 920
27. Z. H. Zhou, S. L. Wang, W. J. Zhou, G. X. Wang, L. H. Jiang, W. Z. Li, S. Q. Song, J. Q. Liu, G. Q. Sun, Q. Xin, Chem. Commun., 3 (2003) 394
28. W. Z. Li, C. H. Liang, W. J. Zhou, J. S. Qiu, Z. H. Zhou, G. Q. Sun, Q. Xin, J. Phys. Chem. B, 107 (2003) 6292
29. Z. H. Yan, M. Wang, J. F. Liu, R. M. Liu and J.S. Zhao, Electrochim. Acta, 141 (2014) 331 30. W.B. Cai, B. Ren, X.Q. Li, C.X. She, F.M. Liu, X.W. Cai, Z.Q. Tian, Surf. Sci., 406(1) (1998) 9 31. Y. J. Feng , Q. Yang, X. Wang, B. E. Logan, J. Power Sources, 195 (2010) 1841
32. D. R. Lovley, E. J. Phillips, Appl. Environ. Microb., 54 (1988) 1472 33. S. A. Cheng, H. Liu , B. E. Logan, Electrochem. Commun., 8 (2006) 489