Int. J. Electrochem. Sci., 10 (2015) 2839 - 2858
International Journal of
ELECTROCHEMICAL
SCIENCE
www.electrochemsci.org
Voltammetric Behavior of a Chemically Modified
Silsesquioxane with
4-Amino-5-Phenyl-4h-[1,2,4]-Triazole-3-Thiol and its Application for Detection of L-Dopamine
Daniela Rodrigues Silvestrini, Tayla Fernanda Serantoni da Silveira, Urquisa de Oliveira Bicalho, Devaney Ribeiro Do Carmo*
Faculdade de Engenharia de Ilha Solteira UNESP - Universidade Estadual Paulista “Júlio de Mesquita Filho” - Departamento de Física e Química, Av. Brasil Centro, 56 – Ilha Solteira, SP, Brasil. CEP. 15.385-000. Fax: +55 (18) 3742-4868.
*
E-mail: docarmo@dfq.unesp.feis.br
Received: 9 December 2014 / Accepted: 24 January 2015 / Published: 24 February 2015
A hybrid nanocomposite formed by interaction of a octakis(3-chloropropyl)octasilsesquioxane (SS) modified with 4-Amino-5-Phenyl-4H-1,2,4-Triazole-3-Thiol (APhTT), and its subsequent reaction with copper and hexacyanoferrate (III) (CuHSA) was incorporated into a graphite paste electrode and the electrochemical studies were conducted with cyclic voltammetry. The cyclic voltammogram of the graphite paste electrode modified with CuHSA, showed one redox couple with average potential Eθ’= 0.71V (vs Ag/AgCl(sat.)), attributed to the CuIIFeII(CN)6/CuIIFeIII(CN)6 process (20% w/w; v=20 mV s -1
; KCl; 1.00 mol L-1). The graphite paste electrode modified with CuHSA allowed the electrocatalytic determination of L-Dopamine using electrochemical techniques such as, cyclic voltammetry and differential pulse voltammetry. Through differential pulse voltammetry was possible to evidence two linear regions in the studied concentration range and the detection limit obtained by this technique was lower than that obtained by the technique of cyclic voltammetry.
Keywords: Octakis(3-chloropropyl)octasilsesquioxane; 4-Amino-5-Phenyl-4H-[1,2,4]-Triazole-3-Thiol; Voltammetry; Graphite Paste Electrode; L-Dopamine.
1. INTRODUCTION
Silsesquioxanes are nanostructured materials which have the empirical formula (RSiO1.5)n
The octahedral cubic silsesquioxanes species (cubes), whose typical structure is (RSiO1.5)8, that
is, they hold 8 silicon atoms located at the vertices of its structure [3,5-7]. One or more groups (R) can be reactive or polymerizable, which endows the POSS molecule with higher reactivity and solubility in organic solvent.[1] These nanostructured materials have diameters ranging from 1 to 3 nm and are considered the smallest possible silica based particles [2].
Due to the structural similarities and electronic properties exhibited by the silanol groups these materials can mimic the reactivity of silanol groups on the silica surface and these properties are responsible for major advances in understanding the physico-chemical behavior of silsesquioxanes [1,8].
Polysilsesquioxanes are generally synthesized by hydrolytic condensation of the monomer RSiX3 [3,8-11] where R is an organic group and X is -Cl, -OH, -OR –NH2 (alkoxide) or OAc
(acetoxy). The X groups can be hydrolyzed to form Si-OH reactive groups, which can then condense with the formation of bridges Si-O-Si [11,12].
The advantages of using POSS rather than other molecules, such as clays, carbon fibers and carbon nanotubes, is because they are much smaller and have a monodispersed size, low density, and are readily modified chemically to generate a series of reactive substituents to suit a particular application [4]. When organo or inorgano functionalized, silsesquioxanes can improve their chemical and physical properties [2,3,5], for instance, in the adsorption field they can be used to increase the sorptive capacity of metal ions in aqueous or organic solutions [13-15].
The derivatives of POSS can have a hybrid architecture (inorganic/organic) with an internal inorganic structure formed by silicon and oxygen, which is externally covered by organic substituents [16]. These materials are prepared by functionalization reactions in which the organic compound is bonded to the peripheral groups of POSS [17].
The silsesquioxanes have a large number of applications, and the majority of these applications increases when these structures are used as precursors in the formation of organic-inorganic hybrid materials [18, 19].
Such materials exhibit a number of features that permit the your applications in different research areas such as : electronic devices [20], biosensors [2, 4, 5], catalysts [2, 3, 8, 16, 21, 22, 23], electrocatalyst [24,25], electroactive and thin films [26, 27],adsorbents of organic and metal species [28, 29], polymers [2, 4], fuel cells [3], liquid crystals [3, 4], optical fiber coatings [3], additives [3, 30, 31], optical devices [5], antibacterial and biocides [32], core for dendrimers and dendrimers precursors [33] and silica interface precursors [12]. Additionaly , cubic silsesquioxanes have its importance in transition metal complexes and also been used in the formations of metal nanoparticles and can form monolayers on gold surfaces [34].
In the last five years, the chemistry of polyhedral silsesquioxane has been extensively reviwed [35-39] and to our knowledge there are relatively few studies which have utilised electrodes chemically modified with silsesquioxane.However are arousing great interest in the area of electrochemistry, due to easy preparation and by possibility of those materials act as power electrocatalysts [40, 41].
Additionaly, based on our interest in developing modified electroactive hybrid composites for electroanalytical purposes, was proposed an electroanalytical application of this material. The functionalization of polyhedral oligosilsesquioxane with the 4-Amino-5-Phenyl-4H-[1,2,4]-Triazole-3-Thiol, (SA), and respective interactions with Cu2+ and potassium ferrocyanide (III) following two stages. At the first stage, the SA adsorbs Cu2+ and in the second step the composite formed (CuSA) reacts with hexacyanoferrate (III) forming a new composite (CuHSA). This ligand possesses S–C–N linkages and displays potential ligands for metal complexes that may also be biologically active just like some other amine- and thione-substituted trizoles [34]. Thus, the interest in using this ligand is due to the fact that it has NH2 sites conducive to organofunctionalization with
octakis(3-chloropropyl)octasilsesquioxane, as well as S groups that are excellent active sites for the adsorption of metal ions. Thus the S will serve as chelation of Cu2+ ions.
A synergistic effect can be provide by silsesquioxane. Additionally, the presence of octakis(3-chloropropil)octasilsesquioxane, which is an electron acceptor [22], can provide stabilizing microenvironment around the substrate. After rigorous voltammetric studies, the composite was tested in the electrocatalytic determination of L-Dopamine which is a neurotransmitter that exists in the mammalian central nervous system [42].
The detection of L-Dopamine was performated using cyclic voltammetry, square wave voltammetry and differential pulse voltammetry.
2. EXPERIMENTAL
2.1. Reagents and solutions
All reagents and solvents were of analytical grade (Merck or Aldrich) and were used as purchased and L-Dopamine was used without further purification. All solutions and supporting electrolytes were prepared using Milli-Q water. The L-Dopamine solutions were prepared immediately before use.
2.2. Electrochemical Measurements
Cyclic voltammograms were performed using the AUTOLAB PGSTAT (Metrohm Pensalab) potentiostat. A three electrodes system was used and it consisted of a modified working electrode (graphite paste electrode), an Ag/AgCl reference electrode and a platinum wire as the auxiliary electrode. The modified paste was prepared by mixing graphite/modifier (CuHSA) in different proportions (10, 20, 30, 40
preliminary study to select the best ratio of graphite paste. The measurements were carried out at 25ºC.
2.3. Synthesis of octakis(3-chloropropyl)octasilsesquioxane (SS)
800 ml of methanol, 27 ml of hydrochloric acid (HCl) and 43 mL of 3-chloropropyliltriethoxysilane were added into a round bottom flask of 1000 mL. The system was kept under constant stirring at room temperature for 6 weeks. The solid phase was separated by filtration in a sintered plate funnel, yielding a white solid, octakis(3-chloropropyl)octasilsesquioxane (SS), which was then oven dried at 120 ºC for 4 hours. Figure 1 illustrates a representative scheme of this synthesis.
Figure 1. Schematic representation of the preparation of octakis(3-chloropropyl)octasilsesquioxane (SS).
[image:4.596.73.525.184.335.2]2.4. Organofunctionalization of octakis(3-chloropropyl)silsesquioxane with 4-Amino-5-Phenyl-4H- 1,2,4-Triazole-3-Thiol (APhTT)
Figure 2. Organofunctionalization of octakis(3-chloropropyl)octasilsesquioxane (SS) with APhTT.
Octakis(3-chloropropyl)octasilsesquioxane (SS) was organofunctionalized using a 3-neck flask of 500 mL containing 200 mL of dimethylformamide (DMF), 9.7×10⁻³
of SS, previously dried at 100 °C for 2 hours, and 8.7×10⁻²
[image:4.596.71.531.444.650.2]
mixture was refluxed at 160°C with constant stirring for 48 hours, then the mixture was precipitated with water due to no formation of solid. After precipitation, the solid plate was separated in a sintered funnel and washed with deionized water. The material obtained was oven dried 100°C for 4 hours and described as SA. Figure 2 schematically illustrates the organofunctionalization process of SS with APhTT.
2.5. Formation of complex CuHSA
The CuHSA complexes were prepared as follows: 1.0 g of SA was added to 25 mL of a ketogenic solution of copper chloride 1.0×10⁻²
mol L-1. The mixture was stirred for 1h at room temperature. The solid phase was then filtered and washed thoroughly with deionized water. The material resulting from this first phase was designated as CuSA. In the second stage, the CuSA was added to a solution of 1.0×10⁻²
mol L-1 of potassium hexacyanoferrate (III) and the mixture was stirred for 40 minutes and then the solid was thoroughly filtered, washed with deionized water and dried at 70ºC. The material resulting from this stage was described by CuHSA.
2.6. Preparation of the graphite paste electrode modified with CuHSA
The graphite paste electrode modified with CuHSA was prepared by mixing 20 mg of CuHSA with 80 mg of
of 3 mm i.d. and 14 cm height, containing graphite paste. A copper wire was inserted through the opposite end of the glass tube to establish electrical contact. After homogenizing the mixture, the modified paste was carefully positioned on the tube tip to avoid possible air gaps, which often enhances electrode resistance. The external surface of the electrode was smoothed on soft paper. A new surface can be produced by scraping out the old surface and replacing the graphite paste.
2.7. Procedure
Cyclic voltammograms were recorded for study the sensibility of L-Dopamine by graphite paste electrode modified with CuHSA. The supra analite solutions were prepared immediately before use. In most of the experiments, 1.0 mol L-1 KCl was used as the supporting electrolyte. The catalytic and or sensibility current was estimated by the difference between the electrode current in the presence of analite compounds and that which is established in the blank solution.
3. RESULTS AND DISCUSSION
cm-1 is related to the stretching Si-O-Si(υSi-O-Si) corresponding to the cage-shaped structure of
silsesquioxane showing that the cubic structure of matrix was maintained. Other bands were observed in the region of 2900 cm-1 assigned to the axial deformation of the C-H(δC-H) bonds, present on both
precursors. The band at 3079 cm-1 was assigned to the axial deformation of N-H(δN-H) and about at
2870 cm-1 was attributed to axial deformation of S-H(δS-H) [44, 45]. The bands from 500 to 1600 cm-1
were related to the vibrations of the axial deformation of the ring bonds of APhTT. Also observed a decrease of absorption about at 689 cm-1 related to the vibrations C-Cl of the SS, thus showing its functionalization and suggesting that not all peripheral groups reacted with the ligand 4-Amino-5-Phenyl-4H-1,2,4-Triazole-3-Thiol.
Figure 3 (C) shows the spectrum in the infrared region for the modified material CuHSA. The spectrum shows typical vibrations of its precursor materials at ~1110 cm-1 for the asymmetric stretching Si-O-Si(ʋSi-O-Si) which corresponds to the cage shaped structure of silsesquioxane. The bands
at ~ 2930 cm-1 was attributed to the vibration of C-H(ʋC-H) bonds and from 2870 to 2930 cm-1 was
attributed to axial deformation of S-H(δS-H). The vibrations from 1200 to 1600 cm-1 was related to the
vibrations of the APhTT ring. It was also observed vibrations at ~2100 cm-1, which was attributed to C≡N(ʋC≡N) stretching, characteristic of the transition metal hexacyanoferrate, where in the
nanocomposite (CuHSA) the υC≡N is displaced about 64 cm-1 for higher frequencies (high energy)
relative to the potassium hexacyanoferrate (III), which is one indicative of the formation of the intervalence complex where CN- is connected to the metal centers FeIII-(CN)-CuII [46]. Additionally, it was possible to observe a vibration at 594 cm-1 related to the stretching Fe-C(υFe-C) [47].
4000 3500 3000 2500 2000 1500 1000 500
C-N N-H C=N S-H
C-H N-H O-H
Wavenumber (cm-1)
Si-O-Si N-H
C=N S-H
C-H
N-H O-H
T
ran
sm
it
tan
ce (
a.u.
)
Fe-C
Si-O-Si N-H C=N
C=N C-H
[image:6.596.159.428.443.677.2] N-H O-H
Figure 3. Vibrational spectra in the infrared region: (A) APhTT, (B) SA and (C) CuHSA.
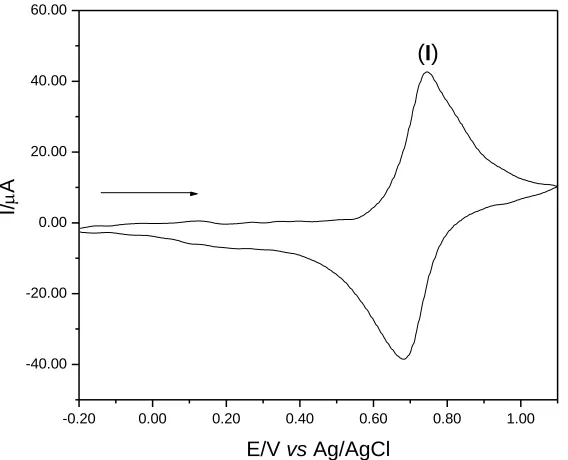
voltammogram of graphite paste modified with CuHSA (20% w/w). The voltammogram of CuHSA showed only a redox pair, Eθ'= 0.71 V, assigned to CuIIFeII(CN)6/CuIIFeIII(CN)6.
-0.20 0.00 0.20 0.40 0.60 0.80 1.00
-40.00 -20.00 0.00 20.00 40.00 60.00
(I)
I/
A
[image:7.596.149.433.152.382.2]E/V vs Ag/AgCl
Figure 4. Cyclic voltammogram of graphite paste modified with CuHSA (20% w/w; v = 20 mV s-1; KCl; 1.00 mol L-1).
Figure 5 illustrates the studies carried out on differents supporting electrolytes, such as KCl, NaCl, LiCl, KNO3 and NaNO3. It was observed that the nature of the cations and anions affected the
average potential (Eθ’) and the current intensities, as shown in Table 1. In addition, these studies indicate that there was formation of a crystal lattice to CuHSA system. The CuHSA is a compound analogous to Prussian blue and it exhibits a zeolite structure type, showing cavities that allow the inflow and outflow of some alkaline metal ions with smaller hydration radii [48-50].
-0.20 0.00 0.20 0.40 0.60 0.80 1.00
-40.00 -20.00 0.00 20.00 40.00 60.00
A
(I)
I/
A
E/V vs Ag/AgCl
-0.20 0.00 0.20 0.40 0.60 0.80 1.00
-40.00 -20.00 0.00 20.00 40.00 60.00
B (I)
I/
A
[image:7.596.311.484.596.734.2]
-0.20 0.00 0.20 0.40 0.60 0.80 1.00
-40.00 -20.00 0.00 20.00 40.00 60.00
C
(I)
I/
A
E/V vs Ag/AgCl
-0.20 0.00 0.20 0.40 0.60 0.80 1.00
-40.00 -20.00 0.00 20.00 40.00 60.00
D (I)
I/
A
E/V vs Ag/AgCl
-0.20 0.00 0.20 0.40 0.60 0.80 1.00
-60.00 -40.00 -20.00 0.00 20.00 40.00 60.00
I/
A
E (I)
[image:8.596.101.486.86.400.2]E/V vs Ag/AgCl
Figure 5. Cyclic voltammograms of graphite electrode modified with CuHSA in differents supporting electrolytes: (A) KCl, (B) NaCl, (C) LiCl, (D)NaNO3 and (E) KNO3 (20% (w/w), v = 20 mV s -1
, 1.00 mol L-1).
The ratio Ipa/Ipc and ΔEp were of ~1.00 to 1.26 and from 0.06 to 0.12, respectively, for the different supporting electrolytes tested, which suggests that the process CuIIFeII(CN)6/CuIIFeIII(CN)6 is
quasi reversible.
Table 1. Electrochemical parameters of the graphite paste modified with CuHSA in different supporting electrolytes (20% w/w, v = 20mVs-1, 1.00 mol L-1).
Supporting electrolyte
Ipa (μA) Ipc (μA) |Ipa/Ipc| Epa (V) Epc (V)
ΔEp (V) Eθ’ (V) Diameter of the hydrated cation (nm)**
KCl 3.81×10⁻⁵ 3.81×10⁻⁵ 1.00 0.74 0.68 0.06 0.71 0.24 NaCl 4.42×10⁻⁵ 3.50×10⁻⁵ 1.26 0.68 0.56 0.12 0.61 0.36 LiCl 2.20×10⁻⁵ 1.76×10⁻⁵ 1.25 0.65 0.55 0.10 0.60 0.47 NaNO3 4.72×10⁻⁵ 3.83×10⁻⁵ 1.23 0.68 0.57 0.11 0.62 0.36 KNO3 5.02×10
-5 4.56×10⁻⁵
1.10 0.75 0.68 0.07 0.71 0.24
[image:8.596.69.531.599.735.2]
It was observed that the voltammetric behavior of the CuHSA is different for all electrolytes tested due mainly to the diameter of the hydrated radius of the cation. The process of oxidation and reduction of compounds modified at the surface CuHSA occurs initially through equilibrium of the cation present in the supporting electrolyte with electrode surface containing material. The cation K+ and NH4+ have smaller hydration radii and therefore can more easily penetrate the crystal lattice
characteristic of the binuclear complex [48]. For subsequent voltammetric studies, KCl was used as supporting electrolyte, because it presented a better performance and voltammetric parameters.
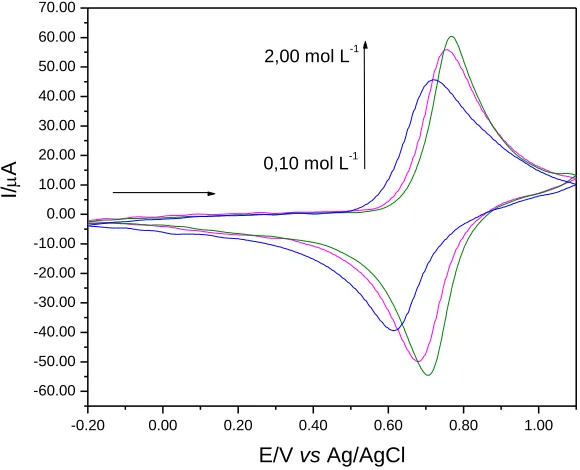
Figure 6 illustrates the cyclic voltammograms of graphite paste modified with CuHSA in different KCl concentrations (0.10-2.00 mol L-1). It was observed that the performance becomes different and there is an increase in the current intensity with increasing concentration of the supporting electrolyte. Through this study, it was observed that for the graphite paste electrode modified with CuHSA, the line slope was of 51.5 mV per decade of potassium ions (Figure 7), indicating that the behavior exhibited by the electrode approaches a nerstian process with transfer of an electron [51, 52].
It was also found that the relationship between the average potential and the logarithm (log) of the K + concentration of the redox pair showed a linear relationship, as shown in Figure 7, making clear that the redox process is highly dependent on the concentration of K+.
After this study, the concentration of the supporting electrolyte chosen to continue the ensuing studies was 1.00 mol L-1 due to the better voltammetric performance.
-0.20 0.00 0.20 0.40 0.60 0.80 1.00
-60.00 -50.00 -40.00 -30.00 -20.00 -10.00 0.00 10.00 20.00 30.00 40.00 50.00 60.00 70.00
2,00 mol L-1
0,10 mol L-1
I/
A
[image:9.596.144.434.443.678.2]E/V vs Ag/AgCl
-1.20 -1.00 -0.80 -0.60 -0.40 -0.20 0.00 0.20 0.40
0.66 0.67 0.68 0.69 0.70 0.71 0.72 0.73 0.74
E
q '/ V
vs
Ag
/Ag
C
l
Log [K+]
Figure 7. Average potential (Eθ’) of graphite paste modified with CuHSA as a function of KCl concentration.
-0.20 0.00 0.20 0.40 0.60 0.80 1.00
-60.00 -40.00 -20.00 0.00 20.00 40.00 60.00
pH 8.00
pH 3.00
I/
A
[image:10.596.141.439.103.351.2]E/V vs Ag/AgCl
[image:10.596.144.433.444.687.2]
3.00 4.00 5.00 6.00 7.00 8.00 46.00
48.00 50.00 52.00 54.00 56.00 58.00 60.00 62.00
A
pH
Ipa/
A
3.00 4.00 5.00 6.00 7.00 8.00 -54.00
-52.00 -50.00 -48.00 -46.00 -44.00 -42.00 -40.00
B
pH
Ipc
/
[image:11.596.192.399.90.454.2]A
Figure 9. (A) Anodic current intensity (Ipa) and (B) cathodic current intensity (Ipc) as function of pH values (3.0 to 8.0) (20% w/w, v = 20mV s-1, KCl 1.0 mol L-1).
The cyclic voltammograms at different hydrogen ion concentrations (pH 3.0 to 8.0) obtained for CuHSA are illustrated in Figure 8. It was found that with the pH increase there is a increase in the current intensity. The Eθ’ remained constant about at 0.71 V. The current intensity is greater at higher pH due to the concentration of H+ ions, and these compete with K+ ions in the redox process.
Figure 9 illustrates the dependence of anodic and cathodic current intensity at different pH values for CuHSA. Through these graphs, it is observed that at pH between 3.00 to 5.00 the anodic current remains practically constant (ranging ~2.00 uA).For cathodic current occurs a variation of ~6.00 uA), but to pH ≥ 6.00 is much higher intensity of anodic current (~ 10.47 uA) and also the cathodic current intensity (~ 6.00 uA).
The pH value chosen for further studies was pH 7.00, since there is the possibility of conducting studies to determination electrocatalytic of drugs in a biological environment.
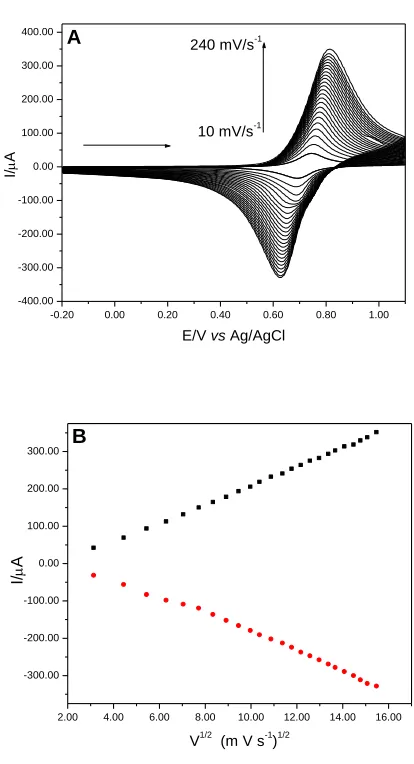
system scan rate and average potential (Eθ') remained constant at 0.71 V. It was observed that the scan rate increase provides an increase in the resistance, causing an increase in ΔEp at higher scan rates. The linear dependence of the current intensity of the anodic/cathodic peak and the square root of scan rate (Figure 10 (B)) characterizes a diffusion process [51].
-0.20 0.00 0.20 0.40 0.60 0.80 1.00 -400.00
-300.00 -200.00 -100.00 0.00 100.00 200.00 300.00 400.00
A 240 mV/s-1
10 mV/s-1
I/
A
E/V vs Ag/AgCl
2.00 4.00 6.00 8.00 10.00 12.00 14.00 16.00 -300.00
-200.00 -100.00 0.00 100.00 200.00 300.00 B
I/
A
V1/2 (m V s-1)1/2
Figure 10. (A) Cyclic voltammograms of the graphite paste modified with CuHSA at different scan rates (10-240 mV s-1) (20% w/w, KCl 1.0 mol L-1, pH 7.00). (B) Dependence on current intensity of the anodic and cathodic peaks with the square root of the scan rate.
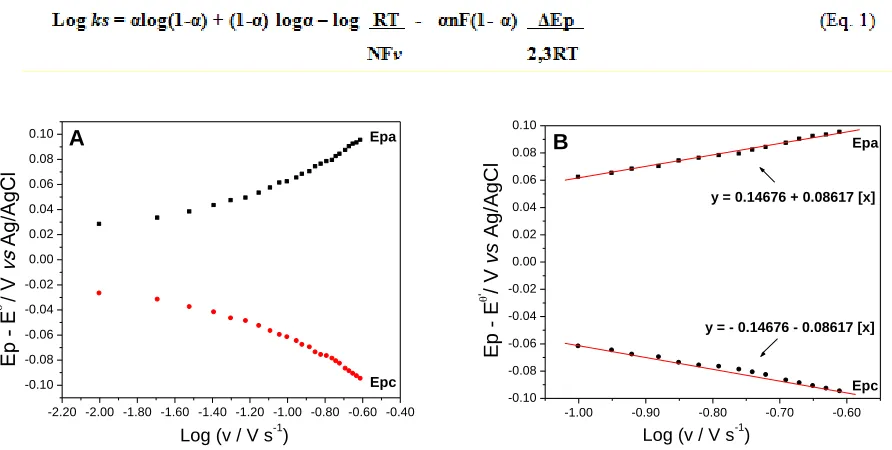
Figure 11 shows the Laviron’s graphic, where it is noted that the potential difference between the anodic (Epa) and cathodic (Epc) peaks and the formal potential (Ep - Eθ') is dependent on the potential scan rate. The Laviron´s equation can be applied to high and low scan rates, ΔEp> 200 n/mV and ΔEp <200 n/mV, respectively [53].
[image:12.596.189.396.152.534.2]
produces two lines with slope 2.3RT/(1-α)nF to anodic peak and -2.3RT/αnF to cathodic peak [54, 55].
-2.20 -2.00 -1.80 -1.60 -1.40 -1.20 -1.00 -0.80 -0.60 -0.40 -0.10 -0.08 -0.06 -0.04 -0.02 0.00 0.02 0.04 0.06 0.08 0.10 A Epc Epa
Log (v / V s-1)
E
p - E
' / V
vs
A
g/A
gC
l
-1.00 -0.90 -0.80 -0.70 -0.60 -0.10 -0.08 -0.06 -0.04 -0.02 0.00 0.02 0.04 0.06 0.08 0.10 B
y = - 0.14676 - 0.08617 [x] y = 0.14676 + 0.08617 [x]
Epc Epa
Log (v / V s-1)
Ep
E
' / V
vs
Ag/
AgC
l
Figure 11. (A) Laviron’s graphic, Epa and Epc vs. Log v. (B) Equation of the straight line of Laviron’s
graphic, Epa and Epc vs. Log v.
[image:13.596.75.521.108.333.2]Table 2 shows the electrochemical parameters used in making the Laviron’s graphic.
Table 2. Electrochemical parameters used in making the Laviron’s graphic.
Log of the scan rate (V s-1) Epa - Eθ’ (V) Epc - Eθ’ (V)
-2.00 0.028 -0.027
-1.69 0.033 -0.032
-1.52 0.038 -0.038
-1.39 0.043 -0.042
-1.30 0.047 -0.047
-1.22 0.049 -0.049
-1.15 0.053 -0.053
-1.09 0.057 -0.057
-1.04 0.061 -0.060
-1.00 0.062 -0.062
-0.95 0.065 -0.065
-0.92 0.068 -0.068
-0.88 0.070 -0.070
-0.85 0.074 -0.074
-0.82 0.076 -0.076
-0.79 0.078 -0.077
[image:13.596.69.531.463.757.2]
-0.74 0.082 -0.081
-0.72 0.084 -0.083
-0.69 0.087 -0.087
-0.67 0.090 -0.089
-0.65 0.092 -0.091
-0.63 0.093 -0.093
-0.61 0.095 -0.095
Assuming that an electron be involved in the redox process, and that α is equal to 0.315 and 0.685 for the anodic and cathodic peaks, respectively. The calculated value for ks was of 0.65 s-1.
3.1. Electrocatalytic oxidation of L-Dopamine by cyclic voltammetry
The electrocatalytic oxidation of L-Dopamine in the graphite paste electrode modified with CuHSA is illustrated in Figure 12, where it was observed that the graphite paste electrode unmodified in the absence of L-Dopamine (A) didn't show any redox pair in the potential range between -0.2 and 1.1 V, however, in the presence of L-Dopamine (B), it was possible to observe the redox process of the L-Dopamine with Eθ' = 0.39 V. The graphite paste electrode modified with CuHSA in the absence of L-Dopamine (C) exhibited a redox pair with Eθ' = 0.71 V, however, in the presence of L-Dopamine (D), there was an increase in anodic peak current intensity of the redox pair, followed by a slight increase in cathodic peak current intensity.
-0.20 0.00 0.20 0.40 0.60 0.80 1.00 -100.00
-50.00 0.00 50.00 100.00 150.00
D
B C
A
I/
A
E/V vs Ag/AgCl
Figure 12. Cyclic voltammograms of: (A) graphite paste electrode unmodified in the absence of L-Dopamine, (B) graphite paste electrode unmodified in presence of 4.00×10⁻³ mol L-1 of L-Dopamine, (C) graphite paste electrode modified with CuHSA in the absence of L-Dopamine and (D) graphite paste modified with CuHSA in presence of 4.00×10⁻³
[image:14.596.164.420.445.652.2]
The anodic peak current intensity increases due to the electrocatalytic oxidation of L-Dopamine. The FeIII produced during the anodic scan, chemically oxidizes the L-Dopamine, whereas FeIII is reduced to FeII is reduced, which will again be electrochemically oxidized to FeIII [56]. The electrochemical and chemical stages of the system are represented by equations 2 and 3, respectively [57, 58].
Where: DA = L-Dopamine and DAQ = Product of L-Dopamine oxidation (Dopamine-quinone) [59].
Figure 13 shows the voltammetric behavior of the system CuHSA after the additions of different aliquots of Dopamine. The analytic curve, showing the anodic current as a function of L-Dopamine concentration for CuHSA is illustrated in Figure 14. The modified graphite paste electrode showed a linear response in the concentration range of 9.00×10⁻⁴ to 4.00×10⁻³ mol L-1, presented a corresponding equation Y (A) = 1.69×10⁻⁶
+ 0.022 [L-Dopamine] and a correlation coefficient r2 = 0.999. The detection limit obtained for this system was of 2.08×10⁻⁴
mol L-1 with a relative standard deviation of ± 2% (n = 3) and an amperometric sensitivity of 0.022 A/mol L-1.
-0,20 0,00 0,20 0,40 0,60 0,80 1,00
-100,00 -50,00 0,00 50,00 100,00 150,00
4.00 x 10⁻³ mol L-1
9.00 x 10⁻⁴ mol L-1
I/
A
[image:15.596.136.443.433.681.2]E/V vs Ag/AgCl
0.50 1.00 1.50 2.00 2.50 3.00 3.50 4.00 10.00
20.00 30.00 40.00 50.00 60.00 70.00 80.00 90.00
r2 = 0.999
I/
A
[L-Dopamine]/mmol L-1
Figure 14. Analytic curve of the anodic peak current as a function of L-Dopamine concentration using the graphite paste electrode modified with CuHSA (20% w/w, v = 20 mV s-1, KCl, 1.00 mol L
-1
, pH 7.00).
3.2. Electrocatalytic oxidation of L-Dopamine by differential pulse
For the system (CuHSA) was also tested the differential pulse voltammetry technique (DPV) . Figure 15 illustrates the behavior of the DPV of the CuHSA after the additions of different aliquots of L-Dopamine.
Through differential pulse voltammetry was possible to evidence two linear regions of the studied concentration range which are illustrated in Figure 16 (A) and (B). The analytical curves, showing the anodic current versus concentration of L-Dopamine for CuHSA system can be observed in Figure 17. The first region showed a linear response in the concentration range of 5.00×10⁻⁵
to 1.00×10⁻⁴
mol L-1 with a corresponding equation Y(A) = 6.51 + 1.386×10⁻⁵ [L-Dopamine] and a correlation coefficient r2 = 0.999. The detection limit was of 1.70×10⁻⁴ mol L-1 with a relative standard deviation of ± 4% (n = 3) and amperometric sensitivity of 1.385 A/mol L-1
. The second region showed a linear response in the concentration range of 1.00×10⁻⁴ to 8.00×10⁻⁴ mol L-1 with a corresponding equation Y(uA) = 6.22×10⁻⁵
+ 0.9906 [L-Dopamine] and a correlation coefficient r2 = 0.998. The detection limit was of 5.27×10⁻⁵
[image:16.596.114.465.108.396.2]
0.50 0.60 0.70 0.80 0.90 1.00 1.10
0.00 40.00 80.00 120.00 160.00 200.00
A 1.00 x 10⁻⁴
mol L-1
5.00 x 10⁻⁵ mol L-1
I/
A
E/V vs Ag/AgCl
0.6 0.8 1.0
0.00 40.00 80.00 120.00 160.00 200.00 240.00
280.00 B
8.00 x 10⁻⁴ mol L-1
1.00 x 10⁻⁴ mol L-1
I/
A
E/V vs Ag/AgCl
Figure 15. Differential pulse voltammograms obtained for the graphite paste electrode modified with CuHSA in the presence of different L-Dopamine concentrations (20% w/w, v = 10 mV s-1, KCl, 1.00 mol L-1, pH 7.00, pulse amplitude of 50 mV). (A) 5.00×10⁻⁵ to 1.00×10⁻⁴ mol L-1, (B)
1.00×10⁻⁴
to 8.00×10⁻⁴ mol L-1.
0.00 0.10 0.20 0.30 0.40 0.50 0.60 0.70 0.80 0.90
0.00 40.00 80.00 120.00 160.00
r2 (A) = 0.999
r2 (B) = 0.998
B
A
I/
A
[L-Dopamine]/mmol L-1
Figure 16. Analytic curve determined for CuHSA for determination of L-Dopamine in two concentration ranges: : (A) 5.00×10⁻⁵ to 1.00×10⁻⁴ mol L-1, (B) 1.00×10⁻⁴ to 8.00×10⁻⁴ mol L-1.
4. CONCLUSION
The voltammetric behavior of CuHSA presented a redox couple well defined with Eθ' = 0.71 V, assigned to CuIIFeII(CN)6/CuIIFeIII(CN)6 (20% w/w; v = 20 mV s-1; KCl; 1.00 mol L-1). The graphite
[image:17.596.84.505.89.246.2] [image:17.596.149.449.351.575.2]
modified graphite paste electrode showed a linear response in the concentration range of 9.00×10⁻⁴
to 4.00×10⁻³
mol L-1, presented a corresponding equation Y (A) = 1.69×10⁻⁶ + 0.022 [L-Dopamine] and a correlation coefficient r2 = 0.999. The detection limit obtained for this system using the cyclic voltammetry technique was of 2.08×10⁻⁴
mol L-1 with a relative standard deviation of ± 2% (n = 3) and an amperometric sensitivity of 0.022 A/mol L-1. Through differential pulse voltammetry was possible to evidence two linear regions of the studied concentration range. The analytical curves, showing the anodic current versus concentration of L-Dopamine for CuHSA system can be observed in Figure 17. The first region showed a linear response in the concentration range of 5.00×10⁻⁵ to 1.00×10⁻⁴ mol L-1 with a corresponding equation Y(A) = 6.51 + 1.386×10⁻⁵
[L-Dopamine] and a correlation coefficient r2 = 0.999. The detection limit was of 1.70×10⁻⁴
mol L-1 with a relative standard deviation of ± 4% (n = 3) and amperometric sensitivity of 1.385 A/mol L-1. The second region showed a linear response in the concentration range of 1.00×10⁻⁴
to 8.00×10⁻⁴ mol L-1 with a corresponding equation Y(uA) = 6.22×10⁻⁵
+ 0.9906 [L-Dopamine] and a correlation coefficient r2 = 0.998. The detection limit was of 5.27×10⁻⁵
mol L-1 with a relative standard deviation of ± 2% (n = 3). Thus, the composite CuHSA is a potential candidate for the construction of electrochemical sensors for the determination of L-Dopamine.
ACKNOWLEDGEMENTS
The authors are grateful for Fundação de Amparo à Pesquisa do Estado de São Paulo (FAPESP - Procs. 2012/11306-0; 2012/05438-1 and 2013/08495-9).
Reference
1. R. H. Baney, M. Itoh, A. Sakakibara, T. Suzukit, Chem. Rev., 95 (1995) 1409. 2. S. W. Kuo, F. C. Chang, Prog. Polym. Sci., 36 (2011) 1649.
3. D. Gnanasekaran, K. Madhavan, B. S. R. Reddy, J. Sci. Ind. Res., 68 (2009) 437. 4. D. B. Cordes, P. D. Lickiss, F. Rataboul, Chem. Rev., 110 (2010) 2081.
5. D. Xu, L. S. Loo, K. Wang, J. Appl. Polym. Sci., 122 (2011) 427.
6. C. Ni, G. Ni, L. Zhang, J. Mi, B. Yao, C. Zhu, J. Coll. Int. Sci., 362 (2011) 94. 7. T. A. Tereshchenko, Polym. Sci., 50 (2008) 249.
8. A. Provatas, M. Luft, J. C. Mu, A. H. White, J. G. Matisons, B. W. Skelton, J. Organomet. Chem., 565 (1998) 159.
9. E. A. Quadrelli, J. M. Basset, Coord. Chem. Rev., 254 (2010) 707.
10.X. Zhang, J. Sun, S. Fang, X. Han, Y. Li, C. Zhang, J. Appl. Polym. Sci., 122 (2011) 296. 11.M. Handke, A. Kowalewska, Spectrochim. Acta, Part A: Mol.Biomol. Spectros., 79 (2011) 749. 12.S. Gabriel Junior, Preparação, caracterização e aplicações eletroanalíticas de silsesquioxanos e
dendrímeros modificados suportados na superfície da sílica gel. Dissertação (Mestrado) –
Faculdade de Engenharia, Universidade Estadual Paulista “Júlio de Mesquita Filho”, Ilha Solteira (2010).
13.L. A. Soares, T. F. S. Da Silveira, D. R. Silvestrini, U. O. Bicalho, D. R. Do Carmo, Int. J. Chem., 5 (2013) 39.
14.D. R. Do Carmo, L. L. Paim, Mater. Res., 16 (2013) 164.
15.N. L. Dias Filho, R. M. Costa, M. S. Schultz, Inorg. Chim. Acta, 361 (2008) 2314. 16.G. Li, L. Wang, H. Ni, C. U. Pittman Junior, J. Organomet. Chem., 11 (2001) 123.
Organofuncionalizado. Dissertação (Mestrado) – Faculdade de Engenharia, Universidade Estadual Paulista “Júlio de Mesquita Filho”, Ilha Solteira (2011).
18.M. Joshi; B. S. Butola; J. Macromol. Sci. Part C Polym. Rev., 44 (2004) 389. 19.I. Nischang; O. Bruggemann, I. Teasdale, Angew. Chem. Int. Ed., 50 (2011) 4592.
20.A. Castaldo; G. Quercia-DiFrancia; A. Cassinese; P. D’Angelo, J. Appl. Phys., 103 (2008) 054511. 21.R. M. Laine, M. F. Roll, Macromolecules, 44 (2011) 1073.
22.H. C. L. Abbenhuis, Chem. Eur. J., 6 (2000) 25.
23.A. Fina, D. Tabuani, F. Carniato, A. Frache, E. Boccaleri, G. Camino, Thermochim. Acta, 440 (2006) 36.
24.T. F. S. Da Silveira, D. R. Silvestrini, U. O. Bicalho, D. R. Do Carmo, Int. J. Electrochem. Sci., 8 (2013) 872.
25.D. R. Do Carmo, L. L. Paim, D. R. Silvestrini, A. C. De Sá, U. O. Bicalho, N. R. Stradiotto, Int. J. Electrochem. Sci., 6 (2011) 1175.
26.M. Morán, C. M. Casado, I. Cuadrado, Organometallics, 12 (1993) 4327. 27.H. W. Ro, E. S. Park, C. L. Soles, D. Y. Yoon, Chem. Mater., 22 (2010) 1330.
28.H. B. He; B. Li; J. P. Dong; Y. Y. Lei; T. L. Wang; Q. W. Yu; Y. Q. Feng; Y. B. Sun, ACS Appl. Mater. Interfaces, 5 (2013) 8058.
29.M. Bhagiyalaksmi; R. Anuradha; S. Do Park; H. T. Jang, Micropor. Mesopor. Mater., 131 (2010) 265.
30.E. Devaux, M. Rochery, S. Bourbigot, Fire Mater., 26 (2002) 149.
31.D. A. Wann, R. J. Less, F. Rataboul, P. D. McCaffrey, A. M. Reilly, H. E. Robertson, P. D. Lickiss, D. W. H. Rankin, Organometallics, 27 (2008) 4183.
32.J. Chojnowski, W. Fortuniak, P. Rościszewski, W. Werel, J. Łukasiak, W. Kamysz, R. Hałasa, J. Inorg.Organomet. Polym. Mater., 16 (2006) 219.
33.M. Yao; J. Wang; X. Gu; L. Feng, Progress Chem., 24 (2012) 405.
34.D. M. L. Goodgame; S. Kealey; P. D. Lickiss; A. J. P. White, J. Mol. Struct., 890 (2008) 232. 35.E. Andrzejewska; A. Marcinkowska; D. Przadka; A. Klozinski; P. Jakubowska, Polimery, 58
(2013) 794.
36.K. Tanaka; Y. Chujo, Polym. J., 45 (2013) 247.
37.R. M. Laine; M. F. Roll, Macromolecules, 44 (2011) 1073.
38.E. A. Quadrelli; J. M. Basset, Coord. Chem. Rev., 254 (2010) 707.
39.Z. Kaigiang; L. Bo; Z. Yunhui; L. Hui; Y. Xiaoyan, Progress Chem., 26 (2014) 394. 40.D. R. Do Carmo, L. L. Paim, N. R. Stradiotto, Mater. Res. Bull. 47 (2012) 1028.
41.L. A. Soares, T. F. S. Da Silveira, D. R. Silvestrini, U. O. Bicalho, N. L. Dias Filho, D. R. Do Carmo,Int. J. Electrochem. Sci., 8 (2013) 4654.
42.V. V. S. Eswara Dutt; H. A. Mottola, Anal Chem., 46 (1974) 1777.
43.B. Marciniec; M. Dutkiewicz; H. Marciejewski; M. Kubicki, Organomettalics, 27 (2008) 793. 44.D. R. Do Carmo; L. L. Paim; N. L. Dias Filho; N. R. Stradiotto, App. Surf. Sci., 253 (2007) 3683. 45.J. Coates, Interpretation of Infrared Spectra, A Practical Appoach. In Encyclopedia of Analytical
Chemistry. John Wiley & Sons LTD, Inc.: Chichester, 2000.
46.K. Nakamoto, Infrared and raman spectra of inorganic and coordination compounds. New York: John Wiley, p. 484, 1986.
47.C. W. Ng; J. Ding; Y. Shi; L. M. Gan, J. Phys. Chem. Solids, 62 (2001) 767.
48.D. Engel; E. W. Grabner; Berichte der Bunsengesellschaft für physikalische Chemie, 89 (1985) 982.
49.M. A. Maliki, P. J. Kulesza, Electroanalysis, 6 (1996) 113. 50.S. S. Narayanan, F. Scholz, Electroanalysis, 11 (1999) 465.
51.A. J. Bard; L. R. Faulkner, Electrochemical methods: fundamentals and applications. John Wiley & Sons, Inc.: New York, 2001.
53.M. H. Pournaghi-Azar; H. Nahalparvari, J. Electroanal. Chem., 583 (2005) 307. 54.R. Ojani; J. B. Raoof; B. Norouzi; Electroanalysis, 20 (2008) 1996.
55.E. Laviron; J. Electroanal. Chem., 101 (1979) 19.
56.L. A. Soares; W. Yingzi; T. F. S. Silveira; D. R. Silvestrini; U. O. Bicalho; N. L. Dias Filho; D. R. Carmo, Int. J. Electrochem. Sci., 8 (2013) 7565.
57.S. M. Chen; K. T. Peng, J. Electroanal. Chem., 547 (2003) 179. 58.D. K. Maity; H. Mohan; J. P. Mittal, J. Chem. Soc., 4 (1994) 919. 59.M. J. LaVoie; T. G. Hastings, J. Neurosci., 19 (1999) 1484.