This is a repository copy of Evaluation of the Total Thrombus-Formation System (T-TAS): application to human and mouse blood analysis.
White Rose Research Online URL for this paper: http://eprints.whiterose.ac.uk/137917/
Version: Accepted Version
Article:
Ghaithi, R, Mori, J, Nagy, Z et al. (7 more authors) (2019) Evaluation of the Total
Thrombus-Formation System (T-TAS): application to human and mouse blood analysis. Platelets, 30 (7). pp. 893-900. ISSN 0953-7104
https://doi.org/10.1080/09537104.2018.1535704
[email protected] https://eprints.whiterose.ac.uk/
Reuse
Items deposited in White Rose Research Online are protected by copyright, with all rights reserved unless indicated otherwise. They may be downloaded and/or printed for private study, or other acts as permitted by national copyright laws. The publisher or other rights holders may allow further reproduction and re-use of the full text version. This is indicated by the licence information on the White Rose Research Online record for the item.
Takedown
If you consider content in White Rose Research Online to be in breach of UK law, please notify us by
1
Evaluation of the Total Thrombus-Formation System (T-TAS): application
to human and mouse blood analysis
Short title: Evaluation of T-TAS in assessing clot formation
Rashid Al Ghaithi1,2,3, Jun Mori2, Zoltan Nagy2, Annabel Maclachlan2, Lewis Hardy4, Helen Philippou4, Emma Hethershaw4, Neil V. Morgan2, Yotis A. Senis2, and Paul Harrison1
1Institute of Inflammation and Ageing, University of Birmingham, Birmingham, UK. 2Institute
of Cardiovascular Sciences, Institute for Biomedical Research, University of Birmingham, Edgbaston, Birmingham, B15 2TT, UK. 3Haematology and Blood Transfusion Department, The
Royal Hospital, Ministry of Health, Muscat, P.O. Box 1331, Post Code 111, Sultanate of Oman.4Leeds
Institute of Cardiovascular and Metabolic Medicine LIGHT Laboratories, University of Leeds, Clarendon Way, Leeds, West Yorkshire, LS2 9NL, UK
Institutions participating in study
University of Birmingham, Birmingham, UK University of Leeds, Leeds, UK
Correspondence
Dr. Rashid Al Ghaithi Senior Laboratory Specialist
Hematology and Blood Transfusion Department The Royal Hospital
P.O. Box 1331 Post Code 111
Muscat, Sultanate of Oman Phone: +96824599986 Fax: +96824590298
Email: [email protected]
Manuscript word count
2
Abstract
The Total Thrombus-formation Analyser System (T-TAS) is a whole blood flow chamber
system for the measurement of in vitro thrombus formation under variable shear stress
conditions. Our current study sought to evaluate the potential utility of the T-TAS for the
measurement of thrombus formation within human and mouse whole blood. T-TAS microchips
(collagen, PL chip; collagen/tissue thromboplastin, AR chip) were used to analyse platelet or
fibrin-rich thrombus formation respectively. Blood samples from humans (healthy and patients
with mild bleeding disorders) and wild-type (WT), mice were tested. Light transmission
lumi-aggregometer (lumi-LTA) was performed in PRP using several concentrations of ADP,
adrenaline, arachidonic acid, collagen, PAR-1 peptide and ristocetin. Thrombus growth (N=22)
increased with shear within PL (4:40±1.11, 3:25±0.43 and 3:12±0.48 mins [1000, 1500 and
2000s-1]) and AR chips (3:55±0.42 and 1:49±0.19 [240s-1 and 600s-1]). The area under the curve
(AUC) on the PL chip was also reduced at 1000s-1 compared to 1500/2000s-1 (260±51.7, 317±
55.4 and 301±66.2 respectively). In contrast, no differences in the AUC between 240s-1 and
600s-1 were observed in the AR chip (1593±122 and 1591±158). The intra-assay coefficient of
variation (CV) (n=10) in the PL chip (1000s-1) and AR chip (240s-1) were T
1014.1%, T6016.7%,
T10-6022.8% and AUC1024.4% or T10 9.03%, T808.64%, T10-8023.8% and AUC305.1%. AR chip
thrombus formation was inhibited by rivaroxaban (1µM), but not with ticagrelor (10µM). In
contrast, PL chip thrombus formation was totally inhibited by ticagrelor. T-TAS shows an
overall agreement with lumi-LTA in 87% of patients (n=30) with normal platelet counts
recruited into the genotyping and phenotyping of platelet (GAPP) study and suspected to have
a platelet function defect. The onset (T10) of thrombus formation in WT mice (N= 4) was
shorter when compared to humans e.g. PL chip (1000s-1) T
10 were 02:02±00:23 and 03:30±0:45
3 antithrombotic therapy, investigating patients with suspected platelet function defects and
monitoring platelet function within mice.
Keywords
Light transmission lumi-aggregometry, mild bleeding disorders, platelet aggregation, platelet
4
Introduction
Haemostasis is an important process that maintains the integrity of the circulatory system and
minimises blood loss upon vascular damage. When a blood vessel-wall is injured a number of
concomitant events occur. Initially, circulating platelets are recruited to the site of injury, where
they are activated to become a platelet plug. Simultaneously blood coagulation is triggered by
tissue factor resulting in thrombin generation and fibrin formation. The formation of fibrin,
together with the platelet plug become major components of the developing thrombus at the
sight of injury to prevent bleeding [1].
A number of instruments have now become available to investigate bleeding disorders by
accessing platelet function defects. However, the most common used techniques such LTA are
aggregation based and so do not access platelet in their physiological condition. The more
recent developed methods such as the impact cone and plate(let) analyser (CPA), PFA-200 and
the Total Thrombus-formation Analysis System (T-TAS) are flow based methods using whole
blood and therefore measure platelet function under more physiological conditions. Although
both systems measure thrombus formation under high shear, CPA monitors platelet adhesion
to a polystyrene plate and the PFA-200 measures thrombus formation within a small aperture
[2]. Therefore, both are sensitive to VWF levels [3]. In contrast, the T-TAS has the advantage
of evaluating thrombus formation in more physiological and variable flow conditions with
varying effects of VWF levels [4].
The T-TAS device is provided with two types of disposable ready-to-use microchips: (1) a
platelet (PL) chip coated with collagen for assessing platelet thrombus formation and (2) an
atherome (AR) chip coated with collagen and tissue factor for assessing white thrombus
5 a potential advantage of simultaneous assessment of both platelet and coagulation defects [5,
6].
The T-TAS was initially designed to monitor the effectiveness of antithrombotic agents. A
number of studies have reported its potential utility in assessment of anti-platelet drugs e.g.
aspirin, clopidogrel, PAR-1 and PAR-4 antagonists [6-8] and anti-thrombotic agents e.g. direct
thrombin and factor Xa inhibitors [9]. T-TAS has also demonstrated high sensitivity in
detecting coagulation disorders such as haemophilia [10] and von Willebrand disease [11], as
well as platelet function defects for example, storage pool disease (SPD) [12]. In assessing
acquired haemorrhagic conditions, the T-TAS was able to predict the risk of bleeding in atrial
fibrillation patients undergoing catheter ablation [13]. Furthermore, T-TAS has been
demonstrated to be a useful tool in the study of thrombus formation in blood taken from animal
models such as miniature pigs [14] and mice [10, 15].
Materials and Methods
Participants
A total of 59 individuals (37 patients and 22 controls) were evaluated and recruited into the
GAPP study (www.birmingham.ac.uk/plateletgapp) from 9 UK Haemophilia comprehensive
care centres. All patients or their parents gave written informed consent in accordance with the
GAPP project ethical approval (REC reference: 06/MRE07/36).
Reagents
ADP, ristocetin and adrenaline were purchased from Sigma (Poole, UK). Arachidonic acid and
U46619 were purchased from Cayman Chemical Company (Michigan, USA). The PAR-1
peptide (SFLLRN) was purchased from Severn Biotech (Kidderminster, UK). Collagen was
6 purchased from Chrono-log Corporation (Havertown, PA, USA). The reagents were dissolved
in phosphate-buffered saline (PBS) at pH 7.4 and stored as frozen aliquots, thawed and diluted
in PBS when required and kept on ice. Collagen was stored as a concentrated stock at 1 mg/ml
as supplied by the manufacturer at 4°C and diluted with the buffer provided. AR chip, PL chip,
CaCl2 containing 1.25 mg/mL of Corn Trypsin Inhibitor (CaCTI) and 3.2% sodium citrate were
provided by Quadratech Diagnostics Limited (Epsom, UK). 25 g/ml hirudin blood tubes were
purchased from Roche Diagnostics (Munich, Germany). Ticagrelor (10 mM) and Rivaroxaban
(10 mM) stock solutions were provided by Leeds Institute of Cardiovascular and metabolic
medicine, University of Leeds (Leeds, UK).
Blood sampling, platelet preparation and platelet count
Whole blood (40 ml) was obtained and anticoagulated with one tenth volume of 0.109 M/L
buffered trisodium citrate in vacutainer plastic tubes (Becton Dickinson, Plymouth, UK). An
additional (5 ml) blood was collected, 2 ml was anticoagulated with EDTA in vacutainer plastic
tubes (Becton Dickinson, Plymouth, UK) and 3 ml was anticoagulated with hirudin in
vacutainer plastic tubes (Roche Diagnostics, Munich, Germany), (final concentration, 25
g/ml). The same volume of blood was collected from a healthy control at the same time in
each Centre. Blood samples were immediately transported to the testing laboratory where they
remained capped and stored upright at room and assayed within 4 hours (by T-TAS) and within
6 hours (by lumi-LTA) from collection. Platelet rich plasma (PRP) was prepared by
centrifuging the citrated blood samples at 200 g for 20 min. Platelet-poor plasma (PPP) was
prepared by further centrifugation at 1,000 g for 10 min. Both samples were transferred into 15
ml Falcon tubes, capped and stored upright at room temperature. Whole blood platelet
parameters were analysed from EDTA blood samples from patients and controls using the
7 Beckman Coulter, High Wycombe, Bucks, UK) was used to count the platelets within the PRP
by diluting 5 µ l of PRP into 10 ml of fresh Isoton II diluent (Beckman Coulter, Bucks, UK).
Platelet aggregation in platelet-rich plasma
Tests were carried out as described previously [16]. Aggregation studies were performed by
using a dual Chrono-log lumiaggregometer (model ChronoLog 460 VS aggregometer,
LabMedics, UK) in 400 L mini cuvettes and stirred at 1200 rpm at 37°C. The 100% line was
set using autologous PPP and the 0% baseline established with native undiluted PRP. After
one min platelets were stimulated with ADP (10, 30, and 100 µM), adrenaline (10, 30, and 100
µM), arachidonic acid (0.5, 1, and 1.5 mM), U46619 (1 and 3 µM), collagen (1 and 3 µg/mL),
collagen related peptide CRP (1, 3, and 10 µg/mL), PAR-1 peptide (10, 30 and 100 µM), and
ristocetin (1.5 and 2 mg/mL). Platelet aggregation was monitored by measuring the change in
optical density over 5 min after addition of the agonists and the maximal percentage of
aggregation was recorded. ATP secretion from platelet dense granules was assessed
simultaneously by lumi-LTA using the luciferase reagent (Chronolume) as described
previously [16]
Evaluation of thrombus formation under flow conditions on human blood
In vitro thrombus formation was analysed on the T-TAS instrument (Zacros, Fujimori Kogyo
Co. Ltd., Tokyo, Japan) using two types of microchips, the PL chip (width 40 m × depth 40
m) (containing 25 capillary channels coated with type 1 collagen) and the AR chip (width 300
µ m, depth 60 or 120 µm, length 15 mm) (consisting of a single capillary channel coated with
collagen and thromboplastin). The PL chip was used to analyse platelet thrombus formation
(PTF) under three different shear rates (1000, 1500 and 2000s-1). Briefly, hirudin anticoagulated
8 by a pneumatic pump. After the perfusion of blood was initiated, platelets were then activated
by the collagen coated on the capillary. The AR chip was used to analyse white thrombus
formation (WTF) under two different shear rates (240s-1 and 600s-1). Briefly, citrated whole
blood (480 µl) was re-calcified by mixing with 20 µl of 0.3 M CaCTI immediately before it was
pipetted in the reservoir. The re-calcified blood was then perfused at 37°C through the AR chip
by the pneumatic pump. After the perfusion of blood through the capillary was initiated,
platelets and the extrinsic coagulation pathway were simultaneously activated by collagen and
tissue thromboplastin. To prevent the outlet port from clotting, the blood is mixed with 25 mM
EDTA (pH 10.5). The process of thrombus formation in both chips was monitored by flow
pressure changes in the capillary using the pressure sensor located between the pump and the
reservoir. As thrombus formation proceeded on the coated surface, the capillary is gradually
occluded, increasing the flow pressure. Based on the flow pressure pattern, the following four
parameters are used to analyse the results (i) T10 (time to reach 10 kPa) was defined as the
onset of thrombus formation and represents the duration (min) for the flow pressure to increase
to 10 kPa from baseline due to partial occlusion of microcapillaries. (ii) OT (occlusion time)
was defined as the complete occlusion of the capillary, which coincides with a pressure of 60
and 80 kPa for the PL and AR chips respectively. (iii) T10–60 for PL chip and T10–80 for AR
chip were defined as the interval between T10 and OT, representing the rate of thrombus
growth; (iv) AUC (area under curve) is an area under the flow pressure curve (under 60/80 kPa)
for 10/30 min after the start of assay for the PL and AR chips respectively. AUC is used to
quantify a decrease in WTF when OT is not achieved during the time period of assay.
9 Ticagrelor (final concentration, 10 µM) was incubated either in hirudin or citrate
anticoagulated blood for 10 min at room temperature. Rivaroxaban (final concentration, 1 µM)
was incubated in citrate anticoagulated blood for 3-5 min at room temperature. After incubation
blood were perfused through either the PL chip and/or AR chip within the T-TAS instrument
as described above.
Statistical analysis
All control results were run on Graph Pad Prism version 7.0 software to demonstrate the normal
distribution and to obtain the median and standard deviation values which were then used to
determine the cut-off values. Abnormal results by lumi-LTA were determined based on our
previously published methodology that is based upon both the magnitude and time course of
response [16, 17]. The time course, including reversibility is of particular importance. In
contrast, abnormal thrombus formation by T-TAS was determined based on the cut off values
of AUC10 and the T10 parameters calculated as the 5th percentile from healthy controls.
Results
Measurement of T-TAS in healthy subjects
22 healthy subjects (10 males and 12 females; median age 31 ± 7 years) were investigated.
Overall, the T-TAS shows some variation in thrombus formation among healthy subjects on
both (PL and AR) chips (Figure 1A and 1C). Within the PL chip (Figure 1B), the onset (T10)
value (median) and occlusion time (T60) at a shear rate of 1000 s-1 were greater than at
1500/2000 s-1(T10= 03:30, 03:02, 03:29 and T60= 08:10, 06:27, 06:42 respectively). In contrast,
the AUC10 value (median) was reduced at a shear rate of 1000 s-1 than at 1500/2000 s-1 (260,
317 and 301 respectively). Furthermore, the thrombus growth rates (T10-60) in the PL chip
(median) decreased as the shear rate increased (04:40, 03:25 and 03:12 respectively) (Figure
10 growth rates (T10-80) on the AR chip (T80=12:1 and 11:30; T10-80= 4:36 and 2:21 respectively)
(Figure 1D). However, no significant different of the AUC30 values (median) was observed
between low and high shear values (1593 and 1591 respectively). Surprisingly, the onset (T10)
value (median) on AR chip was greater at high shear (09:19) than at the low shear (08:16)
(figure 1D).
Intra-assay coefficients of variation (CV) were calculated from 10 sequential measurements of
a single sample obtained from one healthy subject (Table 1). Overall, the difference of CV
between shear rates within the PL chip was more significant compared to the AR chip. On PL
chip the CVs of T60, T10-60 and AUC10 were smaller at 2000 s− 1 than at 1000/1500 s− 1 whereas
the CVs of T10 were almost identical at all three shear rates. In AR chip however, the CV of all
four parameters were low at 600 s− 1 than that at 240 s− 1 (Table 1).
Measurement of blood from healthy subjects spiked with antithrombotic drugs
No thrombus formation was observed in the PL chip when blood was pre-treated with ticagrelor
(10 µM) (Figure 1E). In contrast, thrombus formation in the AR chip was not affected by
addition of ticagrelor (Figure 1F). However, thrombus formation in the PL chip was observed
with blood pre-treated with rivaroxaban (1µM) but varies between subjects when perfused
through the AR chip at lower shear rates (Figure 1G).
Measurement of T-TAS on samples from patients recruited into the GAPP study with
suspected platelet function defects.
We analysed 30 patients (8 male and 22 female) with a median age 35 (range 7-73) recruited
into the GAPP study and compared T-TAS (PL chip) results with lumi-LTA. All patients had
normal platelet counts (261± 68 x109/L).Of 30 patients tested (Figure 2C), 10 (33.3%) patients
11 criteria [17]. In contrast, 8 (27%) patients were detected to have abnormal thrombus formation
by T-TAS, as defined using the cut off values obtained from healthy controls.T-TAS detected
an abnormality in 1 patient that was normal by lumi-LTA, whereas 3 samples were normal by
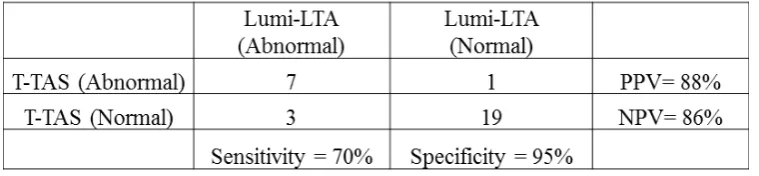
T-TAS but abnormal by lumi-LTA (Figure 2A and 2B, respectively). The overall agreement
between the two instruments is shown in table 2. 26/30 samples gave identical results by both
tests, with the majority (19) giving normal responses, whereas 7 samples gave abnormal results
by both tests. In contrast, there was disagreement in 4/30 samples. In this study we used AUC10
and the T10 parameters to identify a defect on T-TAS. 7/8 (88%) samples with an abnormality
detected by T-TAS have low values of AUC10. One patient however, had normal AUC10 value
(AUC10=177.8s) but a delayed T10 parameter (T10 = 5.44s).
Analysis and identification of patients with platelet function defects
Functional defects identified by lumi-LTA were classified into 4 main groups (Gi defects,
secretion defects, COX-like defect and multiple defects) according to their pattern of responses
to specific agonists as previously described [17]. As shown in figure 2D, T-TAS detected all
patients classified by lumi-LTA with COX-like defect or secretion defects (1 and 2 patients
respectively). In contrast, T-TAS only detected 1/3 patients with Gi defects but 3 out of 4 with
multiple defects.
Measurement of T-TAS in sample from GAPP patients with thrombocytopenia recruited
with suspected platelet function defects
We additionally analysed 7 patients (2 male and 5 female) found to have mild to marked
thrombocytopenia as characterized by low whole blood platelet counts (<150 x109/L), but
normal platelet counts in PRP when tested by lumi-LTA. The whole blood platelet counts
(mean± SD) were 77± 34 (x109/L). The waveform of each individual patient is presented in
12 controls (n=22) and patients (n=7). All 7 patients tested exhibited abnormal thrombus
formation within the T-TAS (Figure 2A). Interestingly, 4/7 patients were also detected by
lumi-LTA to have platelet function defects (3 secretion and 1 Cox-like defects) in additional to their
thrombocytopenia.
Measurement of T-TAS in samples from WT mice
Blood samples from WT (n=5) were tested using PL chips (1000 s-1 and 2000 s-1) and AR chips
(240 s-1). Within the PL chip, shear enhanced thrombus formation was observed with all
parameters; however, any differences in measurements between shear rates was only
significant with the AUC10 parameter. For example, the values (median) at 1000 s-1 (T10 =
02:02, T60 = 04:40 and T10-60 =02:38) were greater than at 2000 s-1 (T10 = 01:16, T60 = 03:26
and T10-60 = 02:09). Consequently, the AUC10 at 1000 s-1 was shorter than at 2000 s-1 (405.5
and 463.6 respectively) (Table 3). The values (median) of thrombus formation within the AR
chip (240s-1) are shown in table 3. For example, the median values of T
10, T80, T10-80 and AUC30
were 02:52, 06:41, 03:48 and 2048.98 respectively.
The difference in thrombus formation between WT mice (n=5) and healthy humans (n=22) was
then compared. Overall, thrombus formation in WT mice was more rapid on both the PL and
AR chips (Figure 3A) than in humans. With PL chip measurements, the differences between
two models were significant with all parameters. For example, WT mice values (median) at
1000 s-1 were T10 = 02:02, T60 = 04:40, T10-60 = 02:38 and AUC10 = 405.5 (table 3) whereas the
values in humans (median) at the same shear were T10= 03:30, T60= 08:10, T10-60 = 04:40 and
AUC10 = 260 (results not shown). In contrast, with AR chip measurements the different
between two models were only significant with T10, T80 and AUC30 but not with T10-80 (Figure
3C).
13 The T-TAS is a flow chamber system that evaluates thrombus formation using whole blood
samples that flow on different thrombogenic surfaces under arterial or venous shear conditions.
This approach offers an advantage for rapidly assessing thrombus formation in more
physiological conditions using whole blood under flow. Furthermore, this method requires
comparatively small blood volumes (350 l) making it potentially practical for clinical
application [4]. Importantly, T-TAS has all the five requirements of flow assays methods as
described by Roest et al. [18]. We therefore sought to evaluate the potential utility of the
T-TAS for assessing thrombus formation in blood from healthy individuals, blood spiked with
antithrombotic agents, blood from GAPP study patients with mild bleeding disorders and blood
from mice.
In healthy controls, both the start and end points of thrombus formation varied among
individuals within both chips suggesting that measurements obtained using the T-TAS may
reflect individual variability of thrombus formation. Within the PL chip, the rate of thrombus
formation was shorter at higher shear rates which was reflected in all parameters measured
(Figure 1B). This supports the evidence that high-shear rates favour the GPIb-IX-V/VWF axis
to induce more efficient thrombus formation [19]. In contrast, the effect of the shear rate within
the AR chip was variable, in particular the onset (T10) (Figure 1D) where the value at the high
shear was greater than at the low shear in contrast to previous findings [4, 6]. However, an
increased rate of thrombus growth (T10-80) in accordance with an increase in shear rate was
observed on AR chip similar to that on PL chip, indicating that the shear rates accelerated the
growth rate of the thrombus. Shear rate enhancement of T-TAS parameters were also reported
by Hosokawa et al., and Yamaguchi et al., [4, 6]. In our study, the T-TAS also exhibited high
intra-assay coefficients of variation (CV) within both chips (Table 1). Typical CVs obtained
were much higher than those described by Yamaguchi et al. although their sample size (n=5)
14 We also evaluated the utility of T-TAS in detecting the effect of antithrombotic therapy on
haemostasis using two types of drugs. 1) The antiplatelet drug Ticagrelor (P2Y12 antagonist)
and 2) The anticoagulant Rivaroxaban (factor Xa inhibitor). Ticagrelor (10 µM) completely
suppressed thrombus formation within the PL chip.These findings agree with Hokosawa et al.
who also previously demonstrated that thrombus formation within the PL chip was inhibited
by P2Y12 antagonists [5, 8]. In contrast, the inhibitory effect of Ticagrelor on thrombus
formation was not observed within the AR chip. As thrombus formation within the AR at low
shear rate is more dependent upon fibrin formation [6, 20], it is possible that P2Y12 inhibitors
are therefore expected to have no effect in this chip as platelets play little or no role in thrombus
formation at low shear rates [7, 21]. Secondly, platelets within the AR chip could also be
activated via the PAR-1 receptor by thrombin which is generated from activation of the
coagulation pathways [21]. This was demonstrated by Hokosawa et al. by demonstrating that
PAR-1 antagonism reduced thrombus formation within the AR chip [7]. In contrast,
Rivaroxaban (1µM) incubation with whole blood within the AR chip displayed considerable
variability on affecting thrombus formation with a delayed onset despite complete thrombus
formation (figure 1G). Hokosawa et al. also demonstrated that Rivaroxaban (1µM) only
moderately suppressed thrombus formation within the AR chip [9]. However, Sugihara et al.
demonstrated that Rivaroxaban at the estimated clinical peak dose (800 nM) significantly
suppressed thrombus formation [22]. Furthermore, Hosokawa et al., also used T-TAS to show that
the anticoagulant effect of thrombus formation was intensified when anticoagulant and antiplatelet
drugs were used in combination [9]. These findings suggest that T-TAS could be a clinically useful
tool for monitoring the antithrombotic effect on both platelet and coagulation pathways.
Furthermore, we performed a comparative evaluation of the T-TAS using the PL chip with
15 standard of lumi-LTA. Comparison of the overall results in 30 patients with normal platelet
counts (Table 2) demonstrated a good agreement between T-TAS (PL chip) and lumi-LTA
with concordance in 87% of samples tested. As 67% of samples were defined as normal by
lumi-LTA, T-TAS therefore gave a NPV of 86% suggesting that the test could be a potential
screening tool for the characterisation of platelet function disorders. Interestingly, T-TAS also
detected all patients with COX-like defects and secretion defects (Figure 2D). This finding is
consistent with earlier reports showing that T-TAS was able to detect all patients diagnosed
with SPD [12]. T-TAS also showed high consistency in detecting abnormalities in patients with
multiple defects. This finding supports the earlier report suggesting that T-TAS is reliable in
detecting more severe forms of platelet defects such Bernard-Soulier syndrome [12]. However,
T-TAS failed to detect thrombus formation in all patients with thrombocytopenia including
three patients that gave normal responses by lumi-LTA (Figure 2A and 2B). This might suggest
that T-TAS is not reliable for testing samples with low platelet counts and that thrombus
formation is dependent on normal platelet numbers. An earlier study on healthy subjects
demonstrated a good correlation between normal platelet counts and T-TAS parameters [4].
Further studies are required to investigate the relationship between platelet counts and T-TAS
parameters.
There is no single parameter that has been described to be more useful in defining haemostatic
abnormalities within the T-TAS. Almost all studies evaluating bleeding disorders in the T-TAS
have used AUC10/30 and to a lesser extent the T10 [11-13, 23]. AUC is particularly useful in
quantifying a decrease in thrombus formation when occlusion time is not achieved during the
time period of assay. In our study almost all samples (7/8) with abnormalities detected by
T-TAS exhibited low values of AUC10. One patient however, gave normal values of AUC10 but
lumi-16 LTA. This might therefore suggest that a combination of T10 and AUC parameters are sufficient
to identify any haemostatic abnormalities on T-TAS.
The use of comparatively small blood volumes for T-TAS makes it practical for studying
ex-vivo thrombus formation in small animal models. This could potentially result in significant
reduction of animal usage in research laboratories. To evaluate the utility of T-TAS for testing
thrombus formation in mouse blood, we first analysed blood samples from WT mice. WT blood
demonstrated more rapid total thrombus formation compared to human blood. Similar results
were reported on studies of blood from miniature pigs [14], suggesting that these animals might
exhibit increased thrombogenicity than humans, possibly due to higher platelet counts (Table
4). As expected, all KO models displayed poor thrombus formation within the PL chip
concurring with previous in vivo and in vitro findings [24]. In contrast, full thrombus formation
was observed within the AR chip with all KO indicating that the coagulation pathways are
normal and that platelets probably have little significant contribution to thrombus formation
using this system, at a shear rate of 240 s−1 [23].
Our present study has several limitations. Firstly, the study was performed with only a small
group of patients suspected to have platelet function disorders. Therefore, for future studies it
would be necessary to enrol a larger number of patients with known platelet function defects
as well as other haemostatic abnormalities such as coagulation defects (e.g haemophilia and
VWD). Secondly, the study of antithrombotic drugs was performed using a single
concentration of either ticagrelor or rivaroxaban and were evaluated separately. It would be of
interest in future studies to evaluate the T-TAS with a full range of antiplatelet drugs with
different molecular targets and at different concentrations as well as in the combination with
anticoagulant drugs. Lastly, the mouse models were only studied within the AR chip and at
low shear rates. It would be of interest to determine if higher shear rates would also have
17 In summary, T-TAS has demonstrated a good agreement with Lumi-LTA suggesting that the
technique could be applied to potentially screening patients with platelet function defects.
Moreover, the device might be a useful tool in monitoring antithrombotic therapy. Finally, we
demonstrated that the T-TAS could provide valuable assistance in rapidly studying samples
18
Acknowledgements
The authors thank all Haemophilia Care Centres that referred patients’ to the GAPP project.
The T-TAS instrument and reagents were provided by Quadratech Diagnostics Ltd. UK, and
supported by the government of Sultanate of Oman, the British Heart Foundation (RG/09/007;
PG/06/038; PG/11/31/28835), and Leeds Institute of Cardiovascular and Metabolic Medicine.
Authorship
Contribution: R.A. Performed research, analysed data, and wrote the paper; J.M performed
research and analysed data; Z.N. analysed data; L.H. analysed data; A.M. Performed research;
H.P. analysed data; E.H. contributed to designed the research; N.V.M. designed the research
and contributed to writing the paper; Y.A.S. designed the research and analysed data; and P.H.
designed the research, analysed data and contributed to writing the paper.
Disclosure of conflict of interest
19
References
1. Gale AJ. Continuing education course #2: current understanding of hemostasis. Toxicologic pathology. 2011;39(1):273-80.
2. Harrison P, Mackie I, Mumford A, Briggs C, Liesner R, Winter M, Machin S, British Committee for Standards in H. Guidelines for the laboratory investigation of heritable disorders of platelet function. British journal of haematology. 2011;155(1):30-44.
3. Bolton-Maggs PH, Chalmers EA, Collins PW, Harrison P, Kitchen S, Liesner RJ, Minford A, Mumford AD, Parapia LA, Perry DJ, et al. A review of inherited platelet disorders with guidelines for their management on behalf of the UKHCDO. British journal of haematology. 2006;135(5):603-33. 4. Yamaguchi Y, Moriki T, Igari A, Matsubara Y, Ohnishi T, Hosokawa K, Murata M. Studies of a microchip flow-chamber system to characterize whole blood thrombogenicity in healthy individuals. Thrombosis research. 2013;132(2):263-70.
5. Hosokawa K, Ohnishi T, Fukasawa M, Kondo T, Sameshima H, Koide T, Tanaka KA, Maruyama I. A microchip flow-chamber system for quantitative assessment of the platelet thrombus formation process. Microvascular research. 2012;83(2):154-61.
6. Hosokawa K, Ohnishi T, Kondo T, Fukasawa M, Koide T, Maruyama I, Tanaka KA. A novel automated microchip flow-chamber system to quantitatively evaluate thrombus formation and antithrombotic agents under blood flow conditions. Journal of thrombosis and haemostasis : JTH. 2011;9(10):2029-37.
7. Hosokawa K, Ohnishi T, Miura N, Sameshima H, Koide T, Tanaka KA, Maruyama I. Antithrombotic effects of PAR1 and PAR4 antagonists evaluated under flow and static conditions. Thrombosis research. 2014;133(1):66-72.
8. Hosokawa K, Ohnishi T, Sameshima H, Miura N, Ito T, Koide T, Maruyama I. Analysing responses to aspirin and clopidogrel by measuring platelet thrombus formation under arterial flow conditions. Thrombosis and haemostasis. 2013;109(1):102-11.
9. Hosokawa K, Ohnishi T, Sameshima H, Miura N, Koide T, Maruyama I, Tanaka KA. Comparative evaluation of direct thrombin and factor Xa inhibitors with antiplatelet agents under flow and static conditions: an in vitro flow chamber model. PloS one. 2014;9(1):e86491.
10. Ogawa S, Szlam F, Dunn AL, Bolliger D, Ohnishi T, Hosokawa K, Tanaka KA. Evaluation of a novel flow chamber system to assess clot formation in factor VIII-deficient mouse and anti-factor IXa-treated human blood. Haemophilia : the official journal of the World Federation of Hemophilia. 2012;18(6):926-32.
11. Ogiwara K, Nogami K, Hosokawa K, Ohnishi T, Matsumoto T, Shima M. Comprehensive evaluation of haemostatic function in von Willebrand disease patients using a microchip-based flow chamber system. Haemophilia : the official journal of the World Federation of Hemophilia. 2015;21(1):71-80.
12. Minami H, Nogami K, Ogiwara K, Furukawa S, Hosokawa K, Shima M. Use of a microchip flow-chamber system as a screening test for platelet storage pool disease. International journal of hematology. 2015;102(2):157-62.
13. Ito M, Kaikita K, Sueta D, Ishii M, Oimatsu Y, Arima Y, Iwashita S, Takahashi A, Hoshiyama T, Kanazawa H, et al. Total Thrombus-Formation Analysis System (T-TAS) Can Predict Periprocedural Bleeding Events in Patients Undergoing Catheter Ablation for Atrial Fibrillation. Journal of the American Heart Association. 2016;5(1).
14. Miura N, Kawaguchi H, Nagasato T, Yamada T, Ito T, Izumi H, Shameshima H, Miyoshi N, Tanimoto A, Maruyama I. Coagulation activity and white thrombus formation in the microminipig. In vivo (Athens, Greece). 2013;27(3):357-61.
15. Ono Y, Wang Y, Suzuki H, Okamoto S, Ikeda Y, Murata M, Poncz M, Matsubara Y. Induction of functional platelets from mouse and human fibroblasts by p45NF-E2/Maf. Blood. 2012;120(18):3812-21.
20
17. Dawood BB, Lowe GC, Lordkipanidze M, Bem D, Daly ME, Makris M, Mumford A, Wilde JT, Watson SP. Evaluation of participants with suspected heritable platelet function disorders including recommendation and validation of a streamlined agonist panel. Blood. 2012;120(25):5041-9.
18. Roest M, Reininger A, Zwaginga JJ, King MR, Heemskerk JW. Flow chamber-based assays to measure thrombus formation in vitro: requirements for standardization. Journal of thrombosis and haemostasis : JTH. 2011;9(11):2322-4.
19. Ikeda Y, Handa M, Kawano K, Kamata T, Murata M, Araki Y, Anbo H, Kawai Y, Watanabe K, Itagaki I, et al. The role of von Willebrand factor and fibrinogen in platelet aggregation under varying shear stress. The Journal of clinical investigation. 1991;87(4):1234-40.
20. Hanson SR, Sakariassen KS. Blood flow and antithrombotic drug effects. American heart journal. 1998;135(5 Pt 2 Su):S132-45.
21. Leonardi S, Becker RC. PAR-1 inhibitors: a novel class of antiplatelet agents for the treatment of patients with atherothrombosis. Handbook of experimental pharmacology. 2012(210):239-60. 22. Sugihara H, Idemoto Y, Kuwano T, Nagata Y, Morii J, Sugihara M, Ogawa M, Miura SI, K. S. Evaluation of the Antithrombotic Effects of Rivaroxaban and Apixaban Using the Total Thrombus-Formation Analysis System®: In Vitro and Ex Vivo Studies. J Clin Med Res. 2016;8(12).
21
[image:22.595.75.526.136.200.2]Tables
Table 1 Intra-assay coefficients of variation (CV) in PL and AR chips measurements in a single
sample obtained from a healthy control (n=10).
Table 2 Analysis of the agreement between the T-TAS and lumi-LTA in patient samples
[image:22.595.72.452.272.360.2](n=30) displaying sensitivity, specificity, positive predictive value (PPV) and negative predictive value (NPV).
Table 3 T-TAS measurements in samples from WT mice (n=5) performed on both PL and AR
[image:22.595.76.513.414.507.2]chips using different shear rates. Data presented as mean and SD.
[image:22.595.73.522.564.647.2]22
Figure legends
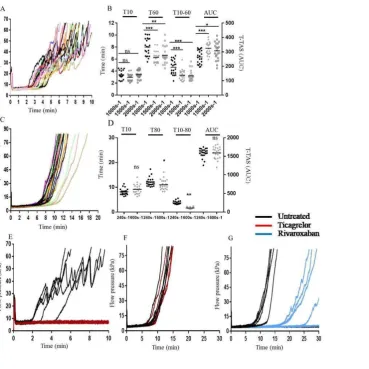
Figure 1. Measurements of blood from healthy controls (n=22) using the PL chip and AR chip.
For panel A and C, flow pressure curves of all individuals measured at low shear rates on PL chip (1000 s− 1) and AR chip (240 s− 1), respectively. For panel B and D, distribution of the T-TAS measurements from different shear rates using PL chip and AR chip, respectively. For panel E and F, effects of the ticagrelor (10µM) on blood from healthy controls (n=4) measured on PL chip and AR chip, respectively. For panel G, effects of the rivaroxaban (1µM) on blood from healthy controls (n=5) measured on AR chip (bars represent median values). Statistical analysis performed by the Mann Whitney U test and the one-way ANOVA test with Sidak’s adjustment for multiple comparisons (***p <0.001, **p<0.01 and *p<0.05).
Figure 2. Measurements of thrombus formation in the PL-chip (1000 s−1) with whole blood
samples from healthy controls (n=22), patients (n=20) no detectable platelet defects by Lumi-LTA, patients (n=10) with platelet defects as defined by lumi-LTA and patients (n=7) with thrombocytopenia. Panel A, flow pressure curves display control (black), normal T-TAS (green), abnormal T-TAS (red) and patients with thrombocytopenia (blue). Panel B, distribution of the T-TAS measurements display control (black circles), normal T-TAS (green circles), abnormal T-TAS (red circles) and patients with thrombocytopenia (blue circles). Panel C, summary of overall patients results (n=30) analysed on lumi-LTA and T-TAScomparing between normal (blue) and abnormal (red). Panel D, classification of platelet function defects
among patients detected by lumi-LTA (blue) and T-TAS (red). The results were considered to be abnormal (by lumi-LTA) as previously established in the GAPP program using samples from healthy subjects (Dawood et al 2012) and (by T-TAS) when they fall below the cut-off values (5th percentile) calculated from healthy individuals.Statistical analysis performed by the Mann Whitney U test (bars represent the median values). Significance as compared to control in each parameter (***p<0.001 and *p<0.05).
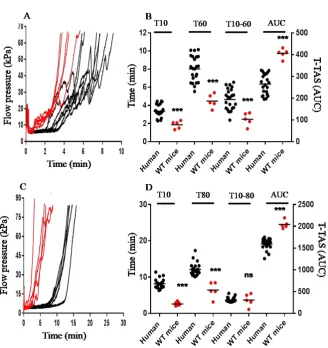
Figure 3. Measurements of thrombus formation within the PL-chip (1000 s−1) and AR-chip (240 s−1) with blood from human (black) and WT mice (red). Panel A, flow pressure curves observed within PL-chip (1000 s−1). Panel B, distribution of the T-TAS measurements
obtained from PL-chip (1000 s−1). Panel C, flow pressure curves observed within AR-chip
(240 s−1). Panel D, distribution of the T-TAS measurements obtained from AR-chip (240 s−1). Statistical analysis performed by the Mann Whitney U test (bars represent median values). Significance as compared between human and WT blood in each parameter (***p<0.001).
23
25