Int. J. Electrochem. Sci., 8 (2013) 3057 - 3073
International Journal of
ELECTROCHEMICAL
SCIENCE
www.electrochemsci.org
The Formation of Passive Films of Carbon Steel in Borate
Buffer and Their Degradation Behavior in NaCl Solution by
SECM
Yan Xia1, Fahe Cao1,*, Wenjuan Liu1, Linrong Chang1, Jianqing Zhang1,2
1
Department of Chemistry, Zhejiang University, Hangzhou 310027, PR China
2
State Key Laboratory for Corrosion and Protection, Institute of Metal Research, The Chinese Academy of Sciences, Shenyang 110016, PR China
*E-mail: [email protected]
Received: 13 December 2012 / Accepted: 9 January 2013 / Published: 1 February 2013
Passive films formed on carbon steel by different passivation potentials in borate buffer solution and their degradation behavior were studied by different electrochemical techniques, such as electrochemical impedance spectroscopy (EIS), Mott-Schottky (M-S) analysis and scanning electrochemical microscopy (SECM). The film’s composition was investigated by X-Ray Photoelectron Spectroscopy (XPS). The results of SECM show that the electrochemical reactivity on the surface of passive film is weakened as the film formation potential increases due to slower charge transfer rate. The heterogeneous electron transfer rate constant k calculated from approach curves decreases linearly with substrate potential increasing, resulting from different electrochemical reactivity on the surface of substrate. The electrochemical reaction resistance of the film increases with film formation potential increasing, while the point defect density decreases, indicating the film becomes less conductive. The ratio Fe3+/Fe2+ and the percentage of oxyhydroxide species increase simultaneously as the film formation potential shifts from -0.1 V to 0.7 V. The SECM and EIS results show that the film formed at 0.3 V has the strongest corrosion resistance in 0.1 M NaCl solution followed by that of 0.7 V which is more defective and porous. The degradation of passive film in NaCl solution is different from the evolution of films in non-aggressive electrolyte.
Keywords: SECM; Carbon steel; Passive film; EIS; Degradation; XPS
1. INTRODUCTION
studies [2, 6] related to the passivation of steels in a highly alkaline environment such as reinforcement rebar in reinforced concrete, there also have been some investigations [5, 7] of steel and iron conducted in mildly alkaline solutions such as borate buffer. Some researches have been concentrated on determining the film’s composition and structure [8-12], such as the work of Devine [12]. The passive film formed on iron in borate buffer solutions at pH 8.4 is a bilayer film consisting of an inner layer of Fe3O4, or γ-Fe2O3, or a mixture of the two, and an outer layer of an as yet unidentified
Fe(Ⅲ)oxide/hydroxide [12][12]. Moreover, some investigators have probed the mechanism of formation and evolution of passive films with the change of experiment condition such as the film formation potential [4, 7]. Wren [7] investigated the effect of film formation potential on the formation of passive film on carbon steel and proposed oxide film formation/conversion mechanisms for different potential regions. Meanwhile, some studies on the relationship between the electronic nature of passive film and its electrochemical and corrosion behavior have been reported [13-16]. Among them, the point defect model (PDM), which was proposed by Macdonald [17, 18] to define the growth and breakdown of passive film quantitatively from the microscopic point of view, was widely used to explore the semiconducting properties of oxide film along with the relevance of them and corrosion behavior [13-15]. For instance, Ahn [14] have elucidated the mechanism of passivity breakdown on the metals by PDM through the investigation of the effects of chloride on the electronic properties of passive films. Besides, Zhang [16] have combined electrochemical impedance spectroscopy (EIS), another useful method for electrochemical properties study, and XPS to study the relationship of kinetic rate constant at the film interfaces and the corrosion mechanism of carbon steel.
The effects of halides on the passivity of films and pitting corrosion have been studied from different aspects [19-21]. Macdonald [19] found that the breakdown of passivity resulted from the condensates of cation vacancy which generated from the reaction of Cl- and oxygen vacancy. Marcus [22] have studied the impact of Cl- on the passivity breakdown and pitting initiation. Firstly, Cl -competes with OH- for adsorption on the oxide surface, including the defect sites of the inter-granular boundaries exposed to the electrolyte, leading to a fast local thinning of the barrier layer; Secondly, Cl -penetrates in the barrier layer via the inter-granular boundaries and migrates to the Me/Ox interface to react with inter-granular cations, resulting in the formation of Cl--containing particles and stress-induced fracture of the passive film. At the same time, Cl
will also hinder repassivation by dissolution or rupture of the film.
However, there have been few studies involving the kinetics of electron transfer and its relationship with corrosion properties on passive film of carbon steel.
Mott-Schottky (M-S) tests has have been wildly used and considered to be a powerful tools to characterize the semiconducting properties of passive film. Under depletion conditions, the donor density can be determined by measuring the capacitance as a function of potential, and the M-S approximation obtained to define the dependence of capacitance on potential by measuring differential capacitance of the cell with combining the Poisson and Boltzman equations has the following expression
FB
2 2 2 2
H SC H 0 D
1 1 1 1 2
εε
kT
E E
C C C C qN q
(1)
where ε is the dielectric constant of the film, ε0 the vacuum permittivity (8.85 × 10⁻¹⁴ F·cm-1), q
the electric charge (1.602 × 10⁻¹⁹
C), k the Boltzman constant (1.38 × 10⁻²³ J·K-1), ND the donor
density, and EFB is the flatband potential. When the frequency for capacitance measurements was high
enough that the Helmholtz capacitance (CH) is much larger than the space-charge capacitance (CSC),
the contribution of CH to C is negligible and C is approximately equal to CSC. When kT/q is negligible,
the donor density and the flatband potential can be determined from the slope (2/εε0qND) and the
intercept of the linear portion with the potential axis on the M-S curves. M-S method was used to determine the semiconductive properties and donor density of passive films in many works [3, 13]. Cheng and Luo [3] studied the semiconductive properties, electronic structure and pitting susceptibility of passive films by M-S analysis and other techniques. They proposed that the nonlinearity of M-S plots results from the two donor levels in the space charge transfer, besides, the divalent iron cation vacancies generated by the ionization of the deep donor level are mainly responsible for pitting corrosion.
Over the last several decades, the research on corrosion behavior of carbon steel and its passive film is mainly based on macro-electrochemical measurements, such as EIS, polarization, etc. The present work was undertaken in view of the limited knowledge on the passive film of carbon steel in micro-electrochemical technology, especially SECM. The effect of the passive potential on the passive film of carbon steel in borate buffer solutions and its degradation behavior was investigated using XPS, EIS, M-S test and SECM. The electrochemical reactivity at the surface of film with corrosion behavior and electronic properties of the oxide film was also correlated.
2. EXPERIMENTAL
mirror. After that, the sample was degreased with acetone and rinsed with distilled water, and then dried with cold wind.
The anodic passivity tests were conducted in 0.075 M Na2B4O7 + 0.05 M B(OH)3 (pH 9.2),
prepared with analytical reagents, distilled water and deaerated with high purity nitrogen. A conventional three-electrode device was used, with a saturated calomel electrode (SCE) and a Pt slice for reference and counter electrode respectively. All potentials of macroscopic electrochemical tests are reported vs. SCE. The experiments were carried out at room temperature, using a Gamry Series G300 Potentiostat. The samples were anodically polarized at different potentials (-0.1, 0.3 and 0.7 V
[5]
) in passive domain for 5 h to form steady passive films. When the corrosion potential reached steady state about 1 h after polarization ends, EIS and M-S tests were performed. EIS tests were carried out in the frequency range of 100 kHz to 10 mHz at OCP(about -0.23 V for -0.1 V, -0.17 ~ -0.15 V for 0.3 V, and -0.05 V for 0.7 V ), applying a ±5 mV sinusoidal potential. ZView2 software was used to fit the impedance spectra. The M-S tests were performed at 1000 Hz in the potential range from 0.7 to -0.6 V and the applied sinusoidal potential was also ±5 mV. The capacitance was calculated from the equation C = (-2πfZim)-1, where f is the frequency and Zim is the imaginary part of the impedance. For the
degradation test, electrodes covered by passive films was were immersed in 0.1 M NaCl for 1 h, then EIS test was conducted using the same parameters with the former test at OCP (about -0.56 ~ -0.51 V). For SECM tests, a CHI920C scanning electrochemical microscope consisting of a three-axis positioning system driven by a motor and a bipotentiostat was used, so that the position of the probe electrode was controlled and the potentials of probe and specimen electrodes were independently controlled. The measurements were conducted with a three or four electrode configuration, using a Pt probe 10 μm in diameter as the first working electrode, carbon steel electrode as the second working electrode if necessary, a Ag/AgCl, KCl (sat.) reference electrode and a platinum wire as a counter electrode. All potentials were referred to Ag/AgCl, KCl (sat.). The SECM tests were conducted in the feedback mode with ferrocene-methanol (FcMeOH) as the redox mediator and the tip potential was set at 0.5 V/Ag/AgCl to monitor the oxidation of Fe2+. There were two electrolytes for different purposes in the experiments, 0.5 mM FcMeOH in 0.05 M Na2B4O7 supporting electrolyte (pH9.4) for
determination of the tip-substrate distance and reactivity on the surface of the substrate, and another electrolyte 0.1 M NaCl for degradation of passive films. All of the electrolytes were exposed to air. In the degradation experiment, the relative position of the tip was firstly determined by approach curves in the 0.5 mM FcMeOH + 0.05 M Na2B4O7 solution, then the electrolyte was extracted and the cell
was washed twice by ultrapure water. After that, 0.1 M NaCl was injected into the cell and remained for 1 h. Finally the NaCl solution was replaced by 0.5 mM FcMeOH + 0.05 M Na2B4O7 solution for
SECM mapping. The exact tip-substrate distance was determined by fitting the experimental approach curves to the theoretical model for negative-feedback behavior. All solutions were prepared from spectrographic grade chemicals and Millipore-Q water.
3. RESULTS AND DISCUSSION
3.1 Characterization of passive films
3.1.1 Surface analysis: XPS
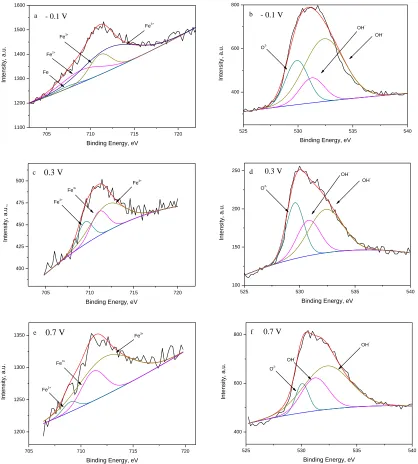
[image:5.596.59.477.207.671.2]XPS was used to characterize the chemical composition of the passive films formed at different potentials. The spectra of passive films formed at different potentials was fitted and shown in Fig. 1.
Figure 1. XPS spectra for the Fe-2p (a), (c), (e) and O-1s (b), (d), (f) peaks obtained on carbon steel electrodes passivated under different potentials for 5 h.
All the spectra were deconvoluted predominantly to the peak of Fe3+ which is correlated to oxides and hydroxides, and the binding energy of the peak moves to higher value with the film
705 710 715 720
400 425 450 475 500 In te n si ty, a .u .,
Binding Energy, eV Fe2+
Fe3+
Fe3+
c 0.3 V
525 530 535 540
100 150 200 250 In te n si ty, a .u .
Binding Energy, eV OH
-OH
-O
2-d 0.3 V
525 530 535 540
400 600 800 In te n si ty, a .u .
Binding Energy, eV O
2-OH
-OH
-f 0.7 V
705 710 715 720
1200 1250 1300 1350 In te n si ty, a .u .
Binding Energy, eV Fe2+
Fe3+
Fe3+
e 0.7 V
705 710 715 720
1100 1200 1300 1400 1500 1600 In te n si ty, a .u .
Binding Energy, eV Fe
Fe2+
Fe3+
Fe3+
a - 0.1 V
525 530 535 540
400 600 800 In te n si ty, a .u .
Binding Energy, eV
O
2-OH
-OH
formation potential increasing, which indicates that the proportion of Fe3+ increases since the binding energy of Fe3+ (711.0-711.4 eV) is higher than that of Fe2+ (~709.0eV). Via calculating the peak area of these species from fitting results, the ratio Fe3+/Fe2+ increases with the increasing of film formation potential (Epassive) shown in Table 1. Since Fe2+ mainly exists in Fe3O4, Fe3O4 diminishes either by
decomposing or by transforming to the oxides or hydroxides of Fe3+. For the O-1s spectra, the contribution of broad peak around 531.1 eV originating from OH- in γ-FeOOH becomes larger as the film formation potential increases from -0.1 V to 0.7 V (Table 1) indicating that the percentage of γ-FeOOH in passive film increases. Due to the specific structure of γ-γ-FeOOH, film fracture occurs. Fortunately, the film has the self-repair function by the oxidizing of the base metal and inner layer [7], and the fracture/repair process make the film more and more porous and defective.
A mechanism of film formation from the above results is proposed as follow: at low film formation potential Fe3O4 oxidized from Fe/Fe2+ is the main constituent of passive film with a small
amount of γ-Fe2O3; as the potential increases, more and more Fe3O4 is anodically converted to γ-Fe2O3
[image:6.596.198.417.581.743.2]and γ-FeOOH; when the potential is high enough (0.7 V), γ-FeOOH becomes the vast majority composition of the film with porous structure, which makes the film defective.
Table 1. The content of species in the oxide film formed at different potentials.
Epassive (V vs. SCE) -0.1 0.3 0.7
the ratio Fe3+/Fe2+ 3.23 4 20
the percentage of oxyhydroxides 0.15 0.25 0.27
3.1.2 M-S test
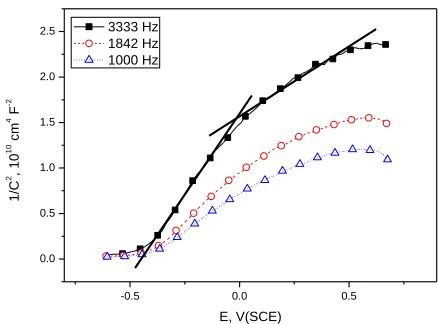
As can be seen from the plots of capacitance responding to the scanning potential at different frequencies in Fig. 2, the positive slope ranging from -0.4 to 0.6 V at all frequencies is characteristic of n-type semiconductor and the dependence of the capacitance on frequencies indicates the highly disordered nature of passive films [34]. It is also observed that between -0.4 and 0.6 V there is two different slopes (labeled by two straight line in Fig. 2), which results from the nonuniform donor distribution within the film [3].
Figure 2. M-S plots of passive film formed at 0.3 V for 5 h measured at different frequencies.
-0.5 0.0 0.5
0.0 0.5 1.0 1.5 2.0
2.5 3333 Hz 1842 Hz 1000 Hz
1
/C
2,
1
0
10
cm
4 F
-2
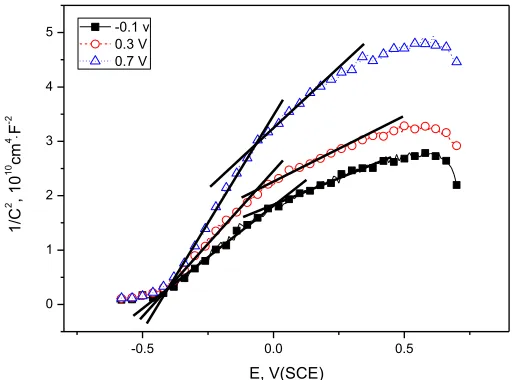
Figure 3. M-S plots of passive films formed at different potentials for 5 h.
As shown in Fig. 3, the slope of the linear region becomes larger with the increasing of film formation potential. According to the M-S relationship, the density of the donors at shallow (ND1)and
deep levels (ND2) can be calculated from the two slopes of linear regions [3], assuming the dielectric
constant of the passive film is 12.0 which has been used in literatures for oxide films of carbon steel or iron [5, 35]. The result in Table 2 shows that ND1 and the total donor density ND1+ND2 decrease as the
passive potential become more positive, in agreement with references [13, 36]. Since the electronic conductivity of the oxide film is thought to be proportional to the density of point defect, the conductivity of film is the lowest at 0.7 V. Because the defects in the film provide the tunnel for the migration of electron or ion, the decrease of ND can bring out a difficulty to charge transport process
through the oxide film [37], which is in agreement with the results from following SECM experiment. On the basis of PDM reported [38, 39], the donors in oxide films is Fe2+ interstitials and/or oxygen vacancies, and the former is the major donor since the rate of its consumption is higher than that of its generation [37] with increasing polarization potential, which is well consistent with the XPS result.
3.1.3 SECM test
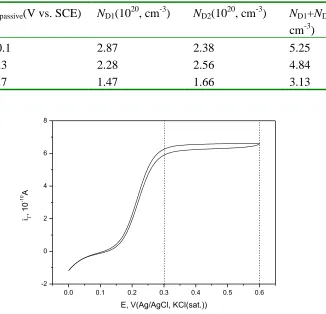
Fig. 4 shows the cyclic voltammogram of the Pt microdisk electrode in 0.5 mM FcMeOH + 0.05 M Na2B4O7 with a platform of steady-state limiting current typically obtained on a
microelectrode, and the labeled region of potential ranging from 0.3 to 0.6 V/Ag/AgCl was projected to apply on the carbon steel substrate covered by a passive film. When the substrate is applied potentials in the above scope, the oxidation reaction of Fe2+ will occur on it, which bring a competitive relationship between the substrate and the tip, so the current on the tip are smaller than the case of substrate unbiased at OCP.
-0.5 0.0 0.5
0 1 2 3 4
5 -0.1 v
0.3 V 0.7 V
1
/C
2 , 1
0
10 cm 4 F
-2
Table 2. ND obtained by Mott-Schottky equation
[image:8.596.134.392.486.671.2]Figure 4. Cyclic voltammogram of the tip in 0.5 mM FcMeOH + 0.05 M Na2B4O7.
Figure 5. Approach curves ofat the tip approaching the passive films formed at different potentials, the substrates are at OCP
The SECM feedback approach curves at of the tip approaching carbon steel substrate covered by three kind of passive films can be seen in Fig. 5, on which the NiT is the normalized tip current, that
Epassive(V vs. SCE) ND1(1020, cm-3) ND2(1020, cm-3) ND1+ND2 (1020,
cm-3)
-0.1 2.87 2.38 5.25
0.3 2.28 2.56 4.84
0.7 1.47 1.66 3.13
0.0 0.1 0.2 0.3 0.4 0.5 0.6 -2
0 2 4 6 8
iT
, 1
0
-1
0 A
E, V(Ag/AgCl, KCl(sat.))
0 1 2 3 4 5
0.4 0.6 0.8 1.0
NiT
L (d/a)
is, the ratio of itip and the steady-state limiting current itip,∞, and L is the normalized tip-substrate
distance (d/a, where d is the tip-substrate distance). As can be seen, all of the three approach curves show negative feedback behavior, which suggest low electrochemical reactivity or poor conductivity on of passive films. For the approach curve of the tip approaching the substrate with passive film formed at -0.1 V, there is a section of positive feedback phenomenon ranges from L=2 to 5 (similar phenomenon can be seen in [32, 40]), which suggests higher reactivity than the other two. The NiT of
the film formed at 0.3 V is close to that of 0.7 V, indicating the similar conductive properties of them, while the high NiT of the film formed at -0.1 V suggests better conductivity.
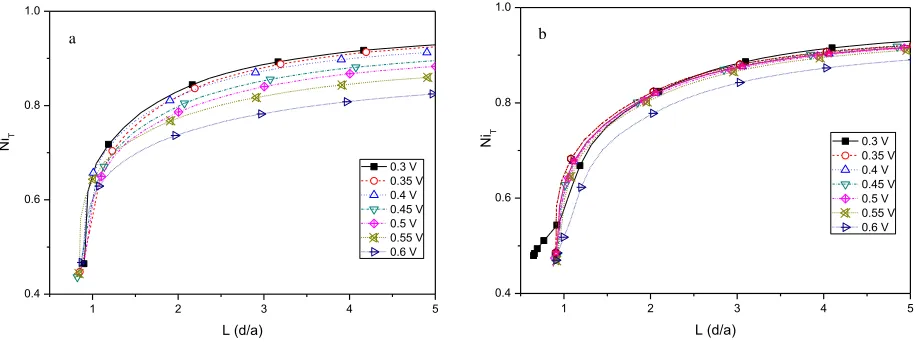
Figure 6. Approach curves for passive film formed at (a) 0.3 and (b) 0.7 V on carbon steel substrate applied different potentials.
In order to contrast the properties of films formed at 0.3 V and 0.7 V, a series of SECM approach curves was obtained as shown in Fig. 6a and b when the substrate was polarized as the second electrode. As can be seen from Fig. 6a and b, on both of them the current of the tip at each position decrease as the substrate potential (Esub) moves to the anodic value, which results from the
enlarged activity of oxide reaction on the substrate. The distinction between them is that the gap between the higher and the lower currents of 0.3 V is wider than that of 0.7 V shown in Fig. 6, that is, the reaction rate at the film of 0.3 V gives a larger growth with the increasing of substrate potential, indicating that the electronic transfer rate in the passive film is higher, and the conductivity of the film is better than that of 0.7 V. In terms of semiconducting properties of the film, the migration of electrons and/or ions is accomplished by the transport of point defect in the films, so the density of point defect in film formed at 0.3 V is larger than that of 0.7 V, which is in agreement with M-S result. By fitting the experimental approach curves to the equation 2 [41] as follows, the rate constant of the heterogeneous electron transfer k on the tip at each substrate potential can be calculated:
1 2 3 4 5
0.4 0.6 0.8 1.0
NiT
L (d/a)
0.3 V 0.35 V 0.4 V 0.45 V 0.5 V 0.55 V 0.6 V b
1 2 3 4 5
0.4 0.6 0.8 1.0
NiT
L (d/a)
[image:9.596.61.521.242.413.2]
0.006 0.113 0.0236 0.91 0.31
1
( , , ) ( , )
( , ) 1
(1 2.47 )(1 g g )
cond
T g T g
ins
T g
R R
g
Ni L R Ni L R
Ni L R
R L L
(2)
where Rg equals to rglass/a (rglass and a are the radius of disk insulator and Pt microdisk
respectively), and κ is the dimensionless rate constant for heterogeneous electron transfer (κ =ka/D).
cond T
Ni and NiTins are the normalized tip currents at a conductor and an insulator respectively. Fig. 7 is the
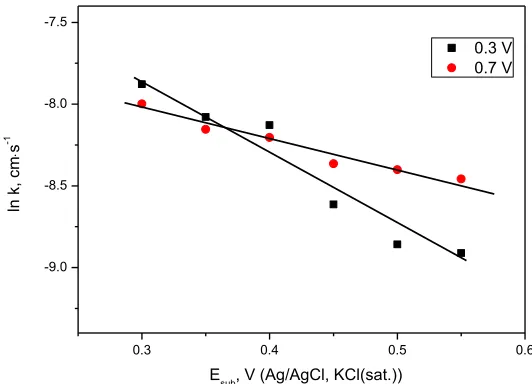
fitting result of k as the function of the substrate potential for the two kind of films, which indicates the k of 0.3 V decreases by a larger margin than that of 0.7 V as the substrate potential increases, and is much smaller at high Esub. Both results shown in Fig. 6 and Fig. 7 indicate the higher reactivity of the
[image:10.596.146.412.289.481.2]film formed at 0.3 V.
Figure 7. The fitting result of k as a function of the substrate potential. 3.1.4 EIS analysis
0.3 0.4 0.5 0.6
-9.0 -8.5 -8.0 -7.5
ln
k,
cm
s
-1
Esub, V (Ag/AgCl, KCl(sat.))
0.3 V 0.7 V
0 500 1000 1500
0 -500 -1000
-1500 -0.1 V 0.3 V
0.7 V
ZIm
, k
cm
2
Figure 8. The EIS results obtained for carbon steel electrodes passivated for 5 h under different potentials. The points with different shape were experimental data and the solid lines were fitting results.
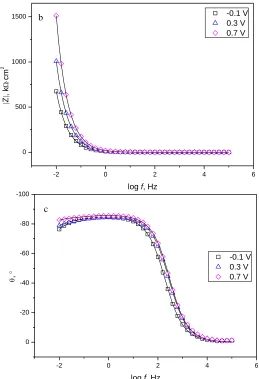
The EIS test of carbon steel passivated at potentials of -0.1, 0.3 and 0.7 V for 5 h was conducted and the results are presented in Fig. 8. As can be seen in Fig. 8, the impedance modules at low frequencies increase when passive potential shifts from -0.1 V to 0.7 V. The phase graph indicates two time constants of impedance behavior although there is some overlap.
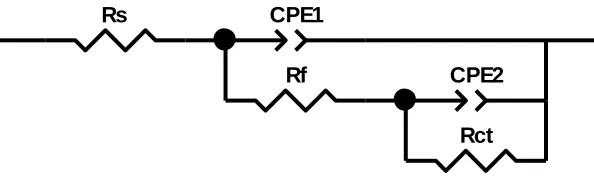
Using a hierarchically distributed equivalent circuit consists of two time constants illustrated in Fig. 9. , EIS results have been modeled and fitted successfully by ZView2 software with the equivalent circuit shown in Fig. 9. The impedance expression of the equivalent circuit is shown in equation 3 and 4:
1
1 2 1 1 / f s n f f R Z Rj R C
Z R (3)
22 2 1 f n ct R Z
j R C
(4)
-2 0 2 4 6
0 500 1000
1500 -0.1 V
0.3 V 0.7 V | Z | , k cm 2
log f, Hz
b
-2 0 2 4 6
0 -20 -40 -60 -80 -100 -0.1 V 0.3 V 0.7 V ,
log f, Hz
[image:11.596.150.409.74.453.2]
where ω is the angular frequency and n is the dispersion index of the time constant which ranges from 0 to 1. The meaning of the circuit elements can be made clear as follows: Rsis associated
to the electrolyte resistance; the high time constant have been related to RfCPE1, which concerns the
barrier properties of passive film and composes of the film resistance Rf in parallel with CPE1, the
constant phase element of the film and a capacitate capacitive element substituting for pure double layer capacitance; Another time constant RctCPE2which responses in low frequency is related to the
charge transfer process on the interface of passive film and electrolyte and Rct represents the charge
transfer resistance.
The fitting results are presented in Table 3, which shows the dependence of the evolution of resistances and capacitances on the film formation potential. The results indicate that the film resistance Rf is slightly affected by potentials and decreases with the shifting of potential from -0.1 to
0.3 V and then increases at 0.7 V, while the Rct keeps increasing with the potential increasing which is
consistent with SECM results. Besides, n1 values are above 0.9 in all cases and increase with the
potential shifting positively, indicating that the CPE1 is close to an ideal double layer capacitance.
Combining with XPS results, the explanation for the change is given as follows: the part of oxide film close to the metal surface and the part near the electrolyte experience different evolution as the film formation potential changes [7], that is, the former part keeps similar composition and nature at any potentials while the latter part changes a lot by the change of potential. At -0.1 V a compact but relatively conductive film on the substrate contains Fe3O4 formed from Fe0 or Fe2+, and there is no big
distinction between the two parts of the film. The outer part gets a further oxidation at 0.3 V to form a less conductive but defective film which possibly contains numbers of γ-FeOOH, resulting in the decline of Rfand the rise of Rct. As the film formation potential moves more anodic to 0.7 V, though
the content of γ-FeOOH increase, the continual fracture and self-repair process of the outer layer of the film make it more insulate, uniform and thick, and both the stability and corrosion resistance increase. Since the defects in the film provide the tunnel for the migration of electron or/and ion, the increase of charge transfer resistance of the oxide film results from the decrease of ND [37], which is in agreement
[image:12.596.100.397.551.645.2]with the M-S results.
Figure 9. Equivalent circuits for modeling the experimental EIS data.
Rs CPE1
Rf CPE2
Rct
Element Freedom Value Error Error %
Rs Free(+) 0 N/A N/A
CPE1-T Free(? 0 N/A N/A
CPE1-P Free(+) 1 N/A N/A
Rf Free(+) 0 N/A N/A
CPE2-T Free(? 0 N/A N/A
CPE2-P Free(+) 1 N/A N/A
Rct Free(+) 0 N/A N/A
Data File:
Circuit Model File: E:\experiment\2timecst.mdl
Mode: Run Fitting / Freq. Range (0.001 - 1000000)
Maximum Iterations: 100
Optimization Iterations: 0
Type of Fitting: Complex
Table 3. The fitting parameters of EIS data after passivated for 5 h under different potentials.
3.2 Degradation of passive film
3.2.1 SECM imaging of passive film after being corroded
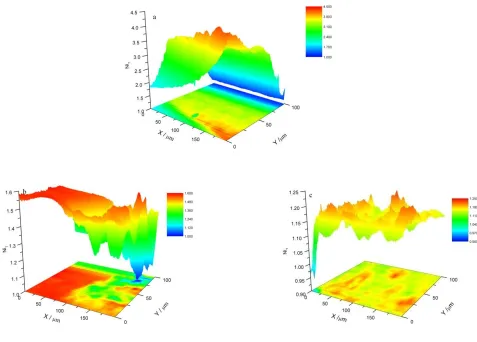
The electrochemical reactivity on the surface of passive film was imaged in SECM feedback mode shown in Fig. 10 after their degradation.
Figure 10. The SECM image of different oxide films covering carbon steel substrate immersed in 0.1
M NaCl for 1h, the film formation potential is (a) -0.1 V, (b) 0.3 V and (c) 0.7 V.
As can be seen in Fig. 10, the conductivity of the substrate is much larger in NaCl solution than that of Na2B4O7 solution since most of the NiT is larger than 1, and the distribution of current intensity
Epassive
(V vs. SCE) Rf
(Ω·cm2)
CPE1
(F·cm-2·s-n
) n1
Rct
(Ω·cm2)
CPE2
(F·cm-2·s-n
) n2
-0.1 2.68E6 2.08 E-5 0.945 1.63E6 2.22E-6 0.963
0.3 1.19E6 1.24 E-5 0.950 1.45E7 7.83E-7 0. 661
[image:13.596.56.533.333.675.2]
of the tip indicate the distribution of residual oxide films. The average current of the tip decreases as the film formation potential shifts positively, which is in agreement with the data of approach curves in Na2B4O7 solution.
For the SECM image of the film formed at 0.7 V, there are lots of current peaks scattering on the bulk area. The current peaks locate at sites which have the higher dissolution rate than that of areas around them, which are probably the defect sites on the oxide films in which the inner part and metallic Fe is easy to be exposed to the solution and dissolved quickly. The current peaks in Fig. 10c are more in the number and more uniformly distributed than Fig. 10a and b, indicating the porous and defective nature of the oxide film formed at 0.7 V, which is consistent with the XPS results. For the SECM image of oxide film formed at 0.3 V in Fig 10b, there are a number of low current islands dispersing on the substrate, which originate from indissolvable patches on the bulk film. Compared with the film of 0.7 V, the defect sites of film at 0.3V are larger, and those defect sites interact with each other to make slices of high current in 0.1 M NaCl solution, resulting in islands with poor conductivity floating on them. For the film formed at -0.1 V, there is a small piece of low current area on the corrosion topography, which is the result of the accumulation of corrosion product and beyond this, the current is larger than that of the other two kind passive films and uniformly distributed on the substrate. Besides, the total current decreases with the scanning in Fig. 10a, which probably results from the corrosion of the substrate.
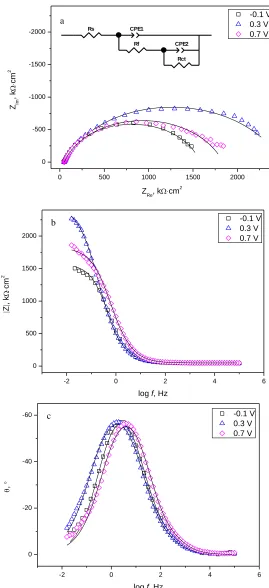
3.2.2 EIS analysis
Fig. 11 is the EIS results of carbon steel covered by oxide films formed at different potentials after being immersed in 0.1 M NaCl for 1 h and the equivalent circuit has been inserted in Fig. 11a. The circuit presents two time constants: RfCPE1 at high frequency and RctCPE2 at low frequency. As
shown in Table 4, the Rf of -0.1 V oxide film is much higher than the other two, which probably due to
the rapid formation of protective corrosion product substituting for the oxide film. The decrease of CPE1 with the potential moves from -0.1 to 0.7 V indicates the decrease of the roughness. Most
Figure 11. EIS results of carbon steel covered by oxide films formed at different potentials after being immersed in 0.1 M NaCl for 1 h. The points with different shape were experimental data and the solid lines were fitting results.
0 500 1000 1500 2000
0 -500 -1000 -1500 -2000
ZIm
, k
cm
2
ZRe, kcm2
-0.1 V 0.3 V 0.7 V
a
-2 0 2 4 6
0 -20 -40
-60 -0.1 V
0.3 V 0.7 V
,
log f, Hz
c
-2 0 2 4 6
0 500 1000 1500 2000
-0.1 V 0.3 V 0.7 V
|
Z
|
, k
cm
2
log f, Hz
b
Rs CPE1
Rf CPE2
Rct
Element Freedom Value Error Error %
Rs Free(+) 0 N/A N/A
CPE1-T Free(? 0 N/A N/A
CPE1-P Free(+) 1 N/A N/A
Rf Free(+) 0 N/A N/A
CPE2-T Free(? 0 N/A N/A
CPE2-P Free(+) 1 N/A N/A
Rct Free(+) 0 N/A N/A
Data File:
Circuit Model File: E:\experiment\2timecst.mdl
Mode: Run Fitting / Freq. Range (0.001 - 1000000)
Maximum Iterations: 100
Optimization Iterations: 0
Type of Fitting: Complex
Table 4. The fitting parameters of EIS data carbon steel covered by oxide films formed at different potentials after being immersed in 0.1 M NaCl for 1 h.
4. CONCLUSIONS
The passive films that formed on carbon steel with different anodic potentials in borate buffer solutions was investigated by macro- and micro- electrochemical technology and XPS characterization. The results indicate that the composition and electrochemical property of passive film are dependent on the film formation potential.
The SECM data show that the electrochemical reactivity on the surface of passive film is weakened as the film formation potential increases due to the slower charge transfer rate in the film. The kinetic constant k of the mediator oxidation reaction on the tip indicates different electrochemical reactivity on the surface of substrate. The electrochemical reaction resistance of the film increases with the passivation potential shifting to more anodic value, and at the same time, the density of point defect decreases by the M-S tests, which indicates the film become less conductive. According to XPS results, the ratio Fe3+/Fe2+ and the percentage of oxyhydroxide species increase simultaneously as the film formation potential moves from -0.1 to 0.7 V. The amount of Fe3O4 decreases, at the same time
the quantity of γ-Fe2O3 and γ-FeOOH increases.
Then, the degradation of passive films in 0.1 M NaCl was studied by combining the SECM and EIS test. The results show that the film formed at 0.3 V has the strongest corrosion resistance followed by that of 0.7 V which is more defective and porous, distinct from the evolution of the corrosion resistance of films with potentials in non-aggressive electrolyte.
ACKNOWLEDGEMENTS
This work was supported by National Natural Science Foundation of China (Nos. 51171172 and 51131005), Zhejiang Provincial Natural Science Foundation of China (No. Y4110074) .
References
1. Lambert P., Page C., Vassie P., Mater. Struct., 24 (1991) 351-358.
2. Glass G. K., Page C. L., Short N. R., Zhang J. Z., Corros. Sci., 39 (1997) 1657-1663. 3. Cheng Y. F., Luo J. L., Electrochim. Acta, 44 (1999) 2947-2957.
4. Freire L., Nóvoa X. R., Montemor M. F., Carmezim M. J., Mater. Chem. Phys., 114 (2009) 962-972.
5. Hamadou L., Kadri A., Benbrahim N., Appli. Surf. Sci., 252 (2005) 1510-1519.
6. Sanchez M., Gregori J., Alonso M. C., Garcia-Jareno J. J., Vicente F., Electrochim. Acta, 52 (2006) 47-53.
Epassive
(V vs.SCE) Rf
(Ω·cm2)
CPE1
(F·cm-2·s-n
)
n1 Rct
(Ω·cm2)
CPE2
(F·cm-2·s-n
) n2
-0.1 48.24 2.51E-4 0.83 1487.38 1.24E-4 0.83
0.3 13.14 7.74E-5 0.97 2443.31 4.04E-4 0.73
[image:16.596.60.537.123.210.2]
7. Xu W., Daub K., Zhang X., Noel J. J., Shoesmith D. W., Wren J. C., Electrochim. Acta, 54 (2009) 5727-5738.
8. Nagayama M., Cohen M., J. Electrochem. Soc., 109 (1962) 781-790.
9. Oblonsky L. J., Davenport A. J., Ryan M. P., Isaacs H. S., Newman R. C., J. Electrochem. Soc., 144 (1997) 2398-2404.
10.Gui J., Devine T. M., Corros. Sci., 32 (1991) 1105-1124.
11.Schmuki P., Buchler M., Virtanen S., Bohni H., Muller R., Gauckler L. J., J. Electrochem. Soc., 142 (1995) 3336-3342.
12.Harrington S. P., Wang F., Devine T. M., Electrochim. Acta, 55 (2010) 4092-4102. 13.Guo H. X., Lu B. T., Luo J. L., Electrochim. Acta, 52 (2006) 1108-1116.
14.Ahn S., Kwon H., Macdonald D. D., J. Electrochem. Soc., 152 (2005) B482-B490. 15.Lu Z., Macdonald D. D., Electrochim. Acta, 53 (2008) 7696-7702.
16.Zhang X., Wren J. C., Betova I., Bojinov M., Electrochim. Acta, 56 (2011) 5910-5918. 17.Chao C. Y., Lin L. F., Macdonald D. D., J. Electrochem. Soc., 128 (1981) 1187-1194. 18.Macdonald D. D., Urquidi-Macdonald M., J. Electrochem. Soc., 137 (1990) 2395-2402. 19.Macdonald D. D., J. Electrochem. Soc., 139 (1992) 3434-3449.
20.Frankel G. S., J. Electrochem. Soc., 145 (1998) 2186-2198.
21.Schmuki P., Journal of Solid State Electrochemistry, 6 (2002) 145-164. 22.Marcus P., Maurice V., Strehblow H. H., Corros. Sci., 50 (2008) 2698-2704.
23.Baltes N., Thouin L., Amatore C., Heinze J., Angew. Chem. Internat. Edi., 43 (2004) 1431-1435. 24.A.C. Bastos, A.M. Simões, S. Gonzáez, Y. González-García, R.M. Souto, Electrochem. Commun.,
6 (2004) 1212-1215.
25.Gabrielli C., Joiret S., Keddam M., Perrot H., Portail N., Rousseau P., Vivier V., J. Electrochem. Soc., 153 (2006) B68-B74.
26.Volker E., Inchauspe C. G., Calvo E. J., Electrochem Commun, 8 (2006) 179-183.
27.González-García Y., Burstein G. T., González S., Souto R. M., Electrochem. Commun., 6 (2004) 637-642.
28.Lister T. E., Pinhero P. J., Anal Chem, 77 (2005) 2601-2607.
29.Buchler M., Kerimo J., Guillaume F., Smyrl W. H., J. Electrochem. Soc., 147 (2000) 3691-3699. 30.Casillas N., Charlebois S. J., Smyrl W. H., White H. S., J Electrochem Soc, 140 (1993)
L142-L145.
31.Zhu R. K., Qin Z. Q., Noel J. J., Shoesmith D. W., Ding Z. F., Anal Chem, 80 (2008) 1437-1447. 32.Sidane D., Devos O., Puiggali M., Touzet M., Tribollet B., Vivier V., Electrochem. Commun., 13
(2011) 1361-1364.
33.Yu H. H., Sun P., Liu Z., Mirkin M. V., Langmuir, 24 (2008) 9941-9944. 34.Dean M. H., Stimming U., J. Phys. Chem., 93 (1989) 8053-8059.
35.Stimming U., Schultze J. W., Electrochim Acta, 24 (1979) 859-869.
36.Sikora E., Sikora J., Macdonald D. D., Electrochim. Acta, 41 (1996) 783-789.
37.Bojinov M., Fabricius G., Laitinen T., Mäkelä K., Saario T., Sundholm G., Electrochim. Acta, 45 (2000) 2029-2048.
38.Virtanen S., Schmuki P., Bohni H., Vuoristo P., Mantyla T., J. Electrochem. Soc., 142 (1995) 3067-3972.
39.Carmezim M. J., Simoes A. M., Montemor M. F., Belo M. D., Corros Sci, 47 (2005) 581-591. 40.Johnson L., Niaz A., Boatwright A., Voisey K. T., Walsh D. A., J. Electroanal. Chem., 657 (2011)
46-53.
41.Cornut R., Lefrou C., J. Electroanal. Chem., 621 (2008) 178-184.