Detection of ischemic penumbra using combined perfusion and T2* oxygen
challenge imaging
Craig A. Robertson
1†, Christopher McCabe
1, M. Rosario Lopez-Gonzalez
1,2,
Graeme A. Deuchar
1, Krishna Dani
1,2, William M. Holmes
1, Keith W. Muir
1,2,
Celestine Santosh
2, I. Mhairi Macrae
1*
Background Acute ischemic stroke is common and disabling, but there remains a paucity of acute treatment options and available treatment (thrombolysis) is underutilized. Advanced brain imaging, designed to identify viable hypoperfused tissue (penumbra), could target treatment to a wider population. Existing magnetic resonance imaging and computed tomography-based technologies are not widely used pending validation in ongoing clinical trials. T2*oxygen challenge mag-netic resonance imaging, by providing a more direct readout of tissue viability, has the potential to identify more patients likely to benefit from thrombolysis – irrespective of time from stroke onset – and patients within and beyond the 4·5 h thrombolysis treatment window who are unlikely to benefit and are at an increased risk of hemorrhage.
Aims This study employs serial multimodal imaging and voxel-based analysis to develop optimal data processing for T2* oxygen challenge penumbra assessment. Tissue in the emic hemisphere is compartmentalized into penumbra, isch-emic core, or normal using T2* oxygen challenge (single threshold) or T2*oxygen challenge plus cerebral blood flow (dual threshold) data. Penumbra defined by perfusion imaging/apparent diffusion coefficient mismatch (dual thresh-old) is included for comparison.
Methods Permanent middle cerebral artery occlusion was induced in male Sprague-Dawley rats (n=6) prior to serial multimodal imaging: T2* oxygen challenge, diffusion-weighted and perfusion imaging (cerebral blood flow using arterial spin labeling).
Results Across the different methods evaluated, T2*oxygen challenge combined with perfusion imaging most closely pre-dicted 24 h infarct volume. Penumbra volume declined from one to four-hours post-stroke: mean±SD, 77±44 to 49±37 mm3 (single T2* oxygen challenge-based threshold);
55±41 to 37±12 mm3 (dual T2* oxygen challenge/cerebral blood flow); 84±64 to 42±18 mm3(dual cerebral blood flow/ apparent diffusion coefficient), as ischemic core grew: 155±37 to 211±36 mm3(single apparent diffusion coefficient thresh-old); 178±56 to 205±33 mm3 (dual T2* oxygen challenge/ cerebral blood flow); 139±30 to 168±38 mm3(dual cerebral blood flow/apparent diffusion coefficient). There was evi-dence of further lesion growth beyond four-hours (T2-defined edema-corrected infarct, 231±19 mm3).
ConclusionsIn conclusion, T2* oxygen challenge combined with perfusion imaging has advantages over alternative mag-netic resonance imaging techniques for penumbra detection by providing serial assessment of available penumbra based on tissue viability.
Key words: ischemic penumbra, neuroimaging, oxygen challenge, T2*
MRI
Introduction
Following an acute ischemic stroke, the ischemic penumbra rep-resents electrically inactive and metabolically compromised but potentially viable tissue which is the target for acute stroke thera-pies. It ultimately becomes incorporated into final infarct unless salvaged by reperfusion. The thrombolytic agent alteplase (recombinant tissue plasminogen activator, rt-PA) is the only drug currently licensed to treat stroke. It may be administered within 4·5 h of stroke onset based on clinical symptoms and a noncontrast computed tomography (CT) scan to exclude intrac-erebral hemorrhage or major established hypodensity (1). Alteplase is designed to induce reperfusion by lysing occluding blood clots and significantly increases independent recovery, but carries a risk of brain hemorrhage (∼2%, increasing with delay in administration) and is underutilized. A UK report of thromboly-sis rates reported that an overall 1·4% of acute stroke patients were thrombolysed, despite 14% of patients being eligible for thrombolysis (2).
Thrombolysis decisions may soon be informed by more advanced imaging, identifying a potential responder population based on individual pathophysiology. Magnetic resonance imaging (MRI) perfusion imaging (PI)/diffusion-weighted imaging (DWI) mismatch is widely accepted as a marker of pen-umbral tissue, while DWI/FLAIR mismatch may have utility in predicting lesion age and is under investigation as a selection marker for thrombolysis when stroke onset time is unknown (3,4). Clinical adoption of perfusion/diffusion mismatch is cur-rently limited by the lack of standardized perfusion and diffusion thresholds, uncertain ability to differentiate penumbra from benign oligemia, and uncertainty whether DWI hyperintensity reflects irreversible damage, particularly at early time-points. Correspondence: I. Mhairi Macrae*, Institute of Neuroscience and
Psychology, University of Glasgow, Glasgow G61 1QH, UK. E-mail: [email protected]
1Centre for Stroke and Brain Imaging Research, Institute of Neuroscience and Psychology, College of Medicine, Veterinary & Life Sciences, Univer-sity of Glasgow, Glasgow, UK
2Institute of Neurological Sciences, Southern General Hospital, Glasgow, UK
Received: 29 January 2014; Accepted: 27 May 2014
Conflicts of Interest: None declared.
Funding: Research supported by Medical Research Council funding: Project grant G0700439 and PhD studentship [to CR]; MRLG and KWM supported by SINAPSE (www.sinapse.ac.uk), Pooling Initiative funded by Scottish Funding Council and Chief Scientist Office of the Scottish Executive.
†Present address: Department of Biomedical Engineering, University of Strathclyde, Wolfson Centre, Glasgow, UK.
DOI: 10.1111/ijs.12327
Clinical trials have to date failed to support the utility of perfusion–diffusion mismatch in selection for thrombolysis (5,6). Alternative MRI techniques for penumbra detection are therefore worthy of investigation, particularly methods that may offer an index of tissue viability that is not dependent on interpretation of PI thresholds alone.
We have developed such an alternative approach for penumbra detection. T2*oxygen challenge (T2*OC) detects compensatory mechanisms in response to reduced cerebral blood flow (CBF), which may identify a distinct MRI tissue signature of penumbra. Penumbra displays a higher venous deoxyhemoglobin concentra-tion than surrounding tissue due to increased oxygen extracconcentra-tion fraction (OEF) (7) and cerebral blood volume (CBV) (8). T2*
MRI is sensitive to OEF and CBV changes as venous deoxyhemo-globin provides the contrast for blood oxygen level-dependent (BOLD) T2*imaging (9). T2*OC uses a transient hyperoxic chal-lenge to identify different tissue compartments in the ischemic hemisphere, based on changes in deoxyhemoglobin : oxyhemo-globin ratio (10). Deoxyhemooxyhemo-globin and free oxygen dissolved in plasma are paramagnetic and will reduce T2*signal, while dia-magnetic oxyhemoglobin has minimal influence on T2*. Increased oxygen delivery during an OC converts deoxyhemoglo-bin to oxyhemoglodeoxyhemoglo-bin, with a resultant increase in T2*-weighted signal which can be mapped as a percentage signal change (Fig. 1). Penumbra (and large veins) therefore displays the
great-est increase in T2*-weighted signal during an OC, ischemic core displays the smallest change, and nonischemic tissue displays a small increase in signal.
T2*OC may provide insight into the dynamic behavior of hypoperfused tissue, and better prediction of tissue viability com-pared with the PI/DWI paradigm. A small proof of concept study in acute stroke patients (11) supports its potential clinical utility, and subsequent preclinical developments have improved tech-nique sensitivity and ability to translate to the clinic (12).
Aims
Compartmentalizing penumbra using two parameters (dual threshold analysis combining T2*OC with CBF values) rather than using a single T2*threshold may improve the technique further and provide a more accurate assessment of penumbra. We sought to compare single- and dual-threshold analysis for pen-umbra quantification using T2*OC and to evaluate its utility for serial scanning to track penumbra fate over the first four-hours in a rat permanent middle cerebral artery occlusion (MCAO) model. Serial PI and DWI (zero to four-hours), and 24 h T2-weighted imaging provided information on ischemia, acute tissue injury, and infarct, respectively, and alternative assessments of penumbra from PI/apparent diffusion coefficient (ADC) mis-match and ADC lesion growth.
[image:2.595.127.453.361.656.2]Methods
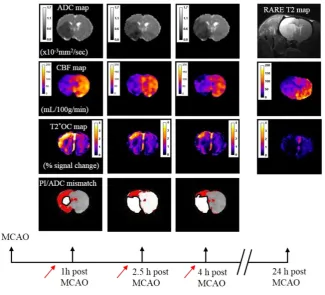
All experiments were performed under a UK Home Office license, were subject to the Animals (Scientific Procedures) Act (1986) and approved by the local University Ethical Review Panel. Figure 1 displays the full experimental protocol.
Rodent MCAO surgery
Anesthesia was induced in male Sprague-Dawley rats (n=6, 290– 350 g, Harlan, Bicester, UK) with 5% isoflurane and maintained at 2% in medical air, enriched with oxygen (30%).
Body temperature was maintained at 37°C±0·5°C and a femoral artery cannulated for continuous blood pressure moni-toring (AcqKnowledge, Biopac Systems, Goleta, CA, USA) and blood gas analysis. Permanent MCAO (pMCAO) was achieved with a 5-0 silicon rubber-coated intraluminal monofilament advanced to block the origin of the middle cerebral artery (13).
MRI scanning
MRI data were acquired on a Bruker Biospec (Wikingerstrasse, Karlsruhe, Germany) 7-T/30-cm system equipped with an inserted gradient coil (121 mm ID, 400 mT/m) and a 72-mm birdcage resonator.
T2*-weighted imaging
A single-shot, gradient echo EPI sequence (TE: 20 ms, TR: 10 s, matrix 96×96, FOV 25×25 mm, 8 contiguous slices of 1·5 mm thickness, 2 averages, temporal resolution 20 s, 30 repetitions) was used to assess T2*-weighted signal change during OC. The para-digm for the T2*-weighted OC sequence was five-minutes breathing air, followed by five-minutes breathing 100% oxygen, and then 10 mins breathing air. Four coronal MRI slices through-out MCA territory, selected to minimize the effect of susceptibil-ity distortion around the ear canals, were used to generate T2*-weighted signal change maps using ImageJ (http:// rsb.info.nih.gov/ij/). The average baseline signal (over five-minutes) was subtracted from the peak signal during OC, then divided by the average baseline signal and multiplied by 100.
DWI and PI scanning
DWI [spin-echo planar (SE-EPI) TE: 43 ms, TR: 4000·3 ms, matrix 96×96, FOV 25×25 mm2, 3 directions: x, y, z, B values: 0,
1000 s/mm2, 8 slices of 1·5 mm thickness] was performed to
assess ischemically injured tissue and it was possible to collect data from eight slices, four of which anatomically matched PI and T2*. Noninvasive quantitative CBF was carried out to identify the perfusion deficit on four 1·5-mm thick coronal slices throughout the MCA territory using a form of pseudo-continuous arterial spin labeling based on a train of adiabatic inversion pulses (14,15). The sequence employs a spin-echo EPI imaging module (TE 20 ms, TR 7000 ms, matrix 96×96, FOV 25×25 mm, slice thickness 1·5 mm, 16 averages, 4 shots) preceded by 50 hyperbolic secant inversion pulses in a 3s train.
T2-weighted imaging
A coronal RARE T2 sequence (effective TE: 46·8 ms, TR: 5000 s; in plane resolution 97μm; 30 slices, 0·75 mm thickness) was used for T2-derived infarct measurement at 24 h post-stroke.
MRI data analysis for penumbra assessment
Volumes of tissue with abnormal T2*OC response were deter-mined using two approaches: (1) applying a single threshold [mean plus 2 standard deviations (SDs) of the contralateral hemi-sphere, excluding the ventricles, venous sinuses, and large veins] to T2*OC maps in ImageJ to derive tissue volumes (8,16); (2) voxel-based analysis using T2*and CBF data and thresholds to categorize tissue into four compartments (T2*OC-defined penumbra, ischemic core, normal tissue and veins/venous sinuses, see Fig. 3a). PI and DWI data were analyzed in two ways, (1) voxel-based analysis using ADC and CBF thresholds to cat-egorize tissue into five compartments: PI/ADC mismatch, isch-emic core, normal, negative mismatch, and ventricles; and (ii) penumbra volume derived from ADC lesion growth using an in-house absolute ADC threshold.
Quantitative ADC maps (in mm2/s) were calculated using
Para-vision (Bruker BioSpin, Ettlingen, Germany) and subsequently analyzed using ImageJ. CBF maps were also generated using ImageJ. The ADC lesion was thresholded using an in-house abso-lute ADC value of 0·59×10−3mm2/s, which when applied to data
at four-hours post-stroke generated an ADC lesion which matched 24 h (brain swelling corrected) infarct following perma-nent MCAO in Sprague-Dawley rats.
Coregistration
T2*images were linearly coregistered to corresponding ADC slice maps using Analyze (AnalyzeDirect, Inc., Overland Park, KS, USA). Following coregistration, T2*, ADC and CBF thresholds were applied to relevant images (four coronal slices within MCA territory) for voxel-based analysis and volumetric measurements of tissue compartments.
Voxel-based analysis
Voxel-based analysis, generated using codes written in Matlab (MathWorks, Natick, MA, USA) allowed unbiased analysis of the spatial, volumetric, and dynamic evolution of penumbra and ischemic core. Tissue was compartmentalized using thresholds set for two parameters: (1) T2*signal change and CBF for T2*OC data sets; and (2) ADC and CBF data sets for PI/ADC mismatch. Color-coded images were derived based on T2*OC signal change and CBF values, or ADC and CBF values enabling analysis of temporal changes in voxel distribution across ischemic core, pen-umbra, and nonischemic tissue.
The number of voxels within each tissue compartment was counted and converted to an area by multiplying the number of pixels by the pixel area (0·0678 mm2) and then a volume by
mul-tiplying the areas by slice thickness (1·5 mm) and adding the volumes for the four consecutive slices. Group data were gener-ated for each tissue compartment at each acute time-point post-stroke for T2*and CBF, ADC/CBF, and from the single T2*
threshold data sets.
Large veins and venous sinuses were segregated from the main tissue compartments by excluding tissue with elevated T2*
For T2*OC/CBF analysis, the four compartments were:
•
T2*OC-defined penumbra: T2*signal change above set thresh-old, CBF value below set threshold•
Ischemic core: T2* signal change below set threshold, CBF below set threshold•
Normal: T2*signal change below and CBF above set thresh-olds, and•
Veins and venous sinuses: both T2* signal change and CBF above set thresholdsFor ADC/CBF analysis, the five compartments were:
•
PI/ADC mismatch: ADC value above set threshold, CBF value below set threshold•
Ischemic core: both ADC and CBF values below set thresholds•
Normal: both ADC and CBF values above set thresholds•
Negative mismatch: ADC value below threshold, CBF value above threshold, and•
Ventricles: Above an ADC threshold of 0·96×10−3mm2/s ADC lesion expansionADC lesion expansion from one to four-hours was subtracted from 24 h infarct data to provide an alternative assessment of penumbra.
ADC lesion expansion
The absolute ADC threshold of 0·59×10−3mm2/s was applied,
and the volume of the ADC lesion quantified by multiplying the area on each slice by 1·5 (slice thickness) and summing the data for either four or eight slices. Penumbral volume was derived by subtracting the ADC lesion volume at each time-point from the
swelling-corrected 24 h infarct volume and was quantified over four slices, for direct comparison with T2*OC and PI/ADC mis-match and for all eight slices available from DWI.
Quantifying infarct volume at 24 h
Infarct was calculated from regions of hyperintensity on the RARE T2 scans and corrected for ipsilateral brain swelling and contralateral compression (17). Eight coronal RARE T2 slices which matched the four-hour acute ADC slices were selected, and the ipsilateral and contralateral hemisphere areas, as well as 24 h infarct areas, were calculated by manual tracing using ImageJ. The volumes of the ipsilateral and contralateral hemispheres and the infarct were calculated by summing the individual areas and mul-tiplying by slice thickness (0·75 mm).
Prediction error
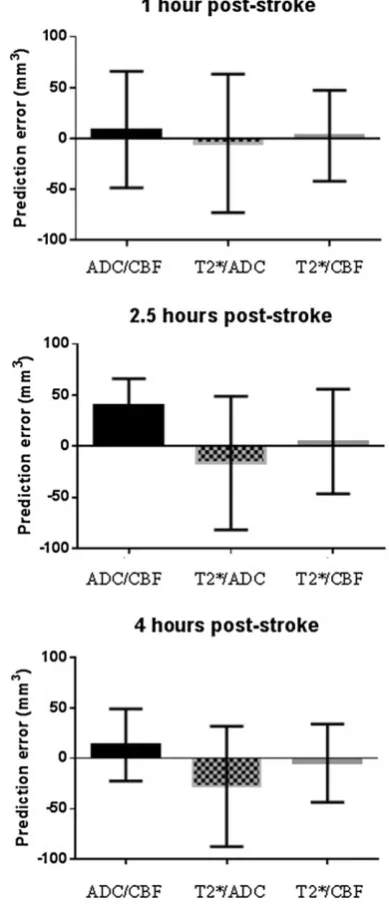
Ischemic core and penumbra volumes were summed and sub-tracted from edema-corrected infarct to calculate a prediction error for each method.
Statistical analysis
Data are presented as mean±SD. Comparison of physiological variables, lesion evolution, and volumetric differences in isch-emic core and penumbra across the four methods were analyzed using one-way ANOVA with Student’s pairedt-test and Bonferroni correction. A pairedt-test was used to analyze ADC-derived lesion volume at four-hours and T2-defined infarct at 24 h.
Fig. 2 T2*OC percentage signal change maps and equivalent ADC maps over four coronal slices at 1, 2·5, and 4 h post-stroke in a representative animal. T2*OC maps show a reduction in penumbral tissue from one to four-hours post-stroke, and ADC maps display a concomitant increase in ADC lesion. Calibration bar on T2*maps, in units of percentage signal change and on ADC maps, in×10−3mm2/s. ADC, apparent diffusion coefficient; OC, oxygen
[image:4.595.130.453.405.682.2]Results
Physiological variables
Physiological variables [apart from partial pressure of oxygen in arterial blood (PaO2) during OCs] were maintained within
physi-ological limits. Recordings collected immediately before each OC (Table 1) displayed no significant differences in partial pressure of carbon dioxide in arterial blood (PaCO2) or PaO2. A small
increase in blood pH was recorded at four-hours compared with one-hour and 2·5 h time-points (P<0·0001).
(a)
(b)
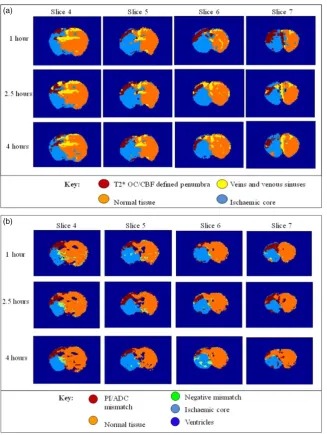
Fig. 3 (a) Representative color-coded maps of T2*OC/CBF over four slices and three time-points post-stroke. Voxel-based analysis was performed by applying the CBF (57% reduction in mean contralateral values) and T2*(mean+2 SD) thresholds. There was an expansion in ischemic core with concomitant loss of penumbral from one to four-hours post-stroke. Note that veins and venous sinuses (yellow shading) are differentiated from penumbral tissue, due to high T2*value and CBF above thresholds. (b) Equivalent color-coded maps of PI/ADC mismatch in the same animal. Voxel-based analysis performed using the same CBF threshold and an absolute ADC threshold of 0·6×10−3mm2/s. ADC, apparent diffusion coefficient; CBF, cerebral blood
[image:5.595.319.547.80.137.2]flow; OC, oxygen challenge; PI, perfusion imaging.
Table 1 Physiological variables
One-hour scan 2·5 h scan Four-hour scan
pH 7·34±0·04 7·34±0·05 7·36±0·04*
PaCO2 44·5±5·7 45·3±10 42·4±5·7
PaO2 93·6±11 93·4±12 95·7±15
*P<0·0001, one-way ANOVA followed by Student’s pairedt-test with a Bonferroni correction.
[image:5.595.145.473.229.665.2]T2*OC -defined penumbra
Single threshold analysis
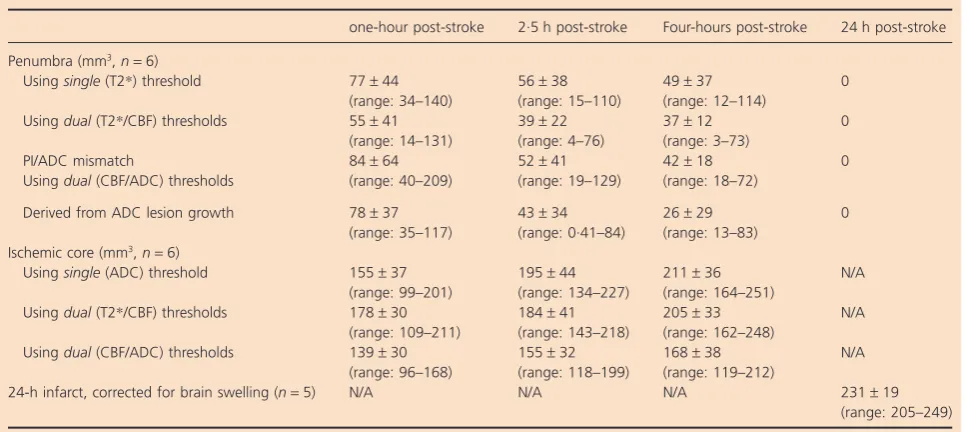
During OC, an increased T2*percentage signal change, compared with surrounding and contralateral tissue, was apparent in dor-solateral cortex (Fig. 1). This increased signal lay within the per-fusion deficit adjacent to the difper-fusion abnormality (Figs 1 and 2). The mean volume of tissue defined as penumbra was 77±44 mm3at one-hour post-stroke and gradually declined over
subsequent time-points (Table 2) as the volume of ADC-defined core increased. OC repeated at 24 h revealed no increased T2*
signal in tissue previously identified as penumbra (Fig. 1, Table 2).
Dual threshold analysis
Combining T2*% signal change and CBF data, voxels defining penumbra were clustered in the dorsolateral cortex, with the remaining voxels categorized as ischemic core, normal, or venous sinuses/veins (Fig. 3a). Volumetric data for penumbra and isch-emic core at three time-points are shown in Table 2. Normal and venous compartments remained stable throughout (data not shown).
PI/ADC mismatch-defined penumbra
Dual threshold voxel-based analysis
Equivalent ADC/CBF maps revealed a similar pattern of penum-bra, ischemic core, and normal voxels (Fig. 3b). The fourth com-partment (CBF above threshold, ADC below threshold) defined a small number of negative mismatch voxels. Volumetric data for penumbra and ischemic core are shown in Table 2. Normal and negative mismatch compartments remained stable throughout (data not shown).
ADC lesion growth-defined penumbra
Penumbra defined by subtracting the initial ADC lesion (over the same four slices) from the 24-h T2-defined (edema-corrected) infarct is presented in Table 2 for comparison. ADC data were also available across a greater rostro-caudal range (eight coronal slices). Penumbral volume determined from ADC lesion growth across eight slices was 168±59 mm3at one-hour, 119±50 mm3
at 2·5 h, and 92±48 mm3at four-hours post-stroke.
Comparison of methods for penumbra and ischemic core detection
Volumetric (Table 2) and spatial differences (Fig. 3) in tissue compartments were apparent between T2*OC/CBF and PI/ADC mismatch-defined penumbra, although differences across the four methods were not statistically significant. At one-hour post-stroke, for penumbra volume determined from T2*OC/CBF, 69% of voxels were also determined to be penumbra on PI/ADC match, and for penumbra volume determined from PI/ADC mis-match, 44% of voxels were also determined to be penumbra on T2*OC/CBF. The equivalent figures were 59% and 55%, respec-tively, at 2·5 h, and 47% and 30%, respecrespec-tively, at four-hours post-stroke.
The sum of penumbra and ischemic core volumes, for the different methods, was compared with (edema-corrected) infarct volume to assess their predictive value (Fig. 4). Dual threshold
T2*/CBF produced the smallest prediction error at all three time-points. All four methods provide evidence of remaining penum-bra at the four-hour time-point. Four-hour ADC lesions compared with 24 h T2-defined infarct revealed evidence for further lesion growth beyond four-hours (Figs 5 and 6).
Discussion
Positive identification of penumbra is not employed in the current imaging selection for intravenous rt-PA administration,
[image:6.595.315.510.65.518.2]which is based on exclusion of intracerebral hemorrhage or exten-sive established ischemic damage on noncontrast CT. While several observational clinical studies support perfusion/diffusion mismatch as a penumbral marker that may identify a ‘responder’ population, both within three-hours of onset and at times up to nine-hours after onset (18,19), a differential treatment effect in imaging-selected patients is not yet supported by randomized controlled trial data (6,20). PI/DWI mismatch is limited by the lack of standardized perfusion and diffusion thresholds (21,22) and small size of clinical data sets from which thresholds are
[image:7.595.68.552.78.294.2]derived. Assumptions that underlie the interpretation of DWI-and PW-abnormal tissue are questioned by findings including the reversibility of some DWI lesions with early reperfusion (23) and a heterogeneous metabolic state on concurrent positron emission tomography (PET) from voxels within acute DWI lesions (24). A fundamental limitation of current MR penumbral imaging is the inability to detect metabolic activity. By offering a dynamic measure of deoxyhemoglobin concentration that reflects varia-tions in OEF (therefore, tissue metabolic capacity) and CBV, the T2*OC technique may better discriminate penumbra, healthy
Table 2 Volumetric assessment of ischemic penumbra and ischemic core
one-hour post-stroke 2·5 h post-stroke Four-hours post-stroke 24 h post-stroke
Penumbra (mm3,n=6)
Usingsingle(T2*) threshold 77±44 56±38 49±37 0
(range: 34–140) (range: 15–110) (range: 12–114)
Usingdual(T2*/CBF) thresholds 55±41 39±22 37±12 0 (range: 14–131) (range: 4–76) (range: 3–73)
PI/ADC mismatch 84±64 52±41 42±18 0
Usingdual(CBF/ADC) thresholds (range: 40–209) (range: 19–129) (range: 18–72)
Derived from ADC lesion growth 78±37 43±34 26±29 0
(range: 35–117) (range: 0·41–84) (range: 13–83) Ischemic core (mm3,n=6)
Usingsingle(ADC) threshold 155±37 195±44 211±36 N/A (range: 99–201) (range: 134–227) (range: 164–251)
Usingdual(T2*/CBF) thresholds 178±30 184±41 205±33 N/A (range: 109–211) (range: 143–218) (range: 162–248)
Usingdual(CBF/ADC) thresholds 139±30 155±32 168±38 N/A (range: 96–168) (range: 118–199) (range: 119–212)
24-h infarct, corrected for brain swelling (n=5) N/A N/A N/A 231±19 (range: 205–249)
Volumetric assessment (calculated over four coronal slices) of ischemic penumbra using the single T2*threshold and dual (T2*/CBF and CBF/ADC) thresholds; ischemic core using the single ADC threshold, and dual (T2*/CBF and CBF/ADC) thresholds; 24-h edema-corrected infarct. One-way ANOVA followed by Student’s pairedt-test with Bonferroni correction. There was no statistically significant difference between penumbral volumes assessed by the four different methods at any time-point. ADC, apparent diffusion coefficient; CBF, cerebral blood flow; PI, perfusion imaging.
Fig. 5 (a) ADC lesion areas at the three acute time-points and 24 h RARE T2-edema corrected infarct displayed across all eight forebrain slices and presented as mean±SD. ADC lesion expansion (and concomitant mismatch loss) over the first four-hours was greatest within the four central coronal slices (3–6). Subsequent increases in ischemic damage were greatest in the caudal (1–3) and rostral (8) poles. ADC lesion volume increased significantly over time (P<0·05, one-way ANOVA with Bonferroni correction). (b) Equivalent ADC-derived lesion volume and T2-derived infarct volume at 4 h and 24 h, respectively (P<0·001, Student’s pairedt-test). The ADC lesion volume calculated over eight slices at 1, 2·5, and 4 h was 191±51 mm3,
[image:7.595.69.547.351.534.2]tissue, and ischemic core compared with existing MRI mismatch techniques.
This study provides evidence for the utility of T2*OC serial imaging in preclinical acute stroke research, and improved predictive value when T2*OC is combined with CBF data using voxel-based analysis. The maintenance of the increased T2*signal during OC and its return to baseline following OC is consistent with T2*-weighted signal change reflecting differences either in penumbral oxygen consumption or vasculature response to OC compared with surrounding tissue (10,11,25,26). Earlier valida-tion studies with single time-point T2*OC also confirmed that the region of increased T2*signal exhibited characteristics of penumbra, that is, hypoperfused tissue with ongoing glucose metabolism (25) and recovery after early reperfusion (26).
As expected, a measureable volume of penumbra was detected with all four analysis methods at one-hour post-stroke and decreased in size with time, as tissue became incorporated into the ischemic core. Because a significant volume of penumbra was detected using all four methods at four-hour post-stroke, the OCs
per semay have supported penumbra tissue and attenuated ADC-lesion growth during the scanning session. In previous studies using this rat strain and stroke model, where no OCs were applied, less than 10 mm3 of mismatch remained by three to
four-hours post-stroke. There is evidence in the literature supporting the potential of oxygen to prevent penumbra loss. In a published study where PaO2was maintained at 235–240 mmHg,
no deterioration in mismatch volume was apparent over the first four-hours post-stroke (27). Studies investigating normobaric hyperoxia have reported 100% O2attenuated ADC lesion growth
without altering CBF, thereby preserving CBF/ADC mismatch, and reducing infarct volume in permanent and transient MCAO models (28–30).
Limitations and further improvements
This pilot study was not designed to establish the superiority of one method over another, but to explore the relationship between T2*OC responsiveness and blood flow in the evolving stroke lesion: as such, it was not powered to detect statistical differences between techniques. The data demonstrate a trend to improved prediction of final infarct volume by T2*OC combined with per-fusion imaging, which needs to be confirmed in a larger study. The potential for translation of T2*OC as a clinical imaging method has been established (11). A new clinical study is under way to optimize the T2*OC technique on scanners of different field strength, using healthy volunteers, a controlled human model system of brain hypoperfusion, and a homogeneous clini-cal population with acute stroke. Further refinements of the tech-nique include strategies to increase the T2*signal to OC and reduce the % oxygen delivered (12) which will be translated to the clinic in the future.
Finally, improvements in penumbra detection may be possible with susceptibility-weighted imaging. These sequences measure magnitude information, but they also exploit phase information, thereby producing T2*-weighted sequences which are exquisitely sensitive to the dephasing effects of paramagnetic substances such as deoxyhemoglobin, and provide enhanced contrast over con-ventional gradient echo sequences.
Summary
Dual threshold T2*OC/CBF voxel-based analysis identified tissue with characteristics of penumbra within anterior cerebral artery/ MCA collateral supply territory, which decreased in size over time. When compared with alternative methods, T2*OC com-bined with CBF produced the smallest error in predicting subse-quent infarct volume. The additional information it delivers, complementary to current MRI techniques for stroke diagnosis, supports its potential use within the routine stroke imaging pro-tocol and adds to evidence promoting T2*OC as a valuable adjunct to PI/DWI imaging for penumbra detection. There was
Fig. 6 T2*OC-defined penumbra at four-hours post-stroke over eight coronal slices with accompanying ADC maps, and 24 h RARE T2 scans from a representative rat. Calibration bar on T2*maps, in units of per-centage signal change and on ADC maps, in×10−3mm2/s. ADC, apparent
[image:8.595.47.280.60.488.2]some evidence that repeat OCs delayed the evolution of stroke-induced damage, but more prolonged normobaric hyperoxia and strategies (e.g. intravenous oxygen carriers) to improve oxygen delivery to penumbra are required to influence final outcome.
Acknowledgements
The authors thank Lindsay Gallagher and Jim Mullin for technical assistance.
References
1 Hacke W, Kaste M, Bluhmki Eet al. Thrombolysis with alteplase 3 to 4.5 hours after acute ischemic stroke.N Engl J Med2008;359:1317–29. 2 Rudd AG, Hoffman A, Grant R, Campbell JT, Lowe D. Stroke throm-bolysis in England, Wales and Northern Ireland: how much do we do and how much do we need? J Neurol Neurosurg Psychiatry2011;
82:14–9.
3 Thomalla G, Rossbach P, Rosenkranz M et al. Negative fluid-attenuated inversion recovery imaging identifies acute ischemic stroke at 3 hours or less.Ann Neurol2009;65:724–32.
4 Thomalla G, Fiebach JB, Ostergaard Let al. A multicenter, random-ized, double-blind, placebo-controlled trial to test efficacy and safety of magnetic resonance imaging-based thrombolysis in wake-up stroke (WAKE-UP).Int J Stroke2013, doi: 10.1111/ijs.12011. [Epub ahead of print].
5 Mishra NK, Albers GW, Davis SM et al. Mismatch-based delayed thrombolysis: a meta-analysis.Stroke2010;41:25–33.
6 Kidwell CS, Jahan R, Gornbein Jet al. A trial of imaging selection and endovascular treatment for ischemic stroke. N Engl J Med 2013;
368:914–23.
7 Baron JC. Mapping the ischemic penumbra with PET: implications for acute stroke treatment.Cerebrovasc Dis1999;9:193–201.
8 Baron JC, Frackowiak RSJ, Herholz Ket al. Use of PET methods for measurements of cerebral energy metabolism and hemodynamics in cerebrovascular disease.J Cereb Blood Flow Metab1989;9:723–42. 9 Ogawa S, Lee TM, Kay AR, Tank DW. Brain magnetic resonance
imaging with contrast dependent on blood oxygenation.Proc Natl Acad Sci U S A1990;86:9868–72.
10 Santosh C, Brennan D, McCabe Cet al. Potential use of oxygen as a metabolic biosensor in combination with T2(*)-weighted MRI to define the ischemic penumbra. J Cereb Blood Flow Metab 2008;
28:1742–53.
11 Dani KA, Santosh C, Brennan Det al. T2*weighted magnetic reso-nance imaging with hyperoxia in acute ischemic stroke.Ann Neurol 2010;68:37–47.
12 Deuchar GA, Brennan D, Griffiths H, Macrae IM, Santosh C. Per-flourocarbons enhance a T2*based MRI technique for identifying the penumbra in a rat model of acute ischemic stroke.J Cereb Blood Flow Metab2013;33:1422–8.
13 Longa EZ, Weinstein PR, Carlson S, Cummins R. Reversible middle cerebral artery occlusion without craniectomy in rats.Stroke1989;
20:84–91.
14 Moffat BA, Chenevert TL, Hall DE, Rehemtulla A, Ross BD. Continu-ous arterial spin labeling using a train of adiabatic inversion pulses. J Magn Reson Imaging2005;21:290–6.
15 Baskerville TA, McCabe C, Mullin J, Carberry L, Macrae IM, Holmes WM. Non-invasive MRI measurement of CBF: validating an arterial spin labelling sequence with99mTc-HMPAO CBF autoradiography in a rat stroke model.J Cereb Blood Flow Metab2012;32:973–7. 16 McCabe C, Gallagher L, Gsell W, Graham D, Dominiczak AF, Macrae
IM. Differences in the evolution of the ischemic penumbra in the SHRSP and WKY rat.Stroke2009;40:3864–8.
17 Gerriets T, Stolz E, Walberer Met al. Complications and pitfalls in rat stroke models for middle cerebral artery occlusion: a comparison between the suture and the macrosphere model using magnetic reso-nance angiography.Stroke2004;35:2372–7.
18 Albers GW, Thijs VN, Wechsler Let al. Magnetic resonance imaging profiles predict clinical response to early reperfusion: the diffusion and perfusion imaging evaluation for understanding stroke evolution (DEFUSE) study.Ann Neurol2006;60:508–17.
19 Lansberg MG, Straka M, Kemp Set al. MRI profile and response to endovascular reperfusion after stroke (DEFUSE 2): a prospective cohort study.Lancet Neurol2012;11:860–7.
20 Davis SM, Donnan GA, Parsons MWet al. Effects of alteplase beyond 3 h after stroke in the Echoplanar Imaging Thrombolytic Evaluation Trial (EPITHET): a placebo-controlled randomised trial. Lancet Neurol2008;7:299–309.
21 Kane I, Carpenter T, Chappell Fet al. Comparison of 10 different magnetic resonance perfusion imaging processing methods in acute ischemic stroke: effect on lesion size, proportion of patients with diffusion/perfusion mismatch, clinical scores, and radiologic out-comes.Stroke2007;38:3158–64.
22 Dani KA, Thomas RGR, Chappell FMet al. Computed tomography and magnetic resonance perfusion imaging in ischemic stroke: defini-tions and thresholds.Ann Neurol2011;70:384–401.
23 Kidwell CS, Saver JL, Mattiello Jet al. Thrombolytic reversal of acute human cerebral ischemic injury shown by diffusion/perfusion mag-netic resonance imaging.Ann Neurol2000;47:462.
24 Guadagno JV, Warburton EA, Jones PSet al. How affected is oxygen metabolism in DWI lesions?: a combined acute stroke PET-MR study. Neurology2006;67:824.
25 Robertson CA, McCabe C, Gallagher Let al. Stroke penumbra defined by an MRI-based oxygen challenge technique: 1. validation using [14C]2-deoxyglucose autoradiography. J Cereb Blood Flow Metab 2011a;31:1778–87.
26 Robertson CA, McCabe C, Gallagher Let al. Stroke penumbra defined by an MRI-based oxygen challenge technique: 2.validation based on the consequences of reperfusion.J Cereb Blood Flow Metab2011b;
31:1788–98.
27 Foley LM, Hitchens TK, Barbe Bet al. Quantitative temporal profiles of penumbra and infarction during permanent middle cerebral artery occlusion in rats.Transl Stroke Res2010;1:220–9.
28 Henninger N, Bouley J, Nelligan JM, Sicard KM, Fisher M. Normo-baric hyperoxia delays perfusion/diffusion mismatch evolution, reduces infarct volume, and differentially affects neuronal cell death pathways after suture middle cerebral artery occlusion in rats.J Cereb Blood Flow Metab2007;27:1632–42.
29 Singhal AB, Wang X, Sumii T, Mori T, Lo EH. Effects of normobaric hyperoxia in a rat model of focal cerebral ischemia-reperfusion. J Cereb Blood Flow Metab2002;22:861–8.
30 Rink C, Roy S, Khan Met al. Oxygen-sensitive outcomes and gene expression in acute ischemic stroke.J Cereb Blood Flow Metab2010;