EVS26
Los Angeles, California, May 6 - 9, 2012
Impacts of Harmonic Distortion from Charging Electric
Vehicles on Low Voltage Networks
R. Carter
1, A. Cruden
1, A. Roscoe
1, D. Densley
2, T. Nicklin
31University of Strathclyde, EEE, 204 George St., Glasgow, G1 1XW, UK 2SSE, Inveralmond House, 200 Dunkeld Road, Perth, PH1 3AQ, UK 3Ford Motor Company, Dunton Engineering Centre, Laindon, Essex, SS15 6EE, UK
Abstract
This paper reports current total harmonic distortion (THD) levels from a variety of production electric vehicles, using both 13A and 32A charging modes where available, at various initial states of charge. THD has been found to vary between similarly rated on-board chargers, although typically remaining within regulations. Measured current THD ranged from 2-4% for one type of onboard charger, to up to 12% for another. The individual current harmonics were also found to be within regulations, although 32A chargers, if operated in 13A mode, produced harmonics in excess of the regulations for 13A chargers. The impacts of the harmonic distortion on low voltage networks were simulated using a sample low voltage network from the UK, and were found to be unlikely to create a significant voltage harmonic distortion at the substation. Some vehicle types could have a charging electric vehicle at every house without creating excessive voltage harmonic distortion, and the worst performing vehicle type could still be charged at up to 87% of the houses simultaneously. However, UK regulations for 32A vehicle chargers were found to be inadequate as very high levels of distortion could be created by a charger which emitted the maximum permitted current harmonics.
Keywords: charging, modeling, infrastructure
1
Introduction
Increasing numbers of electric vehicles (EVs) and plug-in hybrid electric vehicles (PHEVs) are expected to come into use in the near future [1]. The potential impact of these vehicles on the power quality of the electricity grid is poorly understood. Harmonic distortion levels from chargers with currents at or below 16A are subject to regulations in the UK and EU [2], however these regulations were developed for low power devices such as PCs and dimmer switches, and their suitability for the higher power demands of electric vehicle chargers merits confirmation. Higher current devices are also guided by
regulations [3, 4], but again these were not developed with electric vehicles in mind.
This paper reports the harmonic distortion levels from a variety of production electric vehicles charged at different power levels. The impacts of the harmonic distortion on low voltage networks have been simulated using a sample network from the UK.
2
Methodology
to create detailed waveforms for voltage and current on each phase. Harmonic spectra are then derived from the data using the FFT method described in [5, 6], showing both magnitude and phase of each harmonic.
The data logger has been used to record the voltage and current supplied to a variety of electric vehicles as shown in Table 1, using both 13A and 32A charging modes where available, at various initial states of charge.
[image:2.612.323.540.165.296.2]The impacts of the EV charger harmonics on low voltage networks were simulated using a network model created using OpenDSS and Matlab. The model parameters were taken from an existing low voltage network found in southeast England, with characteristics as shown in Table 2.
Table 1: Characteristics of tested electric vehicles.
Vehicle Battery Charger
A 380V DC 35kWh, Single phase, 230V 50 Hz, 32A Also has 13A setting
B 380V DC 28kWh, Single phase, 230V 50 Hz, 13A
C 355V DC 32kWh, Single phase, 230V 50 Hz, 32A
[image:2.612.71.291.320.567.2]D 162V DC 16kWh, Single phase, 230V 50 Hz, 13A
Table 2: Characteristics of the modelled network. Number of Houses 226
Number of Feeders 5 Transformer:
Voltage 6.6kV/433V
Rating 750kVA
Peak Load 441kVA
Fault Level 10MVA
Impedance 4.7%
3
Results
3.1
Harmonic Measurement Results
Typical harmonic spectra for the 13A vehicle chargers on full power are shown in Figure 1, along with the limits specified in BS EN 61000-3-2 for class A equipment, which includes electric vehicle chargers. The even harmonics emissions from the chargers were negligible, so only the odd harmonics are shown. Vehicle A, when manually set to its 13A mode, exceeded the regulations for a
number of harmonic values, while vehicles B and D were always within the limits. The harmonics generated by Vehicle A throughout the 13A charge were equivalent to those generated by the charger when it output 13A during the ramp-down at the end of a 32A charge.
Figure 1: Typical harmonic spectra for the vehicles charging at a nominal current of 13A, compared to the
regulations in BS EN 61000-3-12.
Vehicle C, and vehicle A when in 32A mode, were both well within the limits for equipment with currents greater than 16A following BS EN 61000-3-12, and Engineering Recommendation G5/4 Stage 1. Since G5/4 provides more detailed limits for individual harmonics up to the 50th, this regulation will be the focus of the rest of this analysis.
Figure 2: Typical harmonic spectra for the vehicles charging at a nominal current of 32A, compared to the
regulations in G5/4 and BS EN 61000-3-2.
[image:2.612.323.541.456.583.2]compared to the class A BS EN 61000-3-2 limits as shown in Figure 2.
Current total harmonic distortion (THD) levels during a full power charge varied from 4% or less for Vehicles B and C to as much as 12% for Vehicle A on its 13A setting. THD increased as the charging power decreased for all the vehicles, mostly due to the decrease in the magnitude of the fundamental. The displacement power factor remained close to unity for all vehicles, remaining greater than 0.98 during full power charging. Typical THD and displacement power factor values for the different vehicles during a full power charge are shown in Table 3.
Table 3: Typical current THD and displacement power factor values for each vehicle.
Vehicle I THD (%) Displacement pf A 5-12% 0.988 (13A) 0.998 (32A)
B 2-4% 0.998
C 3% 0.999
D 6-8% 0.996
3.2
Network Modeling Results
3.2.1 100% EV Charging Scenario
The electric vehicles were simulated as loads on the network modeled in OpenDSS, using snapshot harmonic data. The details of the network, including physical layout and connection of the houses, were provided by the utility company SSE together with positive-sequence resistance and reactance values for the cables. Zero sequence values were not available, and so were estimated as 4 times the positive sequence values for the 4-core cables. Capacitance values were estimated using line data from DigSilent, however a sensitivity analysis showed that, due to the short length of the cables, the capacitance value made a negligible difference to the final result.
The harmonics snapshots were generated by using measured data from the charging vehicles. The feeders were initially modeled as having one electric vehicle at each house, all charging simultaneously, to represent a worst-case scenario. Note that user trials for vehicle A found that on average 31% of the vehicles would be charged on any given weekday evening, and 22% on a
weekend [8]. Background power demands and harmonics from household lights and appliances were not included in this stage of the simulations, so the results estimate the impact from the electric vehicles alone.
The voltage harmonic levels at the substation were calculated by OpenDSS, and compared to the permitted voltage distortion levels as given in BS EN
50160
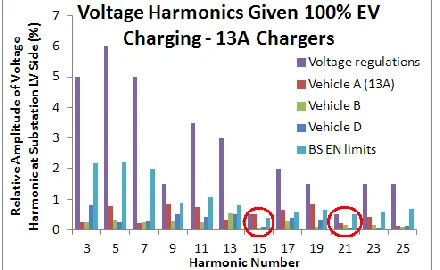
[9], to determine the overall impact that the EVs could have on the substation. The magnitude of each harmonic for a given vehicle was found as the average of the recorded full power charge data, while the phase angles were taken from a typical spectrum for that vehicle. A hypothetical vehicle with harmonic magnitudes equal to the upper limits specified in BS EN 61000-3-2 was also modeled. [image:3.612.67.287.296.369.2]The voltage distortions generated by the different vehicles with 13A chargers are shown in Figure 3, and the results for the 32A chargers are shown in Figure 4. The permitted voltage distortion levels as given in BS EN
50160
are also shown. The voltage distortion created by the chargers for vehicles B and D remained below the limits for all harmonic values. However, the distortion created by vehicle A slightly exceeded regulations for the 15th harmonics in both 13A and 32A mode, while that created by the hypothetical BSEN charger exceeded the limits for the 21st harmonic. Vehicle C’s charger also caused excessive voltage distortion in the 21st harmonic. [image:3.612.323.543.503.638.2]Figure 4: Voltage distortion generated at the substation by the different 32A vehicle chargers.
3.2.2 Impact of Phase Variation
The current harmonics from different charging vehicles will partially cancel out due to the variations in phase angle. For the simulations described in section 3.2.1, the same harmonic phase angles and magnitudes were input to the model for each house, however the impedance of the cables introduced some variation in phase angle at the transformer, and hence some harmonics cancellation. In practice, the harmonic spectra from each charging vehicle would not be identical, and this would introduce greater variation in the phase angles and potentially greater levels of harmonic cancellation.
The significance of this effect was evaluated by modeling vehicles A (in 13A mode) and B with a selection of spectra as measured from multiple instances of charging the vehicles. Vehicles C and D were not included in this analysis due to insufficient data.
The phase angles for individual harmonics during a 13A charge of Vehicle A were found to vary considerably throughout a full-power charge, unlike the other vehicles for which only the higher harmonics showed much variation of phase angle when charging at full power. A single charging event for Vehicle A was used to provide a range of harmonic spectra. Vehicle B showed consistent harmonic phase angles during a single charge, but multiple tests performed on different vehicles of type B and at different locations showed a range of phase angles between charging events. Three different charging events for Vehicle B were used
to provide the spectra. In each case, the harmonics spectrum for an individual house was chosen at random from the selection provided.
The increased variation in phase angle introduced more cancellation of the harmonics. Assuming a vehicle was charging at each house, the voltage distortion at the substation for any given harmonic was found to be reduced by up to 0.15% for Vehicle B and up to 0.34% for Vehicle A. The increased harmonic cancellation meant that the voltage distortion caused by Vehicle A did not exceed the regulations for the 15th harmonic.
3.2.3 Impact of Number of Charging EVs For vehicles A and C, and for the BSEN charger, the simulations were performed with different percentages of EVs charging. Charging EVs were assigned randomly to each household, with different overall percentages of houses having charging vehicles, to determine the level at which the substation voltage distortion would be within the regulations. The harmonic spectrum injected at each household was the same for any given type of vehicle.
Since the vehicles were assigned to houses randomly, there was some variation in the impacts for a given percentage of charging vehicles depending on how they were distributed on the network. However, in each test case, 87% or more of the houses could have a charging electric vehicle without any of the voltage distortion limits being exceeded. Since the vehicle trial showed that typically 31% of users would charge their vehicles in a given night, this suggests that excessive voltage harmonics distortion caused by charging electric vehicles would be a rare event, even with a very high rate of ownership. The acceptable percentages of houses with charging vehicles for each of the examined types of vehicle are shown in Table 4.
background load, which was considered to be purely resistive. In this case, the additional resistive load meant that only Vehicle C still caused excessive voltage deviation even with 100% of houses having a charging electric vehicle.
Table 4: Maximum acceptable percentage of houses on the test network with charging vehicles, for different
types of vehicle.
Vehicle Max. Acceptable % of Houses with Charging Vehicles A (13A)
A (32A) 94% 98%
B 100%
C 87%
D 100%
BSEN 98%
3.2.4 32A EV Charger Regulations
The harmonics emissions of the measured 32A chargers were considerably lower than the regulations given in G5/4, as shown in Figure 2. A hypothetical charger with current harmonics equal to the limits given in G5/4 was modeled at a few of the houses in the network. The regulation limit on overall THD was not applied; the model does not consider harmonic coupling, so the impact of each harmonic could be assessed individually. It was found that if the chargers were located on the same phase, at houses next to the transformer, then just two such chargers would be sufficient to generate voltage distortion in excess of the regulations. The 11th, 13th, 17th, 19th and 23rd harmonics were found to be at most risk of excess voltage distortion.
4
Conclusions
The harmonics from the measured commercial electric vehicle chargers are not expected to have a significant impact on low voltage networks. However, the regulations governing 32A chargers permit very high harmonic currents and an electric vehicle could conform to the regulations while still producing sufficient harmonics to cause significant negative effects to a low voltage network, especially if this vehicle were to become popular. We therefore recommend that the regulations governing high power on-board electric vehicle chargers be adjusted to strictly limit their
permissible harmonic current emissions. One possibility would be to bring the regulations in line with those found in BS EN 61000-3-2.
Future work should include an analysis of low voltage cable and transformer parameters, to provide a more accurate model of harmonic impacts on low voltage networks. In particular, an analysis of the characteristics of 4-core paper insulated, lead-covered, steel tape armored (PILCSTA) cables, which are no longer manufactured but remain common in older UK networks, should be undertaken.
Acknowledgements
Funding for this work was provided by TSB project TP11/LCV/6/I/BF013B.
References
[1] Arup/Cenex, "Investigation into the Scope for the Transport Sector to Switch to Electric Vehicles and Plug-in Hybrid Vehicles," Dept. for Business Enterprise and Regulatory Reform (BERR), October 2008.
[2] "Electromagnetic Compatibility (EMC) Part 3-2: Limits - Limits for harmonic current emissions (equipment input current ≤16A per phase)," British Standards, BS EN 61000-3-2:2006+A2:2009, 2009.
[3] "Electromagnetic compatibility (EMC) Part 3-12: Limits - Limits for harmonic currents produced by equipment connected to public low-voltage systems with input current >16A and ≤75A per phase," British Standards, BS EN 61000-3-12:2005, 2006.
[4] "Engineering Recommendation G5/4: Planning Levels for Harmonic Voltage Distortion and the Connection of Non-Linear Equipment to Transmission Systems and Distribution Networks in the United Kingdom," 2001.
[5] A. J. Roscoe, R. Carter, A. Cruden, and G. M. Burt, "Fast-responding Measurements of Power System Harmonics Using Discrete and Fast Fourier Transforms with Low Spectral Leakage," in the Proceedings of the IET Renewable Power Generation Conference, Edinburgh, UK, 2011, [6] G. W. Chang, C. I. Chen, J. Liu, and M. C. Wu,
Transmission and Distribution, vol. 2, pp. 192-201, 2008.
[7] GAMBICA, "Managing Harmonics: A Guide to ENA Engineering Recommendation G5/4-1, Sixth Edition," 2011.
[8] R. Carter, A. Cruden, D. Densley, and T. Nicklin, "Timed Charging Points for Electric Vehicles: User Behaviour and Potential Impacts to Low Voltage Networks," in the Proceedings of the European Electric Vehicle Congress (EEVC), Brussels, Belgium, 2011, pp. 1-7
[9] "Voltage characteristics of electricity supplied by public electricity networks," British Standards, BS EN 50160:2010, 2010.
Authors
Rebecca Carter received a BSc in Physics in 2002, an MSc in Physics in 2004. She was awarded a PhD from the University of Strathclyde in 2010. She is currently employed as a Research Fellow at Strathclyde. Her research interests include distributed energy storage and the potential impacts of electric vehicles on the grid.
Andrew Cruden received a PhD in the field of optical current sensing from the University of Strathclyde. He is currently a Reader within the Renewable Technology Group at Strathclyde. His current research interests are: vehicle-to-grid energy storage of aggregated electric vehicles; wind turbine condition monitoring; continuously variable transmissions for electric vehicles using magnetic gears.
Andrew J. Roscoe received the M.A. degree in Electrical and Information Sciences Tripos at the University of Cambridge in 1991. He worked GEC Marconi, Hewlett Packard and subsequently Agilent Technologies from 1991 to 2003. He was awarded an MSc from the University of Strathclyde in 2004, and his Ph.D degree in 2009. Andrew is currently a Senior Research Fellow in the Institute
for Energy and the Environment, working in the fields of distributed and renewable generation, active network management, power system metrology, inverter control, and marine/aero power systems.
David Densley is the Head of Sustainable Transport at SSE plc. David studied electrical engineering at Cambridge University and his current role involves understanding the impact of electric vehicles on the electricity network and the provision and standardisation of EV charging infrastructure.