Effect of silane coupling agent on mechanical performance of glass
fibre
L. Yang•J. L. Thomason
Received: 30 July 2012 / Accepted: 12 October 2012 / Published online: 9 November 2012 ÓSpringer Science+Business Media New York 2012
Abstract Mechanical performance of commercially manufactured unsized and c-aminopropylsilane sized boron-free E-glass fibres has been characterised using single-fibre tensile test. Both apparent fibre modulus and fibre strength were found to strongly depend on fibre gauge length. The average strength of sized fibres was found 40–80 % higher than unsized fibres at different gauge lengths. Weibull analysis suggested that the failure mode of unsized fibres could be described by unimodal Weibull distribution, whereas the strength distribution of sized fibres appeared to be controlled by two exclusive types of flaw population, types A and B. Comparison of the Weibull plots between unsized and sized fibres revealed that the strength of unsized fibres was likely to be dominated by type A flaws existing on the bare glass surface and type B flaws may be related to the defects on the glass surface coated with silane. This was partially supported by the observation of fractured cross-sectional area using SEM. It was, therefore, proposed that the strength difference between unsized and sized glass fibres may be more rea-sonably interpreted from the surface protection standpoint as opposed to the flaw healing effect. The results obtained from this study showed that silane coupling agent plays a critical role in the strength retention of commercially manufactured E-glass fibres and the silane effect on the fibre strength is also affected by the change in gauge length of the sample.
Introduction
As a major reinforcement in polymer composites, E-glass fibre delivers high mechanical performance such as Young’s modulus and tensile strength. More recently, boron-free E-glass has been developed to reduce environ-mental emissions from glass fibre manufacturing plants. This has broadened the scope of definition for E-glass compositions [1]. It is well-known that the mechanical performance of glass fibres in general depends on many factors stemming from glass composition and forming history [2, 3]. In particular, the correlation has been extensively studied between fibre strength and various factors including sample dimension, test temperature, and stress corrosion [4–6]. The practical fibre strength is usu-ally found to be considerably lower than the theoretical expectation [7,8]. This is normally attributed to existence of surface flaws, which may cause stress concentration and lead to premature fibre fracture as the fibre is loaded.
The surface of commercially manufactured glass fibres is routinely treated with organofunctional silanes together with other ingredients such as different film formers and auxiliary agents. Such surface treatment, commonly refer-red to as sizing, is a key step influencing the success or failure of most reinforcement products due to the major role it plays in the price, processibility, and performance of that product [9]. Organofunctional silanes can serve as a coupling agent to promote fibre–matrix interaction levels by various adhesion mechanisms such as chemical bonding and molecule interdiffusion. Moreover, these multifunc-tional species can make a big impact in fibre strength. It has been reported that silanes seem to have ability to ‘heal’ surface flaws and improve average fibre strength [10–12]. It has been advocated by some authors that the silane deposits can, to some extent, patch up the flaws and in turn L. Yang (&)J. L. Thomason
Department of Mechanical Engineering, University of Strathclyde, 75 Montrose Street, Glasgow G1 1XJ, UK e-mail: [email protected]
reduce the stress concentration at the flaws [11]. It has also been reported that this healing process may be augmented by the addition of film formers [12]. A controlled study of sizing effect on mechanical properties of glass fibre requires a comparison of mechanical performance between bare and sized glass fibres on a basis of other variables, including composition and forming history, remaining identical. This prerequisite may be compromised by dis-symmetrical conditioning to the samples. For example, it has been shown that mechanical properties of glass fibres can be significantly altered after exposure to additional heat treatment [13–15]. Therefore, it may be inappropriate to obtain the unsized glass fibre by means of burning off surface coating at elevated temperature [16]. Furthermore, manual handling before the measurement of fibre strength may create new flaws and/or change the existing ones. It follows that the results for the strength from sized fibres would be able to not only show possible flaw healing efficiency but also indicate the protection effect caused by the surface coating.
In this study, we used commercially manufactured bare and sized glass fibres and characterised their mechanical performance. Since these fibres underwent the full course of typical industrial processing and additional handling before testing, we attempted to investigate how a silane couple agent would affect the mechanical performance of glass fibres after this entire process. The main focus was given to the difference of the fibre strength and its distri-bution between bare and sized glass fibres. In addition, fibres were tested at multiple gauge lengths to determine actual Young’s modulus and dimension dependence of the fibre strength.
Experimental
Materials
Boron-free E-glass (Advandex) fibres supplied by Owens Corning Vetrotex were investigated in this study. All fibre rovings were produced on the same pilot scale bushing and were received as 20 kg continuous single-end square edge packages. The rovings had a nominal tex of 1200 g/km and a single-fibre diameter of 17.4±1.3lm. No sizing was applied to the water finished fibres which had only been water sprayed using the normal cooling sprays under the bushing [8], these samples are referred to as water sized or unsized (since it can be assumed that most water is removed during the subsequent drying step). The sized fibres were coated with a normal rotating cylinder sizing applicator containing a 1 % c-aminopropylsilane (APS) hydrolysed solution in distilled water. All fibre packages were subsequently dried at 105°C for 24 h.
Single-fibre tensile test
The fibres were used as received from the manufacturer. Single-fibre tensile properties were determined following the method described in ASTM C1557-03. Single-fibres were meticulously separated from the as-received glass fibre strands. Individual fibres were glued onto card tabs with a central window cut out to match the desired gauge length for the test. Card frames were cut from 250 g/m2 grade card and single fibres were fixed to the card at both sides of the window using LoctiteTM Gel Superglue. The fibre cross-section was obtained by assuming the glass fibres along the gauge length have a uniform circular cross-section normal to the axis of the fibres. The cross-cross-sectional area was then calculated from the individual average fibre diameters measured at three points along the gauge length by Nikon Epiphot Inverted optical microscopy. During handling of the fibre in the microscope, care was taken to avoid fibre damage through contact with the microscope objective. The card mounted single fibres were gripped in an Instron 3342 universal testing machine equipped with a 10 N load cell. After the specimen had been mounted in the test machine, a section of the tab was carefully cut away, leaving the specimen free to be loaded during the test. Gauge lengths of 5, 10, 20, 40 and 80 mm were tested for both fibre types and approximately 80–100 fibres were tested at each gauge length. The loading rate was adjusted according to the fibre gauge length so that the fibres were subjected to constant strain rate of 1.5 %/min for all gauge lengths. All the tests at different gauge lengths were carried out at room temperature and 50 % relative humidity.
In order to determine the locus of failure, some addi-tional fibres were used and covered with epoxy resin during testing. This allowed for the preservation of original frac-ture cross-sectional area in the fibre, especially for the samples with a high strength. The broken fibres were immediately rinsed with acetone to remove the resin from the surface. The samples were then coated with gold and examined under SEM.
Results and discussion
Fibre diameter distribution
and is related to several parameters including the internal diameter of the bushing tip, the velocity of molten glass flow, and attenuation rate [18]. For a given manufacturing configuration of glass fibres, it is the variation of molten glass flow that mainly accounts for fibre diameter distri-bution. The variation in the viscosity of glass melt is believed to be caused by the temperature distribution across the bushing [18]. Therefore, it is not surprising to see that both bare and sized fibres possess the identical fibre diameter distribution since they were manufactured under the same processing configuration. The only differ-ence in their forming history lies in the silane application to the fibre surface. It is also noticed in Fig.1 that the pres-ence frequency of the mean value is actually only 21 % within a fairly broad distribution.
Fibre modulus
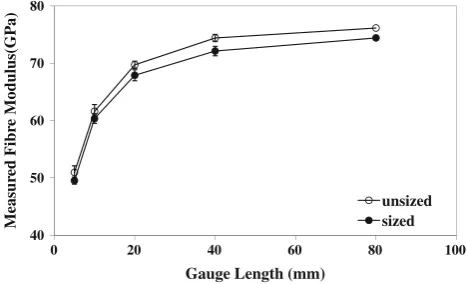
The results for the average fibre modulus (error bars show 95 % confidence limits) of unsized and silane sized glass fibres obtained from single-fibre tensile test are shown as a function of the sample gauge length in Fig.2. It can be seen that the apparent modulus obtained from the raw measurement is highly dependent on the gauge length. The Young’s modulus of bulk boron-free E-glass has been quoted as 80 GPa [2]. At short gauge lengths the values are much lower but increase rapidly with an increase of the fibre length until at long gauge length the measured mod-ulus appears to approach an asymptotic value. It appears that in all cases the unsized fibres give a higher value for modulus compared to the sized fibres. The modulus dependence on gauge length is a phenomenon related to the use of the testing machine crosshead position to approxi-mate the fibre strain which does not take into account the contribution of the strain of the other components in the testing system, in particular the paper tabs and the glue. The corrected fibre modulus can be obtained using the
following considerations [19]. Suppose that the fibre stress–strain curve is linear up to the breaking strain. IfE* is the experimental Young’s modulus then the measured failure stressrris given byrr=E*9DLr*/L0whereDLr
is the apparent breaking elongation and L0 is the initial
sample length. The actual fibre breaking elongationDLris
given by DLr=DLr -K, where K is the machine and
sample mounting displacement. Assuming that K is pro-portional to the applied stress we obtain K=Crr where
C is proportional to the machine compliance. The actual fibre modulus is then given by
E¼ rr ðDLr=L0Þ
¼ rrL0 DL
r Crr
ð1Þ
And hence
1 E¼
1 Eþ
C L0
or L0 E¼
L0
E þC ð2Þ
Using Eq.1, the fibre modulus can be obtained from the intercept of a straight line plot of experimental fibre compliance (1/E*) against inverse gauge length (1/L0).
Using Eq.2, it is necessary to plot the value of L0/E*
(whereE* is obtained from the slope of the experimental stress–strain curve) against L0 and the fibre modulus is
obtained from the inverse of the slope of the line in such a plot. It is also possible to obtain an estimate of the value of the machine complianceCfor the experimental setup used. Given no significant changes in the experimental procedure this value ofC can then be used to obtain an estimate of fibre modulus from measurement on single fibres carried out at a single-gauge length. It is also worth mentioning that the correction for the modulus based on Eq.2 may contain less potential error since the calculation of modulus depends on the slope of the line within the range of the experimental data instead of an intercept value extrapolated outside the range of the experimental data. Figure3
presents the modulus data plotted according to Eq.2. 0
5 10 15 20 25
14 16 18 20 22 24
Fraction Pr
esent (%)
Fibre Diameter ( m)
unsized sized
µµ
Fig. 1 Diameter distribution of E-glass fibres (open circlesunsized, filled circlessized)
40 50 60 70 80
0 20 40 60 80 100
Measur
ed Fibr
e
Modulus(GP
a)
Gauge Length (mm)
unsized sized
[image:3.595.53.287.57.202.2] [image:3.595.308.542.545.687.2]From the slope of the lines, we obtain 78.7 and 76.9 GPa for the corrected modulus of unsized fibres silane sized fibres, respectively. It is not expected that the modulus of the sized and unsized fibres is different. This slight difference might be caused by the error in diameter measurements.
Fibre strength and distribution
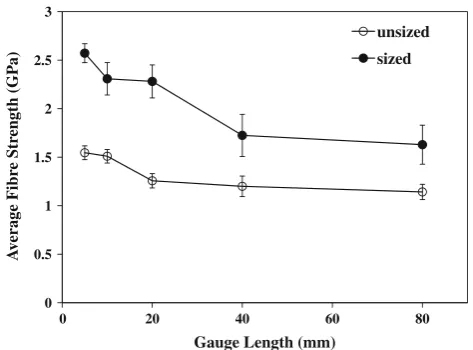
The results for the average fibre strength of the unsized and sized glass fibres are shown as a function of the sample gauge length in Fig.4. It can be seen that the measured average fibre strength is also highly dependent on the gauge length although this dependence follows a trend opposite to that observed for fibre modulus in Fig.2. At short gauge lengths the strength values are higher and decrease with an increase of the fibre length. It has been reported that the tensile strength of boron-free virgin E-glass fibres lies in the range from 3.1 to 3.8 GPa [2]. The reduced strength (below the pristine value) is generally considered to be a manifestation of surface flaws existing on the tested samples [20, 21]. Since both samples have experienced an identical production, mechanical handling, and environmental history before testing, the results in Fig.4are expected to indicate the influence of the silane on the retention of fibre strength during those processes.
Due to the nature of brittle solid, glass fibres normally exhibits a strength distribution, which needs to be analysed using probabilistic approaches. Among them is the fre-quently employed Weibull distribution, which was pio-neered in 1939 by Weibull [22]. Later in 1951 Weibull [23] applied this statistical treatment to fibre strength analysis. The approach is referred to as the weakest link theory, which assumes that a length L of chain-like structure is composed of Nlength l links in series (i.e. N=L/l) and fracture of the chain occurs when the weakest link fails. Based on this theory, when a fibres is under a stress less
and equal tor, the simplest function for the failure prob-ability,P, is expressed by
P¼1exp r r0
m
ð3Þ
where m and r0 are referred to as Weibull modulus and
characteristic strength. These parameters can be estimated by the maximum likelihood method. Furthermore, Eq.3
can be rearranged into
ln½lnð1PÞ ¼mlnðrÞ mlnð Þr0 ð4Þ
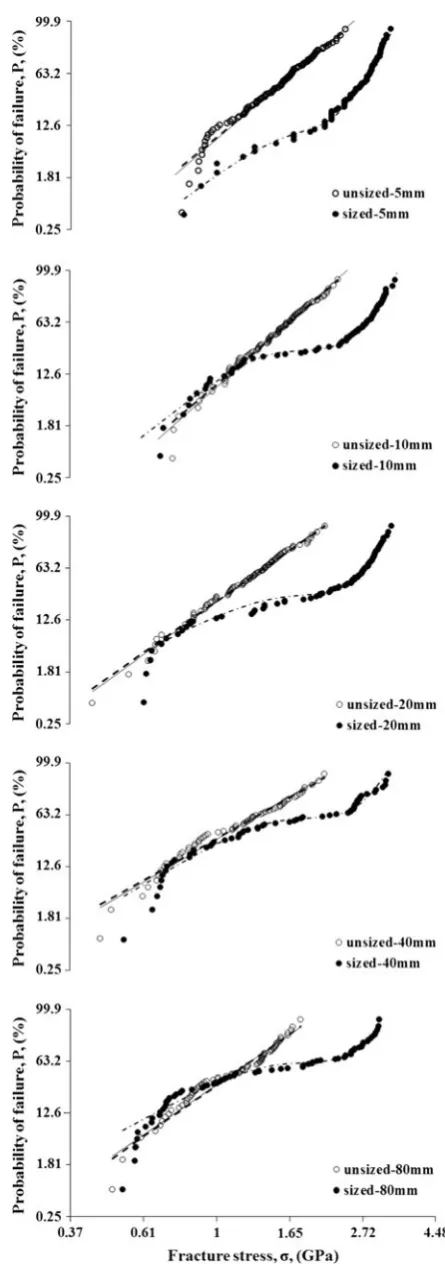
The parameter estimation may be carried out through a simple graphical method based on Eq.4. The results from Weibull analysis carried out in this study are presented according to ASTM C1239-07, which recommends that the Weibull plot (i.e. ln½lnð1PÞ vs. lnðrÞ plot) may be presented with the ordinate axis and abscissa labelled as probability of failure and failure stress, respectively. Figure5 displays these Weibull plots for both unsized and sized glass fibres at different gauge lengths. It can be observed again that the measured strength for unsized E-glass fibres is considerably lower than flaw free strength, 3.5 GPa, and the flaws seem to exist on virtually all the fibres. The Weibull plots obtained from the unsized fibre show a linear trend at each gauge length. This implies that the failure of unsized fibres is dominated by a single-flaw population, which may be described by the two-parameter Weibull distribution based on Eq.3. The parameter estimation was carried out using both the maximum likelihood method and the graphical method and the results were summarised in Table1. The results of the unsized fibre in Fig. 5were then fitted by the Weibull plots based on the estimated parameters. It was found that the experimental data from unsized fibres can be approximated well by the unimodal Weibull distribution except for the
y = (1.27x + 3.4)E-2 Ef= 78.7 GPa
y = (1.3x + 3.5)E-2 Ef= 76.9 GPa
0 0.2 0.4 0.6 0.8 1 1.2
0 20 40 60 80 100
Gauge Length/Modulus(mm/GP
a
)
Gauge Length (mm)
unsized sized
Fig. 3 Fibre modulus analysis at different gauge lengths (open circlesunsized,filled circlessized)
0 0.5 1 1.5 2 2.5 3
0 20 40 60 80
A
v
erage Fibr
e Str
ength (GP
a)
Gauge Length (mm)
unsized
sized
[image:4.595.307.544.57.232.2] [image:4.595.53.288.57.202.2]weakest fibres. Some authors choose to ignore such deviations, whereas others postulate these deviations as evidence of a more complex physical state of the test material. However, it has been recently demonstrated by Thomason [24] that the curvature in a standard Weibull plot at the low strength end of data was simply caused by the fact that there exists a minimum level of fibre strength, which is necessary to be able to isolate, prepare and test any fibre and fibres with strengths below this threshold level do not appear in the experimental data. The minimum threshold appears to be affected by the change in gauge length and this is probably because the damage and the extent of premature failure resulting from the imperfection of the single fibre technique are associated with gauge length of the sample. For example, the sample with shorter gauge length could be more sensitive to the misalignment between the fibre axis and the loading direction and may give a higher threshold level in the data. Despite this complexity, the values of 3–5 are obtained for Weibull modulus and agree with typical values found in the literature [16, 25]. These typical small values imply that both coefficient of variation and the magnitude of the dimension effect are quite high for the strength of unsized fibres. Weibull characteristic strength corresponds to a failure probability of 63.2 % and is found to decrease as the gauge length increases as shown in Table1. This is the manifestation of dimension effect on the strength of brittle glass fibres. The dimension effect on r0 has shifted the
Weibull plot towards lower stress as the gauge length increases as seen in Fig.5. It is more probable to encounter more severe flaws as the fibre length increases. Finally, it is obvious from Fig.5that for the linear Weibull plot there is an excellent agreement on estimated parameters between maximum likelihood method and the graphical method.
[image:5.595.303.526.51.686.2]The sized E-glass fibres, on the other hand, apparently show nonlinear Weibull plots at each gauge length in
Table 1 Summary of parameter estimation for unimodal Weibull distribution (unsized fibre)
Gauge length (mm) Maximum likelihood Linear regression
m r0(GPa) m r0(GPa)
5 4.6 1.69 4.8 1.69
10 4.8 1.65 5.0 1.64
20 3.9 1.39 4.1 1.38
40 3.2 1.34 3.3 1.34
80 3.9 1.26 3.9 1.26
Fig. 5 Weibull plots of E-glass fibres at different gauge lengths (open circles unsized, filled circles sized); dashed line maximum likelihood method, solid line linear regression method and dash dotted linefit based on bimodal Weibull distribution
[image:5.595.51.290.611.714.2]Fig.5. Nonlinear Weibull distribution has been reported for glass fibres and other brittle fibres [11,12,26–29] and usually related to multiple failure modes associated with different types of the flaw population in the material. This has led to an introduction of multimodal Weibull distri-bution, which is determined by multiple sets ofmandr0
and each pair of these parameters correspond to a type of flaw population that controls one type of fibre failure mode. It follows that for a bimodal Weibull distribution the failure probability may be expressed by
P¼1xexp r rA
0 mA
ð1xÞexp r rB
0 mB
ð5Þ
wherexis the fraction of failures due to type A flaws and mandr0with A or B scripts are the Weibull modulus and
characteristic strength for types A and B flaws, respec-tively. The Weibull plots in Fig.5 for the sized fibres at different gauge lengths were, therefore, fit by the bimodal Weibull distribution and the estimated parameters were listed in Table2. It was found that to achieve a reasonable overall fit it was preferable to ignore some lowest strength data in sized fibres since we now believe that the deviations related to these data points are likely to stem from the same reason described earlier for unsized fibres. It is seen in Fig.5 that the Weibull plots of sized fibres can be rea-sonably fit by the bimodal Weibull distribution, suggesting that failure of the sized fibres may be controlled by two exclusive types of flaw population, which are referred to be as types A and B hereafter. Comparing r0 of these two
types of flaws in Table2, it is clear that type A flaws are more severe than type B. Furthermore, type B flaws appear to be more homogeneous than type A as the former has a much higher Weibull modulus as seen in Table2. It is interesting to observe from Fig.5 that the high strength distribution (i.e. type B dominated distribution) gradually phases out as the fibre gauge length increases. On the contrary, the low strength distribution (i.e. type A domi-nated distribution) progressively form the majority of the Weibull plot as the fibre length increases. This dynamic
process during the length change is also reflected by the variation ofxwith the fibre length in Table2.
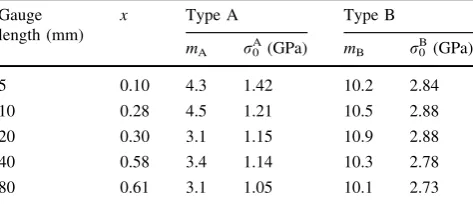
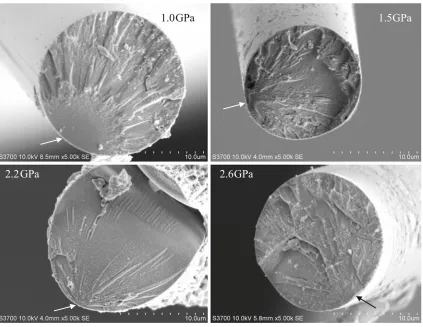
The comparison of Weibull plots in Fig.5 between unsized and sized fibres clearly shows that the silane, c-APS, has a significant effect on the retention of fibre strength. In the same Weibull coordinate, the Weibull plots of unsized fibre are all located on the left of those from sized fibre. It is quite impressive that a minute proportion of a silane couple agent at the fibre surface can actually have such a profound effect on the performance of the fibre. It is interesting to see that the type A distribution in sized fibres tends to overlap with the Weibull plots of unsized fibres, implying that the failure mode of unsized fibre is probably related to the type A flaws. It is important to point out that the difference in Weibull plots between unsized and sized fibres becomes less significant as the fibre gauge length increases. Therefore, it is reasonable to say that the effectiveness of strength improvement result-ing from the surface coatresult-ing is affected by the change in gauge length of the sample. This may be explained by the time dependence of silane adsorption on glass fibre surface and/or nonuniformity of silane distribution. Thomason and Adzima [9] conducted an investigation of the effect of a c-APS containing size adsorption on the properties of glass fibres and reinforced polyamide-6,6 and they showed that the sizing coverage on the fibre surface is unlikely to be fully achieved when the fibres are brought together to make the first contact. Consequently there is a possibility for the development of severe flaws at those bare spots through fibre–fibre interaction during the secondary fibre process-ing. This may account for type A flaws existing in both unsized and sized fibres. As the fibre length increases, it is more probable for sized fibres to encounter type A flaws and in turn the fibre strength is determined more frequently by type A flaws. In this sense, type B flaws may be regarded as the defects existing on the surface coated with silanes. It is noted that r0Bobtained from APS sized fibres
[image:6.595.52.289.83.185.2]in this study agrees well with the average strength, 2.83 GPa, of sized fibre with 94 % sizing coverage in [9], where the fibres were caught immediately after sizing application and had little possibility to develop type A flaws. Type B flaws may be created under the protection of dry-out silane layers and/or arise from type A flaws altered by the silane deposit on the surface. Figure6 shows the observation of fractured cross-sectional area of sized glass fibres with various tensile strengths. It appears that fibre fracture tends to originate from the fibre surface despite the different level of strength measured in this study. This supports the speculation that both types A and B flaws are located on the fibre surface. The above-discussion has been carried out from surface protection standpoint and assumed that glass fibres, before gathering into strands, are free from surface flaws. However, it is also possible that silanes may alter the Table 2 Summary of parameter estimation for bimodal Weibull
dis-tribution (sized fibre)
Gauge length (mm)
x Type A Type B
mA r0A(GPa) mB r0B(GPa)
5 0.10 4.3 1.42 10.2 2.84
10 0.28 4.5 1.21 10.5 2.88
20 0.30 3.1 1.15 10.9 2.88
40 0.58 3.4 1.14 10.3 2.78
flaws created after individual fibres are gathered. Accord-ing to the flaw healAccord-ing mechanism proposed by other authors, the aggregates of chemical species in the coating have to be small enough to effectively fill the flaw space [11,12,16]. Consequently, critical dimension of flaws was introduced to account for the observation of overlapping in high strength data of Weibull plots from unsized and sized fibres [11, 12, 16]. It appears that the Weibull plots obtained from this study show the opposite situation, in which the overlapping occurs at low strength distribution. This discrepancy suggests that the effect of the silane on the strength of commercially produced glass fibres may better be interpreted from the surface protection viewpoint.
Conclusions
The mechanical performance of commercially manufac-tured unsized and c-APS sized boron-free E-glass fibres were characterised by means of the single-fibre tensile test in the present study. Apparent fibre modulus was found highly dependent on the fibre length and was then corrected by taking into account the system compliance. The length
dependence was also observed for measured fibre strength due to the dimension effect. The average strength of sized fibre was found 40–80 % higher than the unsized at dif-ferent gauge lengths, indicating that silane plays an important role in fibre strength. Weibull analysis showed that failure mode in unsized glass fibres could be well described by a unimodal Weibull distribution. In contrast, sized glass fibres exhibited further levels of structure in Weibull plots, which could be reasonably fit by a more complex bimodal Weibull distribution. It was, therefore, suggested that the strength of sized fibres were controlled by two exclusive types of flaw population, namely types A and B. The comparison of Weibull plots from unsized and sized fibres further revealed that type A-controlled distri-bution tended to overlap with the Weibull distridistri-bution of unsized fibres and degree of the overlapping was observed to increase as the fibre length increased. This observation was supported by the increase of the values of the mixing parameter as gauge length of the sample increased. It was, therefore, concluded that the strength of unsized fibres was likely dominated by type A flaws, which might appeared at the bare surface while type B flaws might be related to the surface flaws existing on the glass surface coated with
1.0GPa
1.5GPa
2.2GPa
2.6GPa
[image:7.595.88.512.56.383.2]silane. The mixture ratio of these two types of flaws was found to be dependent on gauge length of the sample and in other words, effect of silane coupling agent on fibre strength is influenced by the change in gauge length of the sample. Based on the results from this study, it is suggested that the effect of silane coating on the strength improve-ment of commercially manufactured glass fibres may be better interpreted from the surface protection standpoint than the viewpoint of the flaw healing mechanism.
Acknowledgements The authors gratefully acknowledge the fund-ing from Engineerfund-ing and Physical Sciences Research Council (EP-SRC) through the project under the title of Towards Affordable, Closed-Loop Recyclable Future Low Carbon Vehicle Structures (TARF-LCV). The authors would also like to thank Owens Corning Vetrotex for providing the glass fibres used in this study. Special thanks are given to Advanced Materials Research Laboratory (AMRL) in the University of Strathclyde for the use of SEM. Finally, the authors would like to express their gratitude to the reviewer for the valuable advice on the improvement of this manuscript as well as suggestions for possible further work.
References
1. Kolesov YI, Kudryavtsev MY, Mikhailenko NY (2001) Glass Ceram 58(5):197. doi:10.1023/a:1012386814248
2. Wallenberger FT, Watson JC, Li H (2001) Glass fibres, vol 21. ASM handbook. ASM International, Material Park
3. Lowenstein KL (1993) The manufacturing technology of con-tinuous glass fibres. Elsevier, Amsterdam
4. Bartenev GM, Sidorov AB (1965) Glass Ceram 22(9):597 5. Otto WH (1955) J Am Ceram Soc 38(3):122. doi:10.1111/j.
1151-2916.1955.tb14588.x
6. Schmitz GK, Metcalfe AG (1966) Ind Eng Chem Prod Res Dev 5(1):1. doi:10.1021/i360017a001
7. Gupta PK (2002) In: Elices M, Llorca J (eds) Fiber fracture. Elsevier Science Ltd, Oxford, p 127
8. Thomason JL, Kalinka G (2001) Composites A 32(1):85. doi: 10.1016/s1359-835x(00)00122-6
9. Thomason JL, Adzima LJ (2001) Composites A 32(3–4):313. doi:10.1016/s1359-835x(00)00124-x
10. Reilly SP, Thomason JL (2010) In: Paper presented at the 14th European conference on composite materials, ECCM14, Buda-pest, Hungary
11. Zinck P, Pay MF, Rezakhanlou R, Gerard JF (1999) J Mater Sci 34(9):2121. doi:10.1023/A:1004572112470
12. Zinck P, Ma¨der E, Gerard JF (2001) J Mater Sci 36(21):5245. doi:10.1023/A:1012410315601
13. Otto WH (1961) J Am Ceram Soc 44(2):68. doi:10.1111/j. 1151-2916.1961.tb15352.x
14. Sakka S (1957) Bull Inst Chem Res Kyoto Univ 34(6):316 15. Feih S, Boiocchi E, Mathys G, Mathys Z, Gibson AG, Mouritz
AP (2011) Composites B 42(3):350. doi:10.1016/j.compositesb. 2010.12.020
16. Feih S, Thraner A, Lilholt H (2005) J Mater Sci 40(7):1615. doi: 10.1007/s10853-005-0661-4
17. Thomason JL (2007) Polym Compos 28(3):331. doi:10.1002/pc. 20260
18. Thomason JL (1999) Compos Sci Technol 59(16):2315. doi: 10.1016/s0266-3538(99)00083-4
19. Thomason JL (1995) Composites 26(7):477. doi: 10.1016/0010-4361(95)96805-g
20. Metcalfe AG, Schmitz GK (1964) Proc ASTM 64:1075 21. Schmitz GK, Metcalfe AG (1965) In: 20th Anniversary technical
conference, 1965. The Society of the Plastics Industry, Wash-ington, DC
22. Weibull W (1939) A statistical theory of the strength of materials. Handlingar, Royal Swedish Academy of Engineering Sciences 151
23. Weibull W (1951) J Appl Mech 18:293
24. Thomason JL (2012) Compos Sci Technol (Submitted) 25. Andersons J, Joffe R, Hojo M, Ochiai S (2002) Compos Sci
Technol 62(1):131. doi:10.1016/s0266-3538(01)00182-8 26. Beetz CP Jr (1982) Fibre Sci Technol 16(1):45. doi:
10.1016/0015-0568(82)90015-x
27. Beetz CP (1982) Fibre Sci Technol 16(2):81. doi:10.1016/ 0015-0568(82)90027-6
28. Zinck P, Ge´rard JF, Wagner HD (2002) Eng Fract Mech 69(9):1049. doi:10.1016/s0013-7944(01)00121-7