MREAP is led by the University of Strathclyde and funded by the Scottish Government For more information visit: http://www.strath.ac.uk/eee/energymalawi/
Contact: Peter Dauenhauer, MREAP Programme Lead, [email protected]
Process Evaluation of
Community Energy Development
Programme Projects
Dedicated Study
MREAP Strand: Institutional Support Programme (ISP)
Produced By: Catherine Currie, Gill Davies, Enrique W. Young, IOD PARC
Received: April 2015
Abstract: This report sets out the findings, conclusions and recommendations of a Process Evaluation, conducted between January and March 2015, of the Community Energy Development Programme (CEDP) projects as part of the Malawi Renewable Energy Acceleration Programme (MREAP). It was commissioned by the Scottish Government (SG) as a product of the Institutional Support Programme Component (ISP) of
MREAP. Its main purpose is to assess what has been delivered, how this has been achieved and to compile learning from the process for policy and future projects. The agreed scope for the process evaluation was the portfolio of 46 CEDP projects implemented across the 3 regions of Malawi and the relevant processes and systems in place to design, implement and manage these projects. Due
consideration was also given to framing the scope of the evaluation through the choice of evaluation questions and the feasibility of what was possible.
Malawi Renewable Energy
Acceleration Programme (MREAP)
Process Evaluation of Community Energy
Development Programme Projects
Malawi Renewable Energy Acceleration Programme
Final – April 2015
Prepared for // University of Strathclyde
Date //April 2015
Contents
Acknowledgements i
Executive Summary iii
Background iii
Introduction 1
Methodology 4
Assessing Quality of Evidence 6
Evaluation Process and workplan 7
Evaluation Matrix 8
Data Limitations and Challenges 11
Findings 20
Relevance 20
Results 27
Effectiveness 42
Efficiency 51
Sustainability 59
Innovation and Replicability 70
Summary Conclusions 71
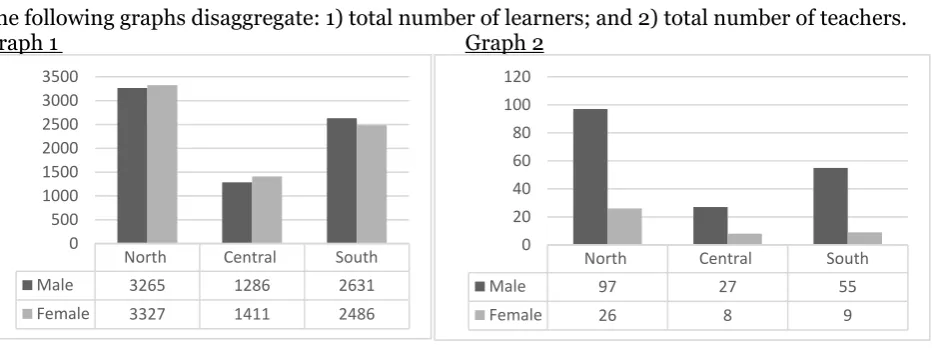
Graph 1: Total number of learners p30
Graph 2: Total number of teachers p30
Graph 3: School population between 2008 and 2014 p34
Graph 4: School population between 2008 and 2014 by gender p35
Graph 5: Total number of exams sat vs. total number failed p36
Graph 6: Exam failure rate p36
Graph 7: Total number of CEDP target learners achieving secondary school entrance p37
Graph 8: Household expenditure on electricity since CEDP intervention p40
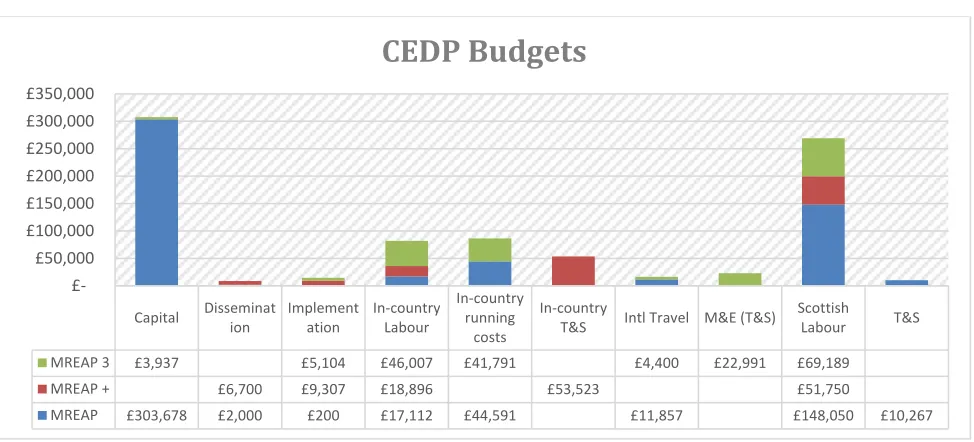
Graph 9: CEDP budgets p51
Table 1: Final agreed sample of CEDP projects for process evaluation p5
Table 2: Criteria to assess quality of evidence answering evaluation questions p6
Table 3: Evaluation Matrix p9-10
Table 4: Data analysis descriptions with limitations p14
Table 5: M&L Indicator set p15-18
Table 6: Number and type of projects across region p21
Table 7: Total number of beneficiaries by type and gender p30
Table 8: CEDP related results in MREAP logframe p43
Table 9: Breakdown of major proportions of money from MREAP to CEDP p51
Table 10: Light touch assessment of CEDP against 3 Es Value for Money Framework p56
Table 11: Sustainability Factor Analysis p66-68
Table 12: Risk Analysis p69
Figure 1: Timeline of CEDP and ISP workstream p3
Figure 2: MREAP programmatic structures with outcomes p11
i
Acknowledgements
IOD PARC would like to thank the MREAP partners of Strathclyde University, Community Energy Malawi and Community Energy Scotland for their comments on early drafts. We would also like to pass on our gratitude to the communities and individuals who gave their time for the project level evaluations.
The Process Evaluation was written by IOD PARC and reflects the opinions of the author only.
Dedication
ii
Acronyms
CBO Community Based Organisation
CEDP Community Energy Development Programme
CEM Community Energy Malawi
CES Community Energy Scotland
DC District Commissioner
DEC Development Executive Committee
DEM District Education Manager
DEP District Education Plan
DO Development Officer
EMC Energy Management Committee
GOM Government of Malawi
HH Household
ISP Institutional Support Programme
M&E Monitoring and Evaluation
M&L Framework Monitoring and Learning Framework
MREAP Malawi Renewable Energy Acceleration Programme
MuREA Mulanje Renewable Energy Association
NESP National Education Sector Plan
OECD Organisation for Economic Cooperation & Development
O&M Operations and Maintenance
PEA Primary Education Adviser
PSG Programme Steering Group
PV Photo Voltaic
RE Renewable Energy
RET Renewable Energy Technology
SG Scottish Government
T&S Travel and Subsistence
iii
Executive Summary
Background
This report sets out the findings, conclusions and recommendations of a Process Evaluation, conducted between January and March 2015, of the Community Energy Development Programme (CEDP) projects as part of the Malawi Renewable Energy Acceleration Programme (MREAP). It was commissioned by the Scottish
Government (SG) as a product of the Institutional Support Programme Component (ISP) of MREAP. Its main purpose is to assess what has been delivered, how this has been achieved and to compile learning from the process for policy and future projects.
The agreed scope for the process evaluation was the portfolio of 46 CEDP projects implemented across the 3 regions of Malawi and the relevant processes and systems in place to design, implement and manage these projects. Due consideration was also given to framing the scope of the evaluation through the choice of evaluation questions and the feasibility of what was possible.
The primary audiences of this process evaluation are the SG, the Energy Department of the Government of Malawi, the MREAP partners of CES, University of Strathclyde, Sgurr Energy, the Strategic Energy Partners in Malawi [Polytechnic of Blantyre, Mzuzu University, Mulanje Renewable Energy Association (MuREA),
Renewable Energy Malawi or RENAMA and Concern Universal] as well as the newly established Community Energy Malawi (CEM).
Limitations and Bias
It is important to note that the evaluation team is not an impartial outsider. It is an ‘insider’ to MREAP and as such comes with its own set of bias and preconceptions that it may be unaware of. To limit the impact of this during the process evaluation, the ToR did not include questions on: management and partnership
arrangements, an evaluation of ISP activities in relation to CEDP, an analysis of the appropriateness of the Monitoring and Learning framework or an analysis of CEDP reports (financial and narrative) to Strathclyde University.
In a short programme like MREAP (3 years long), the time dedicated to community facilitation means that there is limited ability to provide data through monitoring and reporting on the subsequent livelihood and/or welfare gains. In addition, the relative formality of developing an Monitoring and Evaluation (M&E) system that would enable ‘proof of concept’ as well as enumerate scope and scale of benefits for a range of different individuals and households is a challenge in this context. CES and the Development Officers were focused on the difficult technical challenges as well as the community facilitation such that the additional requirements for M&E were, as often happens, seen as secondary in nature. A fuller account of limitations and bias can be read in the methodology section.
Evaluation Criteria
The evaluation team focused on OECD DAC criteria of relevance, effectiveness, efficiency, sustainability and substituted impact with results (6 months since installation). Given the interest in learning from MREAP, a short section on innovation and replication was also included.
Conclusions
Summary conclusions are now presented by evaluation criteria.
Relevance
iv However, it appears that the process of engaging with District level officials in relevant sectors (health,
education, social welfare) has been unsystematic. Where Primary Education Advisers (PEA) have been engaged there has been a modest amount of influence on them, which in turn has supported an increased awareness of the benefits of energy.
The lighting that CEDP solar PV installations have provided at schools has contributed to improvements in teacher wellbeing, as set out in the Teacher Retention Survey and Impact Report. Teachers consistently reported being happier to stay at the school they were deployed to because of the lighting and improved communications (charging of mobile phones locally).
The capacity building approach of CEDP focused on building the business skills of the Community Based Organisation (CBO). It was ambitious given the low capacity of the CBOs and the high levels of illiteracy. The CBOs did however play a legitimate and consistent role in building a strong sense of community ownership across the projects visited. Arguably however a less diverse portfolio would have freed up more time for increased community support and training.
Efficiency
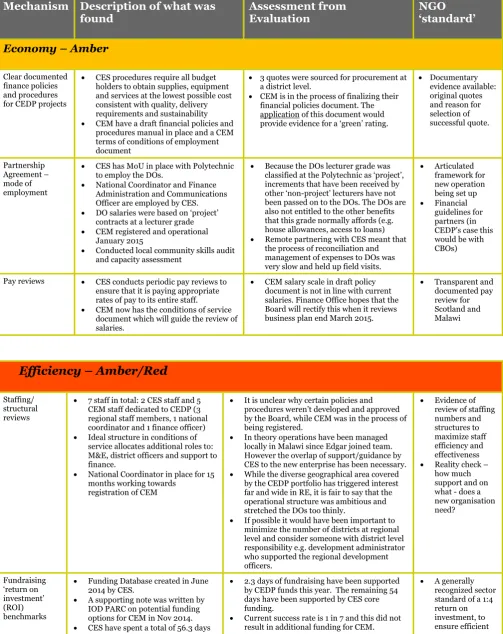
At the project level an analysis of lifecycle cost modelling suggested that 1 in 3 projects would meet its 9 month target for income generation. Concerns remain over gaps in evidence found in the business plans and through the 3 Es Value for Money assessment. It therefore seems a fair assessment to state that each project requires ongoing financial stewardship and accountability to increase efficiency.
The operational set-up and management of CEDP has changed over the course of 3 years. The push for the creation of CEM was to ensure better efficiency, sustainability and value for money of CEDP. So, the delayed registration of CEM did result in inefficiencies. Unfortunately, the current structure of the financial data does not allow for more detailed analysis at this time.
Sustainability
Key factors demonstrating programme sustainability across the CEDP portfolio and approach are: strong quality control through MERA accredited contractors and inspectors; clear roles and responsibilities between CBO and Energy Management Committee (EMC); strong emphasis from the start on building and sustaining community ownership; conducting business planning and starting small social enterprises (solar lantern sales and/or cookstove production) to generate income for O&M of main system; and crucially that all social enterprises are generating income at 6 months.
The analysis of system sustainability during the evaluation found that 93% of the total number of systems reviewed are functional. Questions remain however over the readiness of the local markets for the systems but at the household level people are already benefiting from increased lighting and improved energy efficiency.
• The cookstove producer groups’ sustainability will depend on increasing adoption rates and rolling out appropriate marketing.
• Currently there are problems because some of the community members are failing to pay off their outstanding balances for the lanterns. Adopting a commercial model for CBOs takes time for people to accept, many people thought the lanterns were a donation. It also appears that
management of the solar lanterns (i.e. social enterprise) may be best done by a local entrepreneur in the community.
However, it is the overwhelming vulnerability of CEM, with no core funding at present to take it past March 2015, which undermines all the gains in capital (as per sustainable livelihoods model). If core funding is not found then the analysis of lifecycle costs suggests that 2 out of 3 projects could fail before 3 years, all factors remaining equal.
Effectiveness
v ownership. The key finding from a review of documentation, key informant interviews and focus groups
discussions is however that there were three major risks associated with CES’ approach that had to be mitigated. Firstly, CES’ inexperience in planning and managing in a development context arguably led to too many sites being chosen without any1 planning and/or management of the amount of total effort that would be required to work over the large geographical area for the budget and time available. The result for CES was much higher support costs than anticipated. These unanticipated costs were borne by CES solely.
The second risk was at the project level. Arguably, a lack of planning and management could contribute to a reduction in the sustainability of project outputs and achievement of project outcomes. More time will need to pass before it is clear whether or not this is the case. However, it is the case that Development Officers were not able to spend as much time as required with communities because they were travelling so often between sites.
The final risk was internally to MREAP from CEDP that the DOs and CES would not have the necessary time to dedicate to monitoring and supporting the roll out of tools associated with collecting and storing data. This was also the case and resulted in additional time being spent by IOD PARC and Strathclyde University to ensure data was collected and stored.
In addition, at 6 months it is arguably too early to assess which interventions are most effective and whether CEDP projects and the CEDP approach are contributing to development outcomes. However, an analysis of different types of capital (as expressed by the Sustainable Livelihoods Framework in terms of human, natural, financial, social and physical) points to comprehensive changes in human and social capital. CEDP projects have contributed to building human capital improvements in terms of health, education, knowledge and skills. Solar PV installations in educational institutions and solar water pumps have produced the greatest increase in social capital through improvements in trust, decision making and leadership. Solar PV installations and solar lanterns also increased the network and connection assets through mobile phone charging facilities. Cookstove projects singularly contributed to the increase in natural assets of forestry and both solar lanterns and
cookstoves provided immediate benefits to levels of financial capital in terms of savings and access to credit.
Results
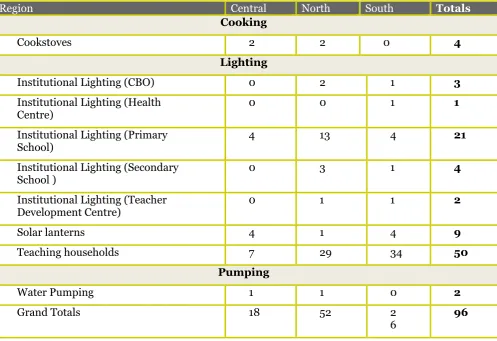
The CEPD portfolio is made up of 46 projects across 12 CBOs located in 12 districts across all regions of Malawi. The total number of beneficiaries of CEDP projects is 20,439. A total of 378 healthy babies were born at the single health clinic monitored by CEDP. CEDP has modestly supported the country’s push for improved
cookstoves nationwide by setting up producer groups and selling 325 cookstoves in the first 6 months. A total of 9 solar lantern social enterprises were set up by CBOs and sold 465 solar lanterns. All CBOs had generated income by 6 months and patterns in energy expenditure validated users paying for electricity and generating savings from solar lantern adoption. For educational attainment, the overall trend is that exam performance is very gradually improving in CEDP-targeted schools and that lighting does make a difference to a teacher’s job satisfaction.
Innovation and replicability
Two key innovative features of CEDP were: i) CBOs managing social enterprises; and, ii) the model of community engagement which has a high degree of community agency and subsidiarity.
At this early stage (6 months post commissioning of systems) it is possible to say that there is increased awareness of the benefits of RE at the community level and using the CBO model to community engagement does appear to provide improvements in social capital at the community level.
Recommendations
The following recommendations are set out to specific stakeholders of the Renewable Energy sector in Malawi and are divided into two time periods: coming year (April to end December 2015) and 2016 onwards.
vi In the coming year, the following recommendations are made to Community Energy Malawi:
1. Rationalise the project portfolio to a manageable geography and size given restricted funds. Conduct a full handover to District of projects that are not included in new portfolio. Officially handover the cookstove projects to the National Taskforce on Cookstoves.
2. Work with the Primary Education Advisers and District Education Managers to monitor and report on change against the Monitoring & Learning Framework at one year from installation for all Community Energy Development Programme projects. Actively include District Executive Committee in the follow up with projects. Invite them to go on monitoring visits, explore ways of including Education Officers on trips to field.
3. Update the training needs assessments of the communities (Community Based Organisation and Energy Management Committee). Where are they now? What do they need? Place a strong emphasis on financial management and develop lifecycle costing models for all projects. 4. Train community members in technical repairs. Simple short term steps can be taken to train
community members on how to use basic equipment like a voltmeter or ammeter so that they can test batteries before buying them. The lack of basic technical skills is a common gap in technology transfer projects that ultimately, if not dealt with, leads to a high level of system failure in the short term.
In the coming year, the following recommendations are made to the Government of Malawi’s Department of Energy:
1. Support Community Energy Malawi to secure core funding so that the investment made by the Scottish Government is sustained. Use Community Energy Malawi as the voice of the community and the glue between the community and the district to learn about how off-grid community managed Renewable Energy projects can be included to increase the proportion of rural
households with access to modern energy services. A first step would be asking Community Energy Malawi to manage the community consultation process for the new Energy Plan.
2. Fast-track the appointment of District Energy Officers to monitor and support the new Energy Plan and national policy directives.
3. Consider setting up a National Solar Lantern project that piggy backs on National Cookstove Programme structure. Research the benefits of ‘clustering’ the two technologies together. 4. Learn from the Development Officers use of MERA accredited contractors and set a national
standard for all Renewable Energy Technology installations to use an accredited list and then use MERA has a means of inspection post-installation.
5. Ask MERA to report on number and quality of systems inspected. Begin to develop national level standards for Renewable Energy Technology components.
In the coming year, the following recommendations are made to the Scottish Government:
1. Draw out the lessons from this process evaluation and consider how they can be applied to the current portfolio of projects in Malawi;
2. Identify resources and develop a strategy/plan for the dissemination of key learning outputs from MREAP (e.g. process evaluation, Solar PV Sustainability Study, Energy Enables Review Paper). Be proactive in the dissemination of this process evaluation.
3. Actively and transparently communicate the findings of this evaluation to donors (e.g. EU, UNDP and UK Aid) who have previously expressed an interest in learning from MREAP.
vii In the coming year, the following recommendation is made to Malawi’s donor partners (UK AID, UNDP, World Bank, JICA) and other external donors interested in the Renewable Energy sector in Malawi:
1. Consider core funding Community Energy Malawi to provide a platform that can sustain the CEDP project portfolio and through which the community can voice their needs with regards to access to modern energy services and energy efficiency (cooking).
In the coming year, the following recommendations are made to research institutions and/or INGOs in the energy sector in Malawi:
1. Provide finance to go back and monitor Primary School Leaving Certificate results in schools with solar pv systems to generate evidence of whether there is an impact on results and the factors that contribute to this (improved quality and relevance of education through improved teacher retention, improved classroom facilities etc)
2. Generate more data on teacher retention and provide a richer picture of the nature of teaching in rural Malawi. What are the factors that are critical to retaining staff and meeting DEPs? Consider repeating the Teacher Retention Survey in October 2015.
From 2016 onwards, the following recommendation is made to the Scottish Government:
1
Introduction
Background
Purpose, scope and audience
This report sets out the findings, conclusions and recommendations of a Process Evaluation conducted between January and March 2015 of the Community Energy Development Programme (CEDP) projects across Malawi as part of the Malawi Renewable Energy Acceleration Programme (MREAP). It was commissioned by the Scottish Government (SG) as a product of the Institutional Support Programme Component (ISP) of MREAP. Its main purpose is to assess what has been delivered, how this has been achieved and to compile learning from the process for policy and future projects.
The objectives of the MREAP process evaluation are to:
1. Identify what funding was spent on? What were short and longer term outputs by policy/activity, and identify any initial outcomes as appropriate.
2. Identify common factors that appear to have supported or hindered success and draw out commonalities across projects or community types?
3. Explore the role played by community engagement in the projects.
4. Investigate how prepared communities are for ongoing O&M as a result of community facilitation role played by DOs of CEM.
5. Make recommendations for future studies on projects.
The agreed scope for the process evaluation was the portfolio of 46 CEDP projects implemented across the 3 regions of Malawi and the relevant processes and systems in place to design, implement and manage these projects. The evaluation team used the 6 monthly regional monitoring reports, the data from the Monitoring and Learning (M&L) Framework and conducted a field trip to evaluate a sample of CEDP projects. In addition, it was necessary to review in details all project documentation kept on the CEDP dropbox. Additional requests for documentation and evidence were made as necessary.
The process evaluation methodology, set out in detail in the methodology section, was to assess the projects against the five standard criteria for evaluating development assistance: relevance,
effectiveness (including evidence of change), efficiency, sustainability and innovation/replication. In addition, the evaluator included a value for money analysis within the efficiency section.
The primary audience of this process evaluation is the SG, the Energy Department of the Government of Malawi, the MREAP partners of CES, University of Strathclyde, Sgurr Energy, the Strategic Energy Partners in Malawi [Polytechnic of Blantyre, Mzuzu University, Mulanje Renewable Energy
Association (MuREA), Renewable Energy Malawi or RENAMA and Concern Universal] as well as the newly established Community Energy Malawi (CEM).
Limitations and Bias
It is important to note that the evaluation team is not an impartial outsider. It is an ‘insider’ to MREAP and as such comes with its own set of bias and preconceptions that it may be unaware of. To limit the impact of this during the process evaluation, the ToR did not include questions on:
analysis of the appropriateness of the M&L framework or an analysis of CEDP reports (financial and narrative) to Strathclyde University.
In addition, the relative formality of developing an M&E system that would enable ‘proof of concept’ as well as enumerate scope and scale of benefits for a range of different individuals and households is a challenge in this context. CES and the DOs were focused on the difficult technical challenges as well as the community facilitation such that the additional requirements for M&E were, as often happens, seen as secondary in nature. A fuller account of limitations and bias can be read in the methodology section.
Overview of MREAP
In May 2011, the SG funded the ‘University of Strathclyde - Supporting Community Energy Development in Malawi’1 hereinafter referred to as the Scoping Study. The Scoping Study further developed a picture of community renewable energy projects following the Community Rural Electrification and Development Project (CRED) implemented by the University of Strathclyde, also funded by the SG.2 A number of stakeholders from the Malawian energy sector identified significant gaps in knowledge around off-grid energy management in the country. In particular, it was noted that there were a reasonable amount and variety of small-scale interventions being undertaken – for example solar photo voltaic (PV), hydropower, energy efficient cookers – but that there was no clear or shared understanding around the relative merits of each approach. Moreover, there was no overall national ‘inventory’ of off-grid energy installations in existence – it was felt that the absence of such an inventory could be weakening regulatory oversight, and increased the risk of a fragmented, inefficient off-grid ‘sector’.
In early February 2012 the University of Strathclyde was commissioned by the SG to undertake MREAP. MREAP is an Action Research Grant made up of four separate work-streams and to date is the single largest grant awarded by SG. IOD PARC is sub-contracted to deliver the Institutional
Support Programme (ISP), which included conducting the initial Evaluation and the pilot inventory in 2012. MREAP was due to close at the end of March 2014. For further information on the programme, please visit http://www.strath.ac.uk/eee/energymalawi/ .
MREAP Extension
A timeline has been outlined (figure 1) on the next page to demonstrate how the different elements of ISP and CEDP’s workstreams came together between January 2012 and the end of March 2015. An extension to MREAP was agreed by the SG in January 2014, ‘to continue and build on the work already completed under the programme, with a particular focus on community support to ensure sustainability of the programme in the longer term.3’
1 http://www.scotland.gov.uk/Topics/International/int-dev/strathclydeuniscopingstud
Figure 1: Timeline of CEDP and ISP workstreams
Methodology
Framing the evaluation
In all types of evaluation, it is important to ascertain the intended primary and secondary users and uses of the
evaluation. The primary users of this evaluation are the SG and the GoM. They wish to use the evaluation to learn from MREAP and share these key insights with other donor partners. There are also many secondary users such as CEM, Concern Universal, Practical Action, MuREA and other local and international NGOs present in Malawi who are working on energy at the community level. Other uses include building on the indicators and data that CEDP have generated to create a bigger evidence base for what works in certain districts across Malawi.
Due consideration was also given to framing the scope of the evaluation through the choice of evaluation questions and the feasibility of what was possible.
The three major considerations for this evaluation were:
• What evidence would be available at 6 months from which to judge change (positive or otherwise);
• Given the diversity of the CEDP portfolio, what level of evaluative thinking would be possible; and finally,
• How could the evaluation itself generate data that could validate data from the M&L Framework?
Why a Process Evaluation?
At the end of a programme, it is accepted practice to carry out an evaluation that focuses on
achievement of outcomes. There is, depending on the evaluation team, generally less focus on process. Given the 3 major considerations above and the expectations that the results would be too early to point to any definitive change, a process evaluation, or an evaluation that would help
stakeholders see how CEDP had achieved what it had was just as important as looking at the
effectiveness of the programme.
By choosing a process evaluation, the evaluation team was able to frame an evaluation that also considered: the structures of CEDP and how CEDP developed. In other words, an evaluation that documented the programme’s process of implementation and CEDP’s capacity to deliver on the outcome. Given the focus of the evaluation was primarily on learning, it was agreed that a process evaluation was more likely to deliver evidence to enable programme replication where/if appropriate.
Evaluation Criteria
It is standard practice when evaluating development aid to consider the Organisation for Economic Cooperation and Development (OECD) -Development Assistance Committee (DAC) criteria which were originally set out in Paris in 1991. Normally this involves evaluating 5 criteria: relevance,
5 effectiveness, impact, efficiency and sustainability. It is considered good practice to use and adapt these criteria to each evaluation.
The Evaluation Team, as part of the TOR, focused on: relevance, effectiveness, efficiency and
sustainability. Given the timeframe of 6 months, impact was not included instead a section of results – evidence of change has been included. Furthermore, given the interest in learning from MREAP a section on innovation and replication was also included.
Terms of Reference
An important step in all evaluations is to design and seek agreement from all key stakeholders on a terms of reference. An initial draft ToR was developed by the ISP team leader and circulated within IOD PARC for comment in early December 2014. Early January 2015, an IOD PARC meeting was held to finalise the draft ToR for comment, taking into consideration comments from Finance, Quality Assurance and Research. Then, a draft ToR was submitted mid-January to Strathclyde University, as the team lead on MREAP and CES (including CEM staff) for comment. Comments were received and incorporated into a final draft. This draft was then shared with the SG. In February, a report template and evaluation guidance (financial health check, district level focus group guide, interview guide, district profile proforma) were developed to facilitate the collection and aggregation of data across the various districts during the field visit. A functionality system health check proforma was developed by Peter Dauenhauer at Strathclyde. Please see Annex 3 for the final ToR.
Sample of projects
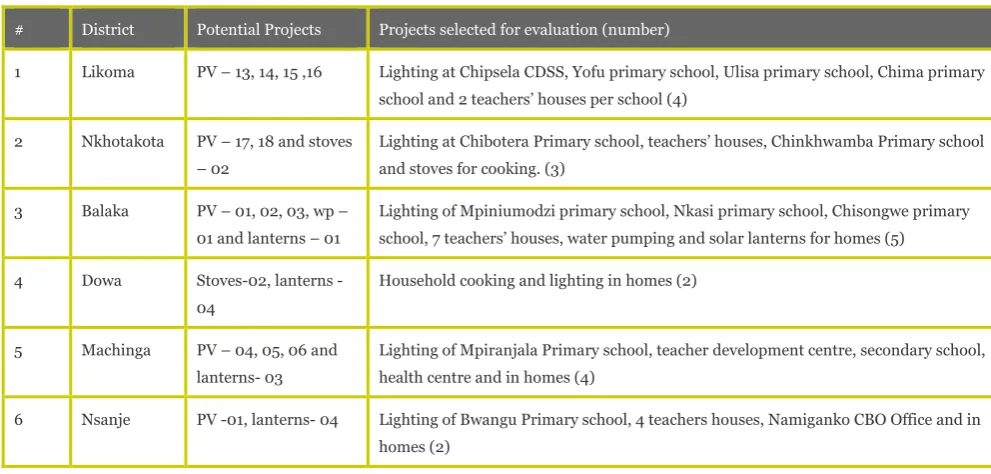
The majority of CEDP projects are in remote locations, however some require even greater distances to be covered e.g. Chitipa and Nsanje. It was agreed that the minimum sample of projects (see table 1 below) to be visited would include: 9 or 20% of the total portfolio of projects, that these must be evenly spread out over the 3 regions, include a minimum of 6 CBOs and a diversity of RET
[image:16.595.48.544.508.745.2]applications. The final criteria for selection were: i) District with more than one project accessible during rainy season; ii) CBO office near to project; iii) Able to visit the District Offices; and finally, iv) able to meet with Group Village head and /or Village Head.
Table 1: Final agreed sample of CEDP projects for process evaluation
# District Potential Projects Projects selected for evaluation (number)
1 Likoma PV – 13, 14, 15 ,16 Lighting at Chipsela CDSS, Yofu primary school, Ulisa primary school, Chima primary school and 2 teachers’ houses per school (4)
2 Nkhotakota PV – 17, 18 and stoves – 02
Lighting at Chibotera Primary school, teachers’ houses, Chinkhwamba Primary school and stoves for cooking. (3)
3 Balaka PV – 01, 02, 03, wp – 01 and lanterns – 01
Lighting of Mpiniumodzi primary school, Nkasi primary school, Chisongwe primary school, 7 teachers’ houses, water pumping and solar lanterns for homes (5)
4 Dowa Stoves02, lanterns -04
Household cooking and lighting in homes (2)
5 Machinga PV – 04, 05, 06 and lanterns- 03
Lighting of Mpiranjala Primary school, teacher development centre, secondary school, health centre and in homes (4)
6 Nsanje PV -01, lanterns- 04 Lighting of Bwangu Primary school, 4 teachers houses, Namiganko CBO Office and in homes (2)
business case, risk matrix, appraisal, quotes), as well as the 6 monthly regional monitoring reports and the data collected in the M&L database.
Evaluation Matrix
The purpose of an evaluation matrix is to set out the questions that will be answered against the sources of information and tools/ methodologies used to gather evidence (both primary and secondary data).
The Evaluation matrix for this Process Evaluation can be found on pages 9 - 10. It clearly sets out what primary data the evaluation team used to answer the evaluation questions and where the data came from. For the purpose of this evaluation, the quality of evidence against each evaluation question has also been included. A discussion of the limitations of the data analysis is in the sub-section below.
Assessing Quality of Evidence
The process evaluation gathered a range of evidence from a variety of sources in different districts during the field visit. The evaluation team was also dependent on CEDP’s documentation and knowledge management to be able to analyse certain issues and validate other findings. The
evaluation team did not expect the quality of the evidence within and between inquiry streams (e.g. focus group discussion results from different types of projects in different districts) to necessarily be consistent given the diversity of projects present. And, in addition, it was unclear what documentation was available that would tell the story of the CEDP process. Therefore it was important to find a way of drawing attention to the quality of evidence available. Table 2 below outlines the criteria used.
Please note that the ratings refer to the quality of evidence and not the quality of CEDP projects.
Table 2: Criteria to assess the Quality of Evidence answering evaluation questions
Rating of Evidence Description
Robust (R) Strong and robust evidence from different sources which is mutually supportive of the
conclusions that are drawn. Evidence is widespread across the operational contexts.
Supportive (S) Evidence from different sources is mutually supportive of the conclusions that are drawn.
Whilst weaknesses may be seen in some areas the ‘density’ of evidence provides confidence
in the conclusions.
Indicative (I) Evidence from different sources does not always agree. There are general weaknesses and
gaps and therefore the conclusions that are drawn should be seen as provisional and perhaps used as an indication that, if the topic is fundamental to an understanding of the modality that further targeted research work is required.
Poor (P) Limited evidence available from any source. Main evidence limited to ‘hearsay’ and very
localised experiences. The main conclusions that are possible in this situation would be that further work may well be required in these areas, especially if significant claims to operational effectiveness are required.
No evidence (N) Too early for M&L Framework to provide conclusive results and/or for there to be validation in
Evaluation Process and workplan
To clarify, supplement and triangulate information identified from the document review the evaluator conducted key informant interviews and focus groups while in country. A full breakdown can be found in Annex 2. In total over 100 people contributed to this process evaluation.
Once data gathering was finalised, the evaluator worked to compile findings under the key evaluation criteria. On the 11th February 2014, interviews were held with CES project manager Georgy Davis and Sarah Jones (who developed the CEM toolkit and provided support to DOs) to further inform the analysis. These emerging findings were then the topic of a day long workshop on Monday 2nd March 2015 with MREAP project manager Peter Dauenhauer to support efforts to fill gaps and analyse the collated data further. Final interviews were held with Peter Dauenhauer 10th March and Damien Frame (MREAP project manager 2012 - 2014) on 11th March. A zero draft of the report was then shared on 13th March with CES and Strathclyde University in advance of the PSG to give them opportunity to comment prior to emerging findings being shared for discussion at the PSG.
The PSG, held in Lilongwe, Malawi on March 18th 2015, represented an opportunity to obtain
comments on the findings, conclusions and recommendations from all of MREAP’s SEPs, CES, Sgurr Energy as well as the Ministry of Finance, Ministry of Energy from the Government of Malawi and the Head of the International Development Department from the Scottish Government. The feedback was then incorporated into a first draft report which was officially circulated amongst MREAP partners on March 22nd for final comment. At this point, the report was also fully quality assured by Sheelagh O’Reilly, a director of IOD PARC.
In summary the process followed 7 key steps.
Step 1: Terms of Reference drafting and site selection, December 2014 – January 2015
Early and participative development of the ToR and selection of appropriate sample of projects. Finalisation of evaluation guidance, report template and evaluation framework.
Step 2: Enquiry field visit & document review, 1st to 8th February 2015
Two evaluators conducted field trips to the North and Centre, and to the Centre and South. Each evaluator produced a standard set of documents after each project visit so that a consistent set of data was generated. Primary data was collected and verified on systems performance, community benefits, and community challenges at village, community and district level.
The evaluation team reviewed all information in the dropbox of relevance to the evaluation. It also requested additional documentation on costs and expenditure from CEM as well as more detail on what training was conducted and when from the DOs. The evaluation team also requested a summary of expenditure from Strathclyde (on suggestion and approval by CES) of CEDP in order to analyse data for the efficiency section of the report.
The regional 6 monthly monitoring reports were used to validate and verify primary data and to fill gaps in information.
Stage 3: Analysis, 2nd – 9th March 2015
The team drew together their findings against each question/objective and analysed the main themes emerging from their evidence.
Stage 4: Write up zero draft & assess quality of evidence, 9th to 13th March
An early (pre-first draft) report was shared with internal partners to facilitate greater sharing of information and evidence where necessary.
Stage 5: PSG meeting, feedback and first draft released for comment, 22nd March 2015
The PSG provided an ideal platform to feedback to CEM and wider stakeholders the main findings of the evaluation. Comments were incorporated and a first draft was sent out again to a wider MREAP stakeholder group (SEP partners and CEM) for comment.
Stage 6: Quality Assurance, 25th – 27th March 2015
The first draft of the process evaluation was shared with Sheelagh O’Reilly who provided a very comprehensive and critical QA of the report.
Stage 7: Final Draft of Process Evaluation Report, 30th March to 1st April.
This involved incorporating the comments from all MREAP stakeholders, including the QA comments and submitting a second and final draft to Strathclyde University for submission to SG.
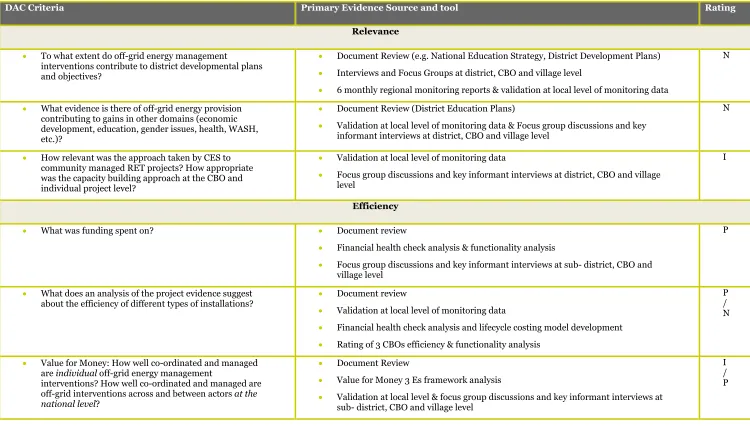
Evaluation Matrix
Table 3 sets out the primary evidence used in the process evaluation and the rating in terms of
Table 3: Evaluation Matrix
DAC Criteria Primary Evidence Source and tool Rating
Relevance
• To what extent do off-grid energy management
interventions contribute to district developmental plans and objectives?
• Document Review (e.g. National Education Strategy, District Development Plans)
• Interviews and Focus Groups at district, CBO and village level
• 6 monthly regional monitoring reports & validation at local level of monitoring data
N
• What evidence is there of off-grid energy provision contributing to gains in other domains (economic development, education, gender issues, health, WASH, etc.)?
• Document Review (District Education Plans)
• Validation at local level of monitoring data & Focus group discussions and key informant interviews at district, CBO and village level
N
• How relevant was the approach taken by CES to community managed RET projects? How appropriate was the capacity building approach at the CBO and individual project level?
• Validation at local level of monitoring data
• Focus group discussions and key informant interviews at district, CBO and village level
I
Efficiency
• What was funding spent on? • Document review
• Financial health check analysis & functionality analysis
• Focus group discussions and key informant interviews at sub- district, CBO and village level
P
• What does an analysis of the project evidence suggest
about the efficiency of different types of installations? •• Document review
Validation at local level of monitoring data
• Financial health check analysis and lifecycle costing model development
• Rating of 3 CBOs efficiency & functionality analysis
P / N
• Value for Money: How well co-ordinated and managed are individual off-grid energy management
interventions? How well co-ordinated and managed are off-grid interventions across and between actors at the national level?
• Document Review
• Value for Money 3 Es framework analysis
• Validation at local level & focus group discussions and key informant interviews at sub- district, CBO and village level
I / P
DAC Criteria | Primary Evidence Source and tool Rating
Effectiveness and results- evidence of change
• What are the most effective off-grid energy management projects overall? (Taking into account social, economic, environment and developmental factors, in addition to technical performance)
• Document Review
• Analysis of M&L Framework data and validation at local level
• Functionality analysis
• Including all focus group discussions and key informant interviews at District, sub- district, CBO and village level
N
• How effective was the use of the Community Based Organisations to manage the
interventions? I
• To what extent are the off-grid energy management interventions contributing to
development outcomes? N
Innovation and replicability
• What elements of the process were innovative and/or replicable? • Document Review
• Validation at local level
• Functionality analysis
P/ N
Sustainability
• How is the issue of sustainability approached in the projects that were visited? What elements are in place that support or detract from project sustainability, in practice?
1. Quality control, supervision throughout the operations and maintenance (O&M) continuum (from design, through installation and maintenance, contracting, warranty).
2. Roles, responsibilities and organisational capacity for sustained operations and adequate maintenance.
3. Evidence of initial and ongoing project acceptance/support/buy-in within the community and stakeholders.
4. Project level revenue generation and financing of O&M. Ability of projects to meet current savings targets to ensure long-term (5 year) financial sustainability.
5. Business planning process (including design, implementation and performance)
• Document review
• Validation at local level
• Functionality health check analysis
• Support/Detract factor analysis
• Risk analysis
• Including all focus group discussions and key informant interviews at District, sub- district, CBO and village level
S
• Risk Analysis: From the study, if CBO management is the model MREAP recommends what do we perceive to be the risks given that it is a relatively new model that needs to be managed?
• Risk Analysis
• Document review
S
Data Limitations and Challenges
The CEDP portfolio is varied in many aspects: range of technologies, applications, end-users,
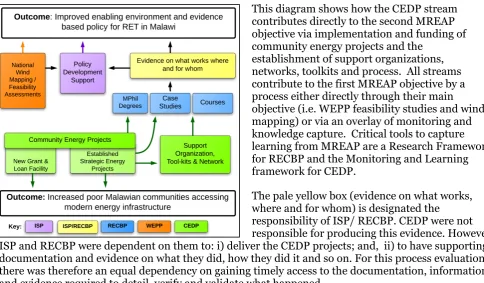
[image:22.595.56.541.232.515.2]community ownership models and beneficiaries. In order to gather data that can be evaluated across the whole portfolio of projects, a M&L Framework was developed with a system that would generate data to be evaluated. The system provided evidence from: database indicators, CBO 6 monthly reports, Regional 6 monthly reports and this process evaluation. Figure 2 below helps explain the dependencies between components (CEDP, RECBP and ISP) on delivering process documentation.
Figure 2: MREAP programmatic structure with outcomes
This diagram shows how the CEDP stream contributes directly to the second MREAP objective via implementation and funding of community energy projects and the
establishment of support organizations, networks, toolkits and process. All streams contribute to the first MREAP objective by a process either directly through their main objective (i.e. WEPP feasibility studies and wind mapping) or via an overlay of monitoring and knowledge capture. Critical tools to capture learning from MREAP are a Research Framework for RECBP and the Monitoring and Learning framework for CEDP.
The pale yellow box (evidence on what works, where and for whom) is designated the responsibility of ISP/ RECBP. CEDP were not responsible for producing this evidence. However ISP and RECBP were dependent on them to: i) deliver the CEDP projects; and, ii) to have supporting documentation and evidence on what they did, how they did it and so on. For this process evaluation there was therefore an equal dependency on gaining timely access to the documentation, information and evidence required to detail, verify and validate what happened.
The physical distance between the CEM and ISP teams meant that there were limited opportunities to come together and discuss evidence and information. One of the ways in which the teams attempted to narrow this distance was through a shared dropbox folder in the final year of the programme. The ISP lead reviewed all documentation contained within the CEDP dropbox for the evaluation, in particular the following folders: i) CBO appraisal forms; ii) grant administration files for each region and district; and, iii) learning journeys. The needs assessment folder was reviewed as part of the baseline review document. While every attempt has been made to validate the information contained within these folders and also to request additional information when necessary, it still may be the case that the Development Officers hold additional relevant material on their own laptops. For example, when building the excel models for the lifecycle costing; only the data from the approved business plans was used. However the Northern Region DO said that she had also modelled costs but that the spreadsheet was not in the dropbox. Unfortunately, without access to this additional evidence and information, the evaluation team has had to rely on the dropbox being an accurate and up to date repository of information.
M&L System challenges
There were also challenges for the Monitoring & Learning (M&L)1 system. These can be categorised into two areas:
1. As a result of the focused community level work, where participants in the process designed elements to suit local needs, extensive efforts had to be made to produce a consistent set of data across CEDP.
2. Given that the detailed community process was very time-consuming, the ability to generate consistent information on a timely manner was reduced.
In addition, the relative formality of developing an M&E system that would enable ‘proof of concept’ as well as enumerate scope and scale of benefits for a range of different individuals and households is a challenge in this context. CES and the DOs were focused on the difficult technical challenges as well as the community facilitation such that the additional requirements for M&E were, as often happens, seen as secondary in nature.
To compound matters, there was no budget for M&L in DO workplans or their activities for the first year of their employment. It is unclear why this was the case. The MREAP extension however dedicated funds to M&L for CEM and to ISP to support the DOs. However in spite of this, the DO’s capacity constraints continued to prevail and limited their availability for M&L and also the data they were able to provide. In general M&L data collection costs have been kept to a minimum by moving away from household data collection (except for those teachers’ houses where solar PVs were installed) or resource intensive processes (such as measuring firewood collection times/weighing). However on a couple of occasions it was necessary to employ the support of external researchers to collect data and enter data online for sharing and analysis.
M&L Framework
There are two important types of limitations of the M&L Framework that need to be understood. Those that are due to a lack of time for implementing the framework ex post installation and those that are more systemic.
The monitoring of the projects began post installation in May 2014. The installations had originally been envisaged for 2013, the knock-on impact is a reduction in the amount of data available against projects implemented. The time factor also limits what it is reasonable to interpret - at 6 months it is generally too early to provide evidence of sustained changes in livelihoods.
In addition, when the projects were delayed, the initial indicator set became over over-ambitious for the timeframe and was rationalised (reduction in the amount and type of indicators). As such, the M&L Framework does not contain information relating to qualitative change at the community or household level.
The M&L Framework is limited in a more systemic sense because it does not build on detailed
household level changes. Resources were not dedicated to the measuring of firewood or cooking times to be able to evidence change for the cookstove projects. It is also limited because ISP was not part of the project design phase. For example, it only became aware of the sale of solar lanterns at a very late stage when the business model had been agreed with the community. It was agreed that it was not possible to ask the community to monitor those who bought the lanterns because this would be too great a burden on top of managing a new social enterprise. The M&L Framework therefore only sets out the total number of units (for both cookstoves and solar lanterns) that were bought, returned and
13 replaced. Finally, while every effort was made to disaggregate data based on gender, the M&L
Framework does not detail number of vulnerable or excluded beneficiaries.
Indicator Limitations
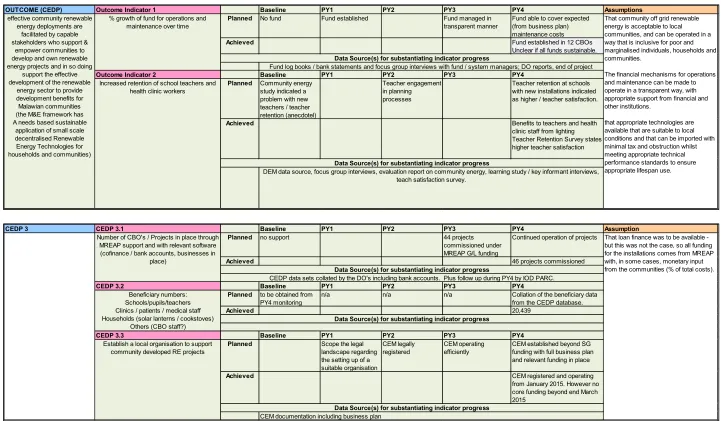
A monitoring and learning annex was attached to the application forms the CBOs had to complete to be awarded a CEDP grant. This original annex included the following indicators:
• Indicator 1 - % increase in number of households by female and male headed households in target areas with access to electricity across the district.
• Indicator 2 - No. of vulnerable people in target areas using renewable energy services and/or energy efficient measures across the district
• Indicator 3 - % growth of fund for operations and maintenance over time in the district.
• Indicator 4 - % reduction in quantity of fuel wood used per month by target households (and split by FHH and MHH) across the district
• Indicator 5- Qualitative evidence of coordination between existing structures and existing committees across the district
• Indicator 6 - Energy Expenditure (including initial capital purchases and ongoing fees) broken down into types (wood, charcoal, kerosene, dry-cell batteries, electricity monthly fees, etc.) at household and community level across the district
• Indicator 7- Increased retention of school teachers and health clinic workers across the district
Guidance was developed on an indicator by indicator basis (please see annex 10) by Strathclyde University with support from IOD PARC on how to capture data, fill out the database with the data and how this data linked to the monitoring forms at 6 months for each CBO and at the regional level.
During the months of May and June 2013 the draft Monitoring and Learning Framework (developed by ISP team leader) was critically assessed against the DO and SEP experience of monitoring with community based organisations in the field in Malawi. The full rationale behind this original set can be found in Annex 4 but for the purpose of this report, table 5 below summarises: how data was to be collected, why it was important and who also could benefit from this data. In summary, the ISP team deliberately tried to harmonise indicators with internationally established indicators alongside developing indicators that would build evidence of what works and what doesn’t in Malawi itself. The basket of indicators included both qualitative and quantitative measures. Common to the field of energy development is the measurement of access. MREAP adopted the same approach. It is important to draw attention to the fact that the M&L indicators are measuring both access to
electricity and energy efficiency.
Data analysis limitations
Table 4: Data analysis descriptions with limitations
Key term from Evaluation Matrix with description Limitations of data analysis
Monitoring datafrom the M&L Framework. Evidence was not collected for all projects against all indicators. While a counting ‘protocol’ was put in place, it was not possible to verify all data in M&L Framework during the field visits.
Document review of CEDP dropbox. Only limited folders contained documentation relevant to the review. Gaps in documentation include: what training happened, where, how often, on what topic, as well as documentary evidence of expenditure.
Financial health check was conducted by asking a set of questions with regards to: bank account, roles and responsiblities, logbook verification, transaction QA and so on with each CBO.
Only completed with 50% of CBOs in project visits (Likoma, Dowa and Nkhotakota). Evaluation team was unable to complete for Balaka and Machinga, while the CBO was not visited in Nsanje.
Please see Annex 5 for the results of the financial health checks.
Functionality checks and analysis looked at the status of the working parts of the system, namely: solar panels, charge controllers, inverters and loads.
Very minor limitations. Functionality checks were carried out on all sites visited. The full and complete breakdown of these results can be seen in Annex 7 and the proforma used to collect the results can be found in Annex 6.
Lifecycle cost2 model development was done using data from Business Plans supplemented with data from M&L Framework.
A lifecycle cost model was created for one CBO from each region. Each CBO ran different projects so the models are not comparable. There were also gaps in data which made it impossible to model beyond a year for one CBO.
Rating CBO efficiency on the basis of M&L data (and original business plans) whether or not the CBO was on track to meet its 9 month income target.
The 9 month target was not included in all business plans. It was therefore not possible to assess the efficiency of those CBOs.
Value for moneyanalysis adopted the 3 Es
approach. CEM was able to provide additional documentation when in Malawi for the PSG. However due to the delay in providing expenditure data it was not possible to use evidence to confirm figures provided nor make a judgment about whether or not the data is sufficient from which to build future budgets and forecast. Annex 4 sets out the high level lifecycle models in excel.
Support/Detract factor analysis for sustainability involved listing all the factors and generalising about whether that factor on the whole supported the sustainability of CEDP projects.
The analysis is limited because the method for assessing the overall sustainability was based on generalisations.
Risk Analysis set out the factors that are of high
importance to mitigate to ensure CEDP’s sustainability. CEM Board did not input into this analysis. Comments were received from Georgy Davis (CEDP Project Manager).
Table 5: M&L indicator set development
Original Indicator Final indicator Reason for
adaptation ‘WHAT’ projects focused on…..
‘HOW’ methods to collect and store data
‘WHY’ collect data against this indicator? ‘WHO’ is collecting data against this indicator?
Indicator 1: % increase in number of households by female and male headed households in target areas with access to electricity across the district.
Indicator AA: % increase in access to electricity for community schools across District Indicator DD: % increase in number of households by female and male headed households in target areas with access to electricity (Solar PV Home systems) across the district Cost of measuring at household level beyond unit of school and teachers’ homes. Solar PV home systems were only put in teachers’ homes.
Solar PV for Schools Solar PV for teachers’ houses Monthly through CBO logbook Stored on database
Most donors or INGOs talk of % increase in
access and use the unit of the household. It
will mean MREAP has data that is relevant to key stakeholders.
UNDP, Practical Action and the Government of Malawi for reporting against the Malawi Growth and
Development Strategy 2012.
Indicator 2: No. of vulnerable people in target areas using renewable energy services and/or energy efficient measures across the district
Not possible to recreate this indicator. However in CEDP’s single health clinic, the following was monitored - Indicator CC: Number of safe and healthy deliveries Important to choose an indicator with data readily available and a less costly method. Fuel efficient cook stoves Solar lanterns Monthly through CBO logbook Stored on database
This indicator builds on indicator 1 and looks further at the use of energy in a subset of the population. Vulnerable groups are: girls, elderly, people living with disabilities, people living with HIV/AIDS, female headed households and ethnic minorities. Use is defined to include (but not limited to): those who access lighting at night at school, or additional lighting through the day; through attending a health clinic; being visited by a midwife or nurse from a health clinic (vaccination, antenatal appointments etc as appropriate) using energy efficiency cookstoves; those who use energy at trading centres…etc.
This is an indicator being used by UNDP in their current programme. The intention was that by harmonizing data reporting with theirs (even at this very small level) it would be possible to add to their data and support a greater evidence base for who is gaining access and what this means.
Indicator 3: % growth of fund for operations and
Remained the same and
became indicator FF Not applicable Solar PV for health centre Solar PV for
DO will establish baseline for
From the learning field trips and from experience in other relevant sectors such as WASH, it is important to build evidence around the challenges of sustainability and
Both Practical Action and SolarAid are currently looking at monthly
[image:26.842.177.746.75.537.2]Original Indicator Final indicator Reason for
adaptation ‘WHAT’ projects focused on…..
‘HOW’ methods to collect and store data
‘WHY’ collect data against this indicator? ‘WHO’ is collecting data against this indicator?
maintenance over
time in the district. primary schools Solar PV for secondary schools Solar PV for CBO offices Solar PV for teachers’ house Solar PV for water pumping
fund, note opening balance of bank account or other method for savings, then monitor at 6 monthly intervals. Verified thru bank statements or witnessed community management group statements.
provide data on how income generated by RET systems is and is not spent on operations and maintenance. While the time period for MREAP projects is limited. It is still beneficial for all projects to approach community engagement openly and raise issues of sustainability, lifecycle costing and the potential burden of RET systems on the poorest households.
monitoring systems for feeding data back on income generating activities e.g. phone charging, room hire, video shows, barber shops etc. In most instances this is deposited in a bank account and is therefore independently verifiable. SolarAid beneficiaries have for example set up an account called solar maintenance into which all income is deposited. Within one year SolarAid verifies bank accounts once every 3 months. Indicator 4: %
reduction in quantity of fuel wood used per month by target households (and split by FHH and MHH) across the district
Indicator EE: Number of distributed improved stove and solar lanterns throughout CBO as well as number returned and replaced Too expensive to measure changes at individual household level and also indicator had to be appropriate to capacity of CBOs
Fuel efficient
cook stoves Measuring change in quantity; Monthly through CBO logbook Stored on database
It is crucial when samples are small to combine datasets where possible and to build coherence and greater understanding on certain specific issues. This indicator covers MREAP’s responsibility as an energy and environment related programme to contribute to the reduction in carbon emissions and provide evidence of how households are tackling locally relevant climate change problems e.g.
deforestation.
Concern Universal’s successful
implementation of the Balaka Programme used this indicator and therefore it is highly relevant for MREAP to do so also.
Indicator 5:
Qualitative evidence of coordination between existing
Not included for formal
monitoring To be picked up by formal process evaluation
Solar PV for health centre Solar PV for primary
Most significant change method Focus groups
A good basket of indicators creates a rich set of data from which progress towards an objective or outcome can be assessed. So far the indicators cover the standard energy access indicator, access and use by vulnerable groups,
17
Original Indicator Final indicator Reason for
adaptation ‘WHAT’ projects focused on…..
‘HOW’ methods to collect and store data
‘WHY’ collect data against this indicator? ‘WHO’ is collecting data against this indicator?
existing committees
across the district schools Solar PV for secondary schools Solar PV for CBO offices Solar PV for teachers’ house Solar PV for water pumping
Semi-structured interviews At 6 month point.
Store in project database.
an indicator that looks at the sustainability of engagement through the logic of provision for operations and maintenance and the
dimension of environmental accountability is reflected in indicator 4. Indicator 5 looks to assess how effective community engagement has been. We wish to understand if the off-grid implementation of RET systems are more sustainable if the process builds community coherence through transparent processes of coordination.
Indicator 6: Energy Expenditure at household and community level across the district
Indicator GG: Energy expenditure at
household level broken down by type over time Indicator HH: Capital expenditure at household level on electrical items
Only able to monitor teachers’ home expenditure Solar lanterns Solar PV for primary schools Solar PV for secondary schools Solar PV for teachers’ house Monthly through CBO logbook Stored on database
Includes initial capital purchases and ongoing fees) broken down into types (wood, charcoal, kerosene, dry-cell batteries, electricity monthly fees, etc.)
To build a full and complete picture of the outcome of off grid RET system installation it is important to understand the costs associated for households. These costs will allow ISP to understand the burden of fees, repair costs etc
Practical Action
Indicator 7: Increased retention of school teachers and health clinic workers across the district
Indicator BB: School population figures and entrance rates for primary school leavers
Too short a period (6 months) to monitor and report changes at ‘retention level’ however the Solar lanterns Solar lanterns for health centre Solar PV for primary schools Collect baseline number of teachers per primary and secondary
school for each project
Monitor this at the six month
Indicator 7 data will build a small but
independently verifiable dataset from MREAP which can demonstrate that in x schools and x health clinics we have contributed towards the retention of teachers and nurses. The data is currently monitored at a district level. We will work with local education and health offices to illustrate change in retention and also, where possible, change in calibre of teacher. There is evidence (limited at present) that suggests
Original Indicator Final indicator Reason for
adaptation ‘WHAT’ projects focused on…..
‘HOW’ methods to collect and store data
‘WHY’ collect data against this indicator? ‘WHO’ is collecting data against this indicator?
general pattern of school population figures would give a shape to what is happening. Supported by additional research on teacher retention early changes in Chitipa District
Solar PV for secondary schools Solar PV for teachers’ house
point
Use data from District Offices and verify with school records. Record and store in project database.
potential candidates expect electricity
(lighting, TV, fridge) in accommodation and in school/clinic. As such, it is put forward that those who can choose places would not choose a school or clinic without these basic services. The hypothesis is therefore that retention is a function of access and use of electricity and modern energy services.
against impact however it is important to state that our assumption is that the implementation of small off grid RET systems which are community managed could lead to improved livelihoods for all beneficiaries.
The period of extension (April 2014 – March 31st 2015) afforded CEDP the time to install the projects. Projects were mostly installed by the 31st May 2014 and therefore monitoring began from this date on the following final set1 of indicators:Indicator AA: % increase in access to electricity for community schools across District; Indicator BB: School population figures and entrance rates for primary school leavers; Indicator CC: Number of safe and healthy deliveries; Indicator DD: % increase in number of households by female and male headed households in target areas with access to electricity (Solar PV Home systems) across the district; Indicator EE: Number of distributed improved stove and solar lanterns throughout CBO as well as number returned and replaced; Indicator FF: % growth of fund for operations and maintenance over time; Indicator GG: Energy expenditure at household level broken down by type over time; and, Indicator HH: Capital expenditure at household level on electrical items.
The set focuses on building evidence of access to modern energy services and improved energy efficiency by collecting information on: the number of schools with access, the difference this access has had on enrolment levels, the number of households with improved lighting at home (through solar lanterns) and/or improved stoves. It was also agreed to explore the immediate effects of access to energy on household and capital
19 expenditure of those who have gained access through solar PV (teachers’ houses). A single health clinic was monitored to witness the changes that lighting in a delivery suite could have on the number of healthy babies being delivered. A full discussion of the limitations of this dataset can be found in the next chapter.