MODELLING THE BEHAVIOUR OF DOMESTIC MICRO-COGENERATION UNDER
DIFFERENT OPERATING REGIMES AND WITH VARIABLE THERMAL
BUFFERING
Denny Beyer, Nick Kelly
*Energy Systems Research Unit, University of Strathclyde, Glasgow, UK
*
Corresponding Author
ABSTRACT
In the UK large scale field trials (Carbon Trust, 2007) are underway to assess the performance of combustion-based, domestic cogeneration devices with regards to both their carbon-saving potential and also their possible impact on the electricity distribution system. The preliminary results indicate that only modest carbon savings are achievable from these devices. However, in these trials the systems tested did not include any thermal buffering between the device and the heating system; hence the results give an incomplete picture of domestic cogeneration performance.
This paper describes the preliminary outcomes from a comprehensive modelling exercise that explored the performance of domestic cogeneration for different UK housing types under different operational scenarios, and with and without thermal buffering. The simulation results indicate that thermal buffering has a dramatic effect on the performance and operational characteristics of micro-cogeneration devices however, due to standing losses in the thermal buffering, carbon emissions levels show only small variations.
The results from these simulations are contrasted with the evidence emerging from the field trials and it is concluded that the model gives a realistic picture of performance.
INTRODUCTION
Over the last decade in the UK there has been an upsurge in interest in domestic cogeneration with various research groups investigating the topic (e.g. Cockroft and Kelly, 2006; Peacock and Newborough, 2005). A large-scale field trial has also been underway since 2003, organised by the Carbon Trust (Carbon Trust, 2007). The preliminary results of this field trial indicate that only modest carbon savings are achievable from domestic cogeneration and that the technology is best suited to specific building types (e.g. large buildings with significant heat demands). However the systems tested in the trials lacked any thermal buffering between the cogeneration device and the heating
system. The only significant thermal capacitance was provided by a hot water tank. In contrast thermal buffering is a common feature in other field trials (e.g. Entchev et al. [2007]). Buffering is usually included to improve cogeneration performance, particularly for highly-intermittent heat loads such those found in dwellings. The absence of adequate buffering could lead to excessive cycling, a reduction in fuel efficiency and a reduced lifespan for the cogeneration device; hence, the Carbon Trust field trials provide only a partial picture of performance for domestic cogeneration.
In this paper the results of a comprehensive modelling study are reported in which the performances of two common domestic cogeneration devices (an internal combustion engine [ICE] and Stirling engine [SE]) are assessed for different UK dwelling types, operational scenarios and with and without thermal buffering. Further, the effects of different levels of thermal buffering are analysed. The models developed for these simulations are described along with the simulation approach. The results from the simulations are analysed and contrasted with those from the Carbon Trust field trials.
MODEL DESCRIPTION
yields the building’s time-varying energy flows over a user-defined simulation period.
Dwelling Models
The four generic dwelling types emerged from an analysis of various analyses of the UK housing surveys [Department for Communities and Local Government 2004, Communities Scotland 2002, Utley et al 2003]. This indicated that the majority of the housing stock could be categorised as one of four basic types:
Detached dwelling Semi-detached dwelling
[image:2.612.70.290.192.377.2]Terraced dwelling Flats
Figure 1 the dwelling stereotypes modelled in ESP-r.
Building Type
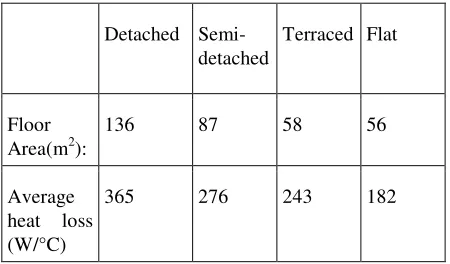
Each of the four dwellings shown in figure 1 was used in the modelling exercise. The models were intended to represent the current UK housing stock, hence their insulation levels reflected the fact that that the majority of the building stock does not conform to current building regulations. The basic characteristics of the models are given in the table below; the data was derived from information provided by Utley and Shorrock, (2003).
Detached Semi-detached
Terraced Flat
Floor Area(m2):
136 87 58 56
Average heat loss (W/°C)
365 276 243 182
Table 1: dwelling characteristics.
The ESP-r model of these dwellings comprised a 3-dimensional description of the building geometry coupled with explicit representations of the different constructions, details of occupancy, equipment loads, space and water heating control requirements and temporal hot water draws. The models could be customised to account for variations in the building stock: floor area, building materials, insulation levels, air tightness, occupancy, heating system settings, etc.). For this study four model characteristics were varied: building type; occupant type; cogeneration device type and the level of thermal buffering.
Occupant Type
Two characteristics were developed for use in the models: intermittent (working family) type occupancy and continuous occupancy (social housing or retired occupants). These reflect typical occupancy patterns seen in UK housing.
Cogeneration Devices
Two cogeneration devices were analysed in these simulations: a 5.5kWe (12.5kWth) ICE unit and a smaller 1kWe (6kWth) SE unit. The models used to represent these devices were derived from the generic combustion cogeneration device specifications developed within the International Energy Agency Energy Conservation in Buildings and Community Systems Programme Annex 42 (Beausoleil-Morrison and Kelly [eds], 2007). Both device models were capable of representing the dynamics of the cogeneration device behaviour and were used to determine coolant temperatures, operational status, performance efficiencies, fuel consumption and resulting carbon emissions. The parameters for the specific instances of the model used here were calibrated using experimental data. The calibration process and outcomes are documented in Beausoleil-Morrison and Ferguson [eds.] (2007).
Thermal Buffering
Thermal buffering was implemented in the model by running the heating and hot water circuits from an insulated water tank model coupled to the cogeneration device. Four different levels of thermal buffering were tested in the simulations 200l, 500l, 750l and no buffering. In the no-buffering case the buffer tank was removed. The tank was insulated to current UK manufacturer’s specifications.
Cogeneration and Heating System Model
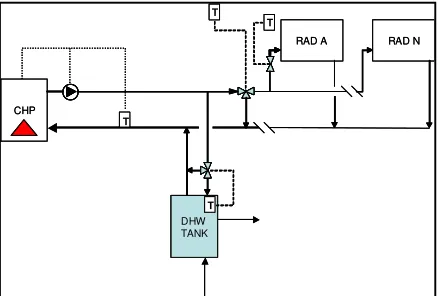
[image:2.612.70.295.545.677.2]shown in figures 2a and 2b respectively. This sub-system comprised the cogeneration device model, buffer tank (when appropriate) and models representing the balance of plant: radiators thermostatic control valves, diverting valves, a hot water tank, etc. The sub-system topology was similar to that deployed by in the domestic cogeneration field tests undertaken by the Canadian Centre for Housing Technology (CCHT) (Entchev et al. 2006).
[image:3.612.75.298.404.557.2]Figure 2a: the unbuffered heating system.
Figure 2b the buffered heating system
System Operation and Control Settings
The control settings used in the models reflected those commonly found in UK housing. Consequently, in the buffered models the cogeneration unit was controlled using an on/off controller with a 10oC dead-band. Control was based on the buffer tank temperature, which was maintained between 65 and 75oC during heating periods. In the unbuffered system models the control settings were the same however, control was
based on the return temperature of the heating system. Spaces occupied during the day were heated to 21oC, while bedroom spaces were heated to 18oC. At night-time the heating system was switched off. The hot water was heated to 50oC. Note that the hot water demands were calculated using the stochastic model developed by the IEA solar heating and cooling programme Task 26 (www.iea-shc.org/task26); this was used to generate hot water draws appropriate to the size of dwelling and number of occupants.
SIMULATIONS
The ESP-r simulation engine provides the means to undertake a dynamic thermal simulation of the integrated model. Each simulation therefore provided data on the evolution of the different model constituents over time in terms of temperature and energy flows (this including electrical energy flows).
In order to assess the impact of the four different characteristics being analysed a parametric study was undertaken. In each simulation one characteristic of the model was varied (e.g. cogeneration system, storage tank size, occupancy type or dwelling type). Further, to gauge seasonal effects each simulation was conducted using a characteristic summer, winter and transition (spring/autumn) week, with all of the simulations using the UK reference climate data set. Finally, to fully capture the effects of short-duration variation in plant performance the simulations were run with a time step of one minute. This short time step allowed phenomena such as the modulation of radiator valves and the effects of thermal transients in less thermally massive plant components to be captured in the simulation results.
In all, a total of 144 simulations were undertaken. Table 2 illustrates the model variants examined in the simulations; note that not all simulation combinations were realistic, for example the Stirling cogeneration device has too small a heat output to meet the detached dwelling’s heat demand in winter. Conversely, the ICE cogeneration device is oversized for the flat. Only viable combinations of device and system are considered here.
RESULTS AND DISCUSSION
Effects of Buffering
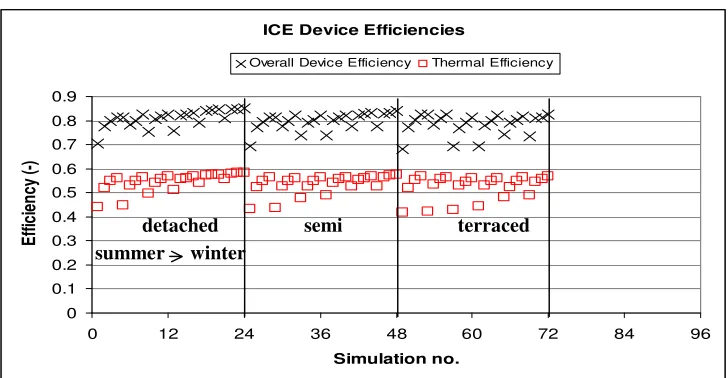
Figures 3b and 3b show the overall efficiency and thermal efficiencies for each device from all of the simulations undertaken. The ICE overall device efficiency varied between 70 and 85% with all of the lowest efficiencies attributable to the simulations where
CHP BUFFER
TANK
DHW TANK
RAD N RAD A
T
T
T
T
CHP BUFFER
TANK
DHW TANK
RAD N RAD A
T
T
T
T
CHP
DHW TANK
RAD N RAD A
T
T
T
T
CHP
DHW TANK
RAD N RAD A
T
T
T
the device operated without thermal buffering. The omission of thermal buffering reduced the overall efficiency by almost 15% in the worst case. The SE results showed similar characteristics with the lower efficiencies evident for the un-buffered simulations; the overall efficiency reduction was greater than 25% for this device in the worst case.
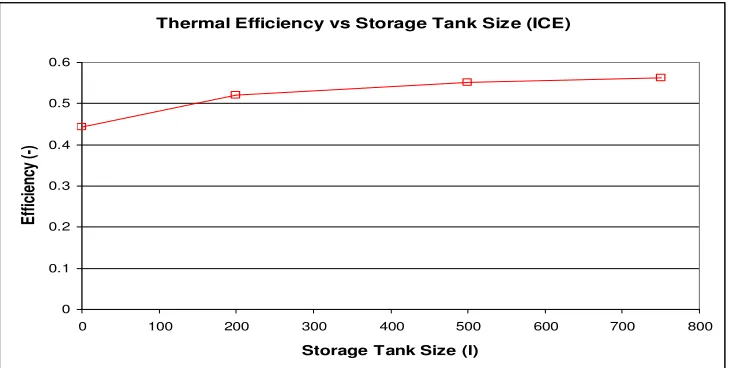
The simulation data also indicated that it was the thermal efficiency that was most affected by the addition of the thermal buffering. Figure 4 illustrates this: it shows the average thermal efficiency of the ICE device when supplying heat to the terraced dwelling during a transition week for different thermal buffer sizes. For both the ICE and SE devices the electrical efficiency showed only small variations.
The reason for the reduction in device thermal efficiency is evident when looking at figure 5 which shows the on/off cycling of the SE device in each of the simulations; weekly cycling rates varying from over 400 to below 10 for the SE. The addition of thermal buffering reduced the device cycling by an order of magnitude over the simulation period. The pattern for the ICE device was similar.
Figure 6 shows the correlation between the cycling rate and the thermal efficiency for the ICE device, the effect is similar for the SE device. The explanation for this phenomena that with higher cycling rates (resulting in shorter on and off periods for the heating system) a significant proportion of the heat from the combustion process was absorbed and then dissipated by the engine block rather than reaching the coolant; hence the potential for heat recovery to the dwelling heating system was reduced.
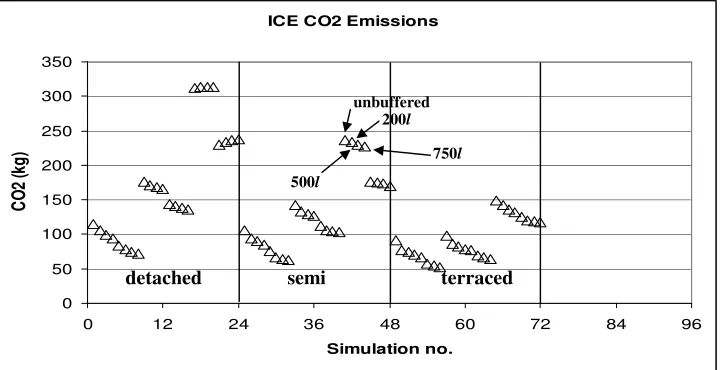
While the addition of thermal buffering clearly improved the performance of the device the impact on carbon emissions was less clear. Figure 7 shows the carbon emissions extracted from the simulations with the ICE device, and shows that the emissions for the unbuffered simulations were only slightly higher or occasionally less than the emissions associated with the buffered systems. For the buffered systems the general trend was that the higher the volume of buffering the better the environmental performance of the system. The picture for the SE device was similar. Given the clear benefits to device efficiency of buffering this is a surprising finding; however a further analysis of the data revealed that the unbuffered systems operated for fewer hours than the buffered systems. The extra operational hours in the buffered systems were required to compensate for additional standing losses from the buffering tank (which is insulated to current UK standards). Consequently, while the device efficiency
was better for the buffered systems, the additional operational hours to compensate for standing losses reduced or entirely negated this benefit. Improving the insulation levels on the buffering tank to minimise standing losses would improve the performance of the buffered systems in relation to the unbuffered cases.
Seasonal Effects and Influence of Dwelling Type
Figures 3a and 3b illustrate the seasonal variation in performance. As expected, for both the SE and ICE cogeneration devices the general trend was for greater efficiencies in the winter when the devices were operating at higher loading levels and therefore firing for longer periods of time; the effect is more pronounced for the unbuffered simulations.
Similarly, the cogeneration devices performed better in the dwellings with higher loading levels. It was noted that there were incompatibilities between the devices and certain dwellings: the SE device did not have sufficient thermal output to maintain satisfactory thermal comfort in the detached dwelling; the ICE device was too high a capacity for the flat resulting in the device shutting down frequently then the outlet water temperature exceeded the model’s upper safety limit of 85oC.
Effect of Occupancy
The greatest impact of the type of occupancy was on running time and CO2 emissions. In all of the
simulations undertaken, continuous occupancy resulted in significantly more carbon emissions than the intermittent cases. The effect on the average device efficiency was generally very small, with variations in efficiency of less than 2% evident for intermittent and continuous heating. The exception to this was the case where devices were unbuffered and lightly loaded, here the device efficiency was significantly worse for continuous occupancy as opposed to intermittent occupancy as the device suffered excessive cycling and poor efficiency for longer operating periods, consequently the emissions were greater.
Comparison with Field Trial Results
larger heat loads, these results were mirrored in the field trials.
CONCLUSIONS AND FURTHER WORK
For the purposes of this study, four stereotype dwelling models have been developed, which have been augmented with a detailed heating and hot water systems model.A comprehensive modelling and simulation exercise has been undertaken to analyse the performance of domestic cogeneration devices in typical UK dwellings under different operational contexts.
The simulations indicate that thermal buffering has a dramatic effect on the behaviour of the domestic cogeneration device performance. The device efficiency is improved, while on/off cycling is significantly reduced.
However, the effect of buffering on carbon emissions was less significant, indeed in some simulations carbon emissions increased due to increases run times. With the insulation levels used on the buffering tank in these simulations, the additional standing losses from the buffer tank tended to counteract the effect of improved device efficiency. The situation could be improved by improving the insulation on the buffer tank.
The simulation results presented here are comparable similar to those emerging from UK field trials in terms of overall efficiency and the performance characteristics (i.e. good performance in larger, older dwellings).
Finally, it should be noted that this paper only reports on a preliminary analysis of the simulation data, further analysis and simulation work remains such as analysing the performance of the cogeneration devices with improved dwellings insulation levels and a comparison of the performance of the cogeneration devices (in terms of carbon emissions) against condensing boiler and heat pump systems and investigation of the effect of different climates.
ACKNOWLEDGEMENTS
Some of the detailed models used in this paper were developed by the International Energy Agency’s Energy Conservation in Building and Community Systems research Annex 42: The Simulation of Building- Integrated Fuel Cell and Other Cogeneration Systems (www.cogen-sim.net). The Authors acknowledge the valuable input of the Annex to this paper.
The simulation work described in this paper was undertaken for the Supergen Highly Distributed Power Systems consortium. The authors gratefully acknowledge the funding and support of the UK Engineering and Physical Sciences Research Council and the indirect or direct contributions of the other consortium members.
REFERENCES
Beausoleil-Morrison, I. and Ferguson, A., eds (2007), Inter-model Comparative Testing and Empirical Validation of Annex 42 Models for Residential Cogeneration Devices, IEA/ECBCS Annex 42. Available at www.cogen-sim.net.
Beausoleil-Morrison I, Kelly N J, eds (2007) ‘Specifications for Modelling Fuel Cell and Combustion-Based Residential Cogeneration Device within Whole-Building Simulation Programs’, IEA/ECBCS Annex 42. Available at
www.cogen-sim.net.
Carbon Trust, Micro-CHP Accelerator Interim Report (2007), Carbon Trust Report CTC726. Available at:
http://www.carbontrust.co.uk/publications/publicat iondetail.htm?productid=CTC726
Clarke J A (2001), Energy Modelling in Building Design, Butterworth-Heinemann, 2nd Ed.
Cockroft J, Kelly N J (2006) ‘A Comparative Assessment of Future Heat and Power Sources for the UK Domestic Sector’, Energy Conversion and Management 47, pp2349-2360.
Communities Scotland, Scottish House Condition
Survey 2002 rev., 2003 (http://
www.scotland.gov.uk )
Department for Communities and Local Government, English House Condition Survey 2004 (http://communities.gov.uk/ehcs )
Entchev E, Gusdorf J, Swinton M, Bell M, Szadkowski F, Kalbfleisch W and Marchand R (2004), Micro-generation technology assessment for housing technology, Energy and Buildings, 36(9), September, pp925-931.
Peacock A, Newborough M, (2005) Impact of micro-CHP systems on domestic sector CO2 emissions.
Applied Thermal Engineering, Volume 25, Issue 17-18, pp2653-2676
dwelling variant
detached buffered, 200l, 500l, 750l
unbuffered continuous occupancy
intermittent occupancy
ICE -
semi-det. buffered, 200l, 500l, 750l
unbuffered continuous occupancy
intermittent occupancy
ICE SE
terraced buffered, 200l, 500l, 750l
unbuffered continuous occupancy
intermittent occupancy.
ICE SE
flat buffered, 200l, 500l, 750l
unbuffered continuous occupancy
intermittent occupancy
[image:6.612.87.527.84.224.2]- SE
Table 2 model variations analysed in simulations.
Field trials (average)
Detached dwelling
Semi detached dwelling
Terraced Dwelling
Flat
Device SE ICE SE ICE SE ICE SE ICE SE ICE
Thermal +
electrical efficiency
[image:6.612.133.483.258.366.2]77 75 - 77 77 75 71 73 72 -
Table 3 comparison of simulation and field trials results.
Figure 3a ICE overall and thermal efficiency for all simulations. ICE Device Efficiencies
0 0.1 0.2 0.3 0.4 0.5 0.6 0.7 0.8 0.9
0 12 24 36 48 60 72 84 96
Simulation no.
E
ff
ic
ie
n
cy
(-)
Overall Device Efficiency Thermal Efficiency
[image:6.612.119.483.392.581.2]
Figure 3b SE overall and thermal efficiency for all simulations.
Figure 4 variation of device thermal efficiency with storage tank size.
semi terraced flat summer winter
Overall SE Device Efficiency
0 0.1 0.2 0.3 0.4 0.5 0.6 0.7 0.8 0.9 1
0 12 24 36 48 60 72 84 96
Simulation no.
E
ff
ic
ie
n
cy
(-)
Overall Device Efficiency Thermal Efficiency
Thermal Efficiency vs Storage Tank Size (ICE)
0 0.1 0.2 0.3 0.4 0.5 0.6
0 100 200 300 400 500 600 700 800
Storage Tank Size (l)
E
ff
ic
ie
nc
y
[image:7.612.116.481.299.483.2]
Figure 5 Weekly on/off cycles for SE device from all simulations.
Figure 6 Thermal efficiency vs cycling for ICE device from all simulations.
Figure 7 ICE device CO2 emissions from all simulations.
Device Thermal Efficiency vs Cycling (ICE)
Thef f = -0.0279Ln(cyc) + 0.6486
R2 = 0.6815 0.3
0.4 0.5 0.6 0.7 0.8 0.9 1
10 100 1000
On/off cycles
T
h
er
m
al
E
ff
ic
ie
n
cy
(-)
SE on/off cycling
10 100 1000
0 12 24 36 48 60 72 84 96
Simulation no.
o
n
/o
ff
c
yc
le
s
ICE CO2 Emissions
0 50 100 150 200 250 300 350
0 12 24 36 48 60 72 84 96
Simulation no.
C
O
2
(k
g
)
unbuffered 200l
500l
750l
[image:8.612.118.479.492.677.2]