An Error Analysis of Probabilistic Fibre Tracking Methods:
Average Curves Optimization
Nagulan Ratnarajaha , Andy Simmonsb, Oleg Davydovc and Ali Hojjata
aNeurosciences and Medical Image Computing, University of Kent, UK
bCentre for Neuroimaging Sciences, Institute of Psychiatry, Kings College London, UK
cDepartment of Mathematics, University of Strathclyde, UK
Abstract. Fibre tractography using diffusion tensor imaging is a promising method for estimating the pathways of white matter tracts in the human brain. The success of fibre tracking methods ultimately depends upon the accuracy of the fibre tracking algorithms and the quality of the data. Uncertainty and its representation have an important role to play in fibre tractography methods to infer useful information from real world noisy diffusion weighted data. Probabilistic fibre tracking approaches have received considerable interest recently for resolving orientational uncertainties. In this study, an average curves approach was used to investigate the impact of SNR and tensor field geometry on the accuracy of three different types of probabilistic tracking algorithms. The accuracy was assessed using simulated data and a range of tract geometries. The average curves representations were employed to represent the optimal fibre path of probabilistic tracking curves. The results are compared with streamline tracking on both simulated and in vivo data.
1 Introduction
Fibre tracking is a non-invasive method for estimating and visualizing the white matter connectivity patterns in the human brain using diffusion tensor imaging. Algorithms for fibre tracking can be broadly classified into deterministic and probabilistic types. A criticism of deterministic streamline tractography is the lack of a measure describing confidence or uncertainty of the reconstructed trajectories.Recently, probabilistic tractography algorithms [1-6] have been developed to determine the connectivity between brain regions and these algorithms differ from other tracking algorithms that take into account the uncertainty in fibre orientation when calculating estimates of fibre tracts. Generally, the probabilistic tracking methods have three stages. In the first stage, they model the uncertainty at each voxel using a probability density function (PDF) of fibre orientations. In the second stage, the tracking algorithm repeats a streamline propagation process many times from a seed point with the propagation direction randomly sampled from the PDF of fibre orientations. The connection probability from a seed point to a voxel is defined as the frequency with which streamlines pass through the voxel, normalised for the total number of repeats. Finally a global connectivity map is estimated, using the connection probabilities between all voxels in the image and the seed point. This estimation is both a time consuming process and is memory intensive. Connection probability maps derived using such frequency of connection methods demonstrate high frequency connections close to the seed point and low frequency connections at distance. This can lead to difficulty in interpreting tracking results, because the derived connection probabilities are not comparable at different distances. The final output is not a single well defined trajectory, but rather a spatial distribution; therefore, it is difficult to analyse errors in probabilistic tracking methods. We propose an alternative method for estimating optimal fibre paths, which results in single well defined trajectories using an average curves approach. We consider the sampled paths as a set of likely curves, and the major connections estimated directly from the likely curves using average curves optimization.
The accuracy of fibre tractography is influenced by the diffusion tensor measurements sensitivity to image noise. Thus noisy diffusion tensor fields may result in deviation from the true fibre tract path and therefore may lead to erroneous estimates of connectivity. Several studies [7-9] have investigated the effects of image noise, tensor anisotropy, step size, and tract geometry on the accuracy of various streamline tractography algorithms. A Monte Carlo simulation was used by Lazar et al. [10] to investigate the error analysis of six streamline tracking algorithms. In this paper, we examine the effects of experimental noise and tensor field geometry on three types of probabilistic tracking curves (nonparametric, parametric, random walk) using simulated data and a range of tract geometries. First we use a linear diffusion tensor for error analysis and verify the performance of average curves representation. The average curves are then used to quantitatively analyse the errors and compare the performance with streamline tracking on different tract geometries from simulated data. Finally, the optimal fibre path curves generated by the average curves algorithm are tested on low level SNR in vivo data and compared to streamline tracking methods.
2 Methods
2.1 Probabilistic Tractography Algorithms
1000 tensor volumes were generated by fitting the diffusion tensor using linear least squares and computing the residuals to the fitted model. Having generated 1000 tensor volumes, continuous tensor fields were fitted to the estimates using the B-spline basis field. A simple 4th order Runge-Kutta streamline evolution algorithm was used to propagate streamlines bi-directionally from a series of seed points. This was repeated for each of the 1000 volumes to generate 1000 tracts for each seed point. The second algorithm is the Bayesian probabilistic tractography algorithm described in Friman et al. [3]. 1000 streamlines were generated from each seed point using the diffusion model, parameter values and likelihood calculations from [3]. The final algorithm was that of Hagmann et al. [2] who proposed a random walk model of a particle diffusing in a DT field 𝐷𝛼 to assess uncertainty in tractography described by
𝑥𝑛+1= 𝑥𝑛 + 𝜇 Ω𝑛 (1)
Ω𝑛 = {𝜆𝑑𝑛+ Ωn−1}, (Ω𝑛. Ω𝑛−1) ≥ 0 (2)
𝑑𝑛= 𝐷𝑛𝛼𝑟𝑛 (3)
Here {xn} are a sequence of points of the fibre path, 𝑟𝑛 are random vectors uniformly distributed over a unit sphere,
Ω𝑛 is a weighted sum of the random vector 𝑑𝑖,step size is 𝜇 and 𝛼, 𝜆 are parameters of the algorithm. The algorithm
was repeated 1000 times from each seed point with 𝛼 = 2 and 𝜆 = 1. A constant step size (0.1mm for synthetic data 0.25mm for in vivo data) and the same stopping criteria (anisotropy < 0.15, curvature >800) were used for all three methods.
2.2 Average Curves
A curve is represented numerically as a sequence of points in ℝ3. We consider a representative curve from a given collection of curves in space as the average curve of the collection. This note explores a few of the many possible definitions of average curves, and the situations in which they might be relevant. Clearly the representative curve needs to be as close as possible to all the curves in the collection. This can be achieved by ensuring that the average curve is that which minimises the difference from all of the other curves.
Distance between Curves. The classical distance between point-sets is the Hausdorff measure. The asymmetric
Hausdorff distance𝐻′ 𝐴, 𝐵 from set 𝐴 to set 𝐵 is the maximum over all points of set 𝐴 of the distance to the nearest point of set 𝐵 .
𝐻′ 𝐴, 𝐵 = max
𝑎∈𝐴( 𝑏 𝑎 − 𝑎 ) (4)
𝑏 𝑎 = 𝑎𝑟𝑔min
𝑏∈𝐵 𝑏 − 𝑎 (5)
The symmetric Hausdorff 𝐻(𝐴, 𝐵) distance between two point-sets is defined as being the maximum of the two asymmetric measures 𝐻′ 𝐴, 𝐵 and 𝐻′ 𝐵, 𝐴 .
The minimum distance from a point 𝑎 in a set A to set B is defined as
M 𝑎, B = minb∈B b − 𝑎 (6)
The average minimum distance from 𝐴 to 𝐵 is
𝐺′ 𝐴, 𝐵 = mean
𝑎∈𝐴 𝑏 𝑎 − 𝑎 (7)
which can be symmetrised by taking the mean of 𝐺′ 𝐴, 𝐵 and 𝐺′(𝐵, 𝐴). These measures are applicable to the probabilistic tracking curves, and can be implemented accurately by making comparisons of distances between the points in the sequences that represent the curves.
Average Curves Methods. Probabilistic fibre tracking methods generate two sets of curves (forward and backward
field directions) from a seed point. We apply the average curve methods to each set of curves and the resultant curves are concatenated to obtain the full fibre path. Two types of average curve methods are implemented for this experiment.
The mean curve is calculated using an arc-length re-parameterisation method, which re-parameterises the curves by placing a high number of points on each curve at equal arc length steps. Each of the points is then averaged over a number of curve-instances to produce the vertices of the average curve. The median curve is selected from the collection as the curve which differs least from all the other curves. We used different distance criteria, described above, to get the best curve from the set of likely curves for each criterion. The procedure repeats with the selected curves until it no longer reduces the number of curves and the result(s) are chosen as the median curve(s).
-1.5 -1 -0.5 0 0.5 1 1.5 2 -1.5
-1 -0.5 0 0.5 1 1.5
-1.5 -1 -0.5 0 0.5 1 1.5 2
-2 -1.5 -1 -0.5 0 0.5 1 1.5 2
2.3 Simulated and
In Vivo
Data
Simulated phantom data was used (Fractional Anisotropy (FA)-fibre =0.85, FA-nonfibre=0.13 and fibre-dimension 1 unit) with typical diffusion values. The diffusion weighted signals were computed with 30 diffusion encoding directions and b-value = 1000 s/mm2. Four tensor field geometries were considered: linear (all tensors oriented in parallel), branching (comprised of an initial linear tract branching into two tracts), crossing (two linear tracts cross) and kissing (comprised of two elliptical tracts overlaid). In order to investigate the effect of SNR on tract accuracy, noise was added to the ideal signal for every voxel in the image giving a range of SNRs (5-30) for each geometry. For each experiment (geometry, SNR, tracking method, seed point), tract estimates were generated for 1000 instances of the noisy diffusion tensor field.
In vivo data consisted of 1.5T cardiac gated diffusion-weighted data from a volunteer with image matrix of 128x128, 60 slice locations covering the whole brain, TE/TR=101.3/18000 ms and 2.5x2.5x2.5 mm3 spatial resolution. Diffusion weighting was distributed along 64 directions using a b-value of 1300 s/mm2 and there were 7 volumes with no diffusion weighting. Random trajectories were initiated from a seed point in the corpus callosum and two points in the right/ left internal capsule with step size 0.25 mm using the three probabilistic tracking methods. A stream line tracking method (4th order Runge-Kutta method) was also applied using the same seed points.
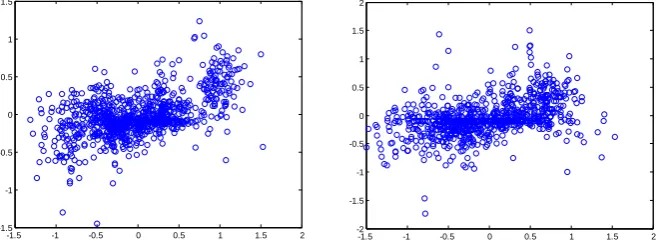
Error Analysis of Linear Tensor Fields. The error in tract estimation was analyzed at specific distances from the
seed point in planes situated perpendicular to the ideal tract trajectory. For each intersection plane, a two-dimensional distribution of points was obtained from the intersection of the noise-influenced tracts with the plane (e.g., Figure 1). The mean error, m, was defined as the distance between the mean of the generated tracts and the ideal tract intersection on the plane. The tract dispersion (STD) is the standard deviation of the distances between the intersection of each tract and the ideal tract on the plane. The success rate was defined as the percentage of total fibres that reached the intersection plane.
Error Analysis Using Average Curves. We performed fibre tracking from various seed points in different tensor
field geometries with a range of SNR levels. The true curve(s) T is the ideal trajectory and C is the resultant curve(s) using the average curves method. Performance measures (ξ) were calculated using the average minimum distance
[image:3.595.128.458.435.558.2]from C to T, and the Hausdorff distance from C to T. Stream line tracking was also applied using the 4th order Runge-Kutta algorithm from the same seed points and the performance measures (ξ) calculated.
Figure 1. Two- dimensional distribution of points for the linear tensor field (SNR=15) at 30 mm from the seed point.
The ideal trajectory crosses the plane at (0,0). Left: wild bootstrap; Right: Bayesian.
3 Results and Discussion
3.1 Linear Diffusion Tensor Fields.
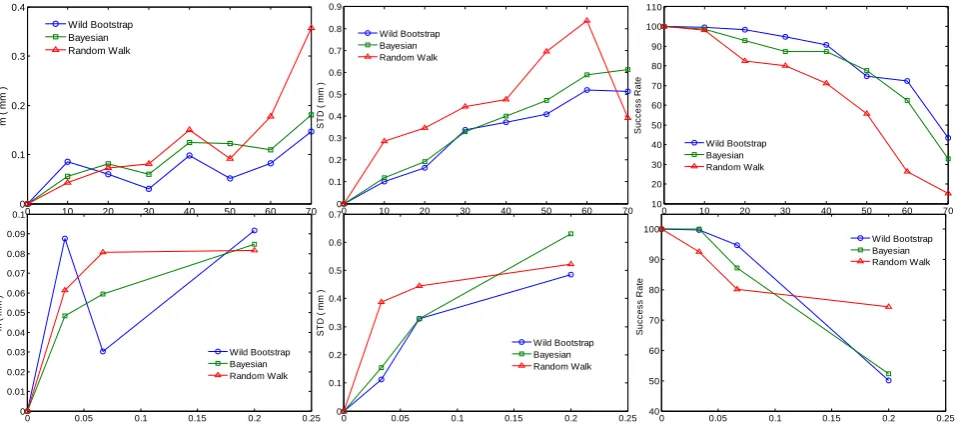
Probabilistic methods were applied from a seed point on linear synthetic data. The mean displacement m, the tract dispersion STD and the success rate as a function of the distance from the seed point and as a function of SNR were calculated. The distances were measured from the seed point from 10 mm to 70 mm in increments of 10 mm. Graphs of these measures versus distance and 1/SNR are illustrated by Figure 2. Mean displacement m was estimated to be negligibly small (< 0.2mm) in comparison with the voxel size (1mm) in almost all cases except the furthest distance from the seed point. The mean curve passes through these mean points; hence the mean curve can be considered as an error free path in the noisy fields.
0 10 20 30 40 50 60 70 0 0.1 0.2 0.3 0.4 m ( m m ) Wild Bootstrap Bayesian Random Walk
0 0.05 0.1 0.15 0.2 0.25
0 0.01 0.02 0.03 0.04 0.05 0.06 0.07 0.08 0.09 0.1 m ( m m ) Wild Bootstrap Bayesian Random Walk
0 0.05 0.1 0.15 0.2 0.25
0 0.1 0.2 0.3 0.4 0.5 0.6 0.7 S T D ( m m ) Wild Bootstrap Bayesian Random Walk
0 0.05 0.1 0.15 0.2 0.25
40 50 60 70 80 90 100 S u c c e s s R a te Wild Bootstrap Bayesian Random Walk
0 10 20 30 40 50 60 70
0 0.1 0.2 0.3 0.4 0.5 0.6 0.7 0.8 0.9 S T D ( m m ) Wild Bootstrap Bayesian Random Walk
0 10 20 30 40 50 60 70
10 20 30 40 50 60 70 80 90 100 110 S u c c e s s R a te Wild Bootstrap Bayesian Random Walk
[image:4.595.59.537.132.349.2]probabilistic tract cases, the wild bootstrap and Bayesian methods yielded less tract dispersion than the random walk except at long distances or low SNR. The success rate generally decreased with the distance from the seed point and increased with SNR. Compared with the wild bootstrap and Bayesian methods, the random walk method had a lower success rate. However, for low SNR data the random walk method performed better than the other two methods.
Figure 2. Top row: Error measures for tractography algorithms are shown as a function of distance (SNR=15) from
the seed point for m, STD and Success Rate. Bottom row: Tractography algorithm error measures as a function of 1/SNR from the seed point for the three algorithms (at a distance of 30 mm).
3.2 Error Analysis using Average Curves
Table 1 presents mean and standard deviation values for the performance measures (ξ) for 10 different seed points of simulated data. The results show that the average curve representations of probabilistic methods are more accurate than for the streamline tracking method, with significantly lower errors at corresponding SNR levels. The lengths of the resulting streamline tracking curves were also smaller than the average curve lengths (not shown in the table). The Bayesian and wild bootstrap method results are surprisingly similar and the results of the random walk method are significantly higher than both methods. The performance measures decrease with SNR in all cases.
The average curve methods are fast and relatively easy to implement with good tracking capabilities especially in the low SNR data. Compared with the mean curve method, the median curve method had a higher computational cost.
SNR D STM Mean curve Median Curve
Wild B Bayesian Random W Wild B Bayesian Random W
5 A 0.91±0.6 0.69±0.4 0.67±0.4 0.76±0.4 0.71±0.4 0.69±0.4 0.78±0.5 H 3.79±3.4 2.4±2.3 2.4±2.3 2.58±2.6 2.6±2.4 2.5±2.3 3.02±2.5
15
A 0.71±0.6 0.51±0.3 0.53±0.3 0.59±0.3 0.56±0.4 0.56±0.4 0.66±0.5
H 2.78±2.6 2.28±2.1 2.19±1.9 2.58±2.3 2.33±2.2 2.31±2.2 2.78±2.7
30 A
0.51±0.4 0.49±0.3 0.49±0.3 0.52±0.3 0.51±0.3 0.50±0.3 0.50±0.4
H 2.73±2.6 1.97±1.4 1.93±1.4 2.12±1.7 2.11±1.6 2.13±1.5 2.70±2.6
Table 1. The performance measures (ξ) in mm (STM – Streamline method, D- Distance measure, A-Average
minimum distance, H- Hausdorff distance).
3.3 In vivo results
[image:4.595.95.504.534.679.2]average curve methods and the streamline tracking curve are also shown. Few tracts cross the corpus callosum for the wild bootstrap method. The streamline tracking method terminated early in both cases.
Figure 3. Bayesian tracking results from the seed point placed in the corpus callosum (left) and wild bootstrap
results from two seed points (white arrows) in the corticospinal tract (right). Illustrated are tracts overlaid on coronal FA images, tracts alone and the resultant curves (mean curve - red, median curve - green and streamline – yellow).
4 Conclusions
We have presented an alternative method for estimating optimal fibre paths of probabilistic fibre tracking, which results in a single well defined trajectory for every major connection using an average curves approach. The average curves have been shown to be good representations for optimal fibre paths using simulated and in vivo data. Average curves are also fast and relatively easy to implement and have been used to investigate the impact of SNR and tensor field geometry on different types of probabilistic tracking algorithms. This is one of the first applications of error analysis for probabilistic tracking methods.
Acknowledgements
We would like to thank Prof. Malcolm Sabin from University of Cambridge for stimulating discussions about average curves.
References
1. T.E Behrens, M.W. Woolrich, M.Jenkinson, H.Johansen-Berg, S.Clare, J.M.Brady & S.M. Smith “Characterization and propagation of uncertainty in diffusion-weighted MR imaging”, Magn Reson Med, 50(5), pp 1077-1088, 2003.
2. P.Hagmann, J.P.Thiran, L.Jonasson, P.Vandergheynst, S.Clarke, P.Maeder & R.Meuli “DTI mapping of human brain connectivity: statistical fibre tracking and virtual dissection”, NeuroImage, 19(3), pp 545-554, 2003.
3. O.Friman, G.Farnback & C.F.Westin “A Bayesian approach for stochastic white matter tractography”, IEEE Trans Med Imaging, 25(8), pp 965-978, 2006.
4. M. Lazar & A. Alexander “Bootstrap white matter tractography (BOOT-TRAC)”, NeuroImage, 24(2), pp 524–532, 2005. 5. D. Jones & C. Pierpaoli, “Confidence mapping in diffusion tensor magnetic resonance imaging tractography using a bootstrap
approach”, Magn. Reson. Med., 53(5), pp 1143–1149, 2005.
6. B. Whitcher, D.S. Tuch, J.J. Wisco, A.G. Sorensen & L. Wang “Using the wild bootstrap to quantify uncertainty in diffusion tensor imaging”, Hum Brain Mapp., 29(3), pp 346-62, 2008.
7. A.W.Anderson “Theoretical analysis of the effects of noise on diffusion tensor imaging”, Magn.Reson.Med, 46(6), pp 1174-1188, 2001.
8. N.F.Lori, E.Akbudak, J.S.Shimony, T.S.Cull, R.K.Guillory & T.E.Conturo “Diffusion tensor fiber tracking of human brain connectivity: acquisition methods, reliability analysis and biological results”, NMR Biomed, 15, pp 493-515, 2002.
9. J.D.Tournier, F.Calamante, M.D.King, D.G.Gadian & A. Connelly “Limitations and requirements of diffusion tensor fiber tracking: an assessment using simulations”, Magn. Reson. Med., 47, pp 701-708, 2002.
[image:5.595.64.538.99.344.2]