Maximising the benefit of distributed
wind generation through
intertemporal Active Network
Management
Simon Gill
A thesis presented in fulfilment of the requirements for the
degree of Doctor of Philosophy
Centre for Doctoral Training in Wind Energy Systems Department of Electronic and Electrical Engineering
University of Strathclyde Glasgow G1 1XW
Scotland, UK
This thesis is the result of the author’s original research. It has been composed by the author and has not previously been submitted for examination which has led to the award
of a degree.
The copyright of this thesis belongs to the author under the terms of the United Kingdom Copyrights Act as qualified by University of Strathclyde regulation 3.50. Due acknowledgements must always be made of the use of any material contained in, or
To Sue…Sorry it’s not a bike
Shetland
Acknowledgements
I would like to particularly acknowledge Graham Ault and Ivana Kockar for their excellent help as supervisors. The Centre for Doctoral Training in Wind Energy Systems has provided
a fantastic environment in which to work. I would like to thank Bill Leithead, David Infield and Drew Smith for helping me complete my research, as well as other members of the
CDT.
The work presented in Chapter 7 represents my contribution to the NINES Active Network Management project. I would like to thank members of the Strathclyde NINES team, particularly: Mike Dolan, Katalin Svehla, Laura Kane, Graeme Hawker, Keith Bell and Tom Houghton. I would also like to acknowledge both Scottish Hydro Electric Power Distribution
and Smarter Grid Solutions for the use data and access to their expertise.
Contents
Figure list ... ix
Table list ... xii
List of definition boxes ... xiv
Abstract ... xv
Abbreviation list ... xviii
Chapter 1: Introduction ... 1
1.1 The challenge of the future energy system ...1
1.2 Distribution networks and distributed wind generation ...3
1.3 Focus of the thesis ...7
1.4 Thesis objectives ...7
1.5 Contributions to knowledge ...9
1.6 Publications arising from this thesis ...10
1.7 Summary of the thesis ...12
1.8 References for Chapter 1 ...13
Chapter 2: Active Network Management and smart distribution networks ... 15
2.1 Active Network Management: A definition ...16
2.2 Technologies and techniques for Active Network Management ...19
2.2.1 Generation curtailment ... 21
2.2.2 Co-ordinated voltage control ... 25
2.2.3 Reactive power dispatch of distributed generation ... 26
2.2.4 Energy storage ... 28
2.2.5 Dynamic pricing and flexible demand ... 29
2.2.6 The wider energy system ... 30
2.2.7 Other considerations for Active Network Management ... 32
2.3 A summary of Active Network Management schemes ...33
2.3.1 Orkney Active Network Management scheme... 34
2.3.2 Shetland Active Network Management scheme ... 37
2.3.3 Customer Led Network Revolution project ... 40
2.3.4 Other UK distribution network projects ... 41
2.3.5 International smart distribution networks ... 42
2.4 Research challenges for Active Network Management ...46
2.5 Conclusions ...48
2.6 References for Chapter 2 ...50
Chapter 3: Optimising distribution networks using Optimal Power Flow ... 57
3.1 A Description of Optimal Power Flow ...58
3.2 Solution methodologies for Optimal Power Flow ...61
3.3 The application of Optimal Power Flow ...62
3.3.1 Applying Optimal Power Flow to passive distribution networks ... 65
3.3.2 Optimal Power Flow for Active Network Management ... 68
3.4 Multiple time period optimisation ...76
distribution networks ...82
3.6 Conclusions ...85
3.7 References for Chapter 3 ...86
Chapter 4: Optimising an active distribution network with non-firm wind generation – an initial study ... 92
4.1 The benefit of distributed wind generation ...93
4.2 A single bus model of a distribution network ...96
4.3 Description of the single bus model ...97
4.3.1 Network model... 98
4.3.2 Energy storage model ... 99
4.3.3 Input time-series data ... 100
4.3.4 Mathematical formulation ... 102
4.3.5 Implementing the optimisation ... 105
4.4 Case study ...106
4.4.1 Case study description ... 107
4.4.2 Case study results summary ... 112
4.4.3 Optimal operation of a 1MW, 6MWh 77% efficient store ... 113
4.4.4 Investigating energy storage efficiency ... 117
4.4.5 Estimating storage lifetime with optimal schedules ... 123
4.4.6 The role of energy storage in generating revenue from renewable subsidies ... 127
4.4.7 Marginal value of energy storage in the case study network ... 130
4.4.8 Net Present Value of sodium sulphur batteries in the case study ... 132
4.5 Discussion ...134
4.5.1 Ownership of energy storage ... 135
4.5.2 Principles-of-access for energy storage and wind generators ... 136
4.5.3 Flexible demand as a form of energy storage ... 137
4.6 Maximising the benefit of wind generation ...137
4.7 Conclusions ...138
4.8 References for Chapter 4 ...139
Chapter 5: Developing a Dynamic Optimal Power Flow for Active Distribution Networks... 142
5.1 Active Network Management ...143
5.2 The Dynamic Optimal Power Flow concept ...145
5.2.1 Mathematical formulation ... 148
5.3 Dynamic Optimal Power Flow for Active Network Management ...149
5.3.1 Objectives ... 151
5.3.2 Single time-step Optimal Power Flow formulation ... 152
5.3.3 Firm distributed generation ... 153
5.3.4 Non-firm distributed generation ... 153
5.3.5 Principles-of-Access for non-firm generation ... 154
5.3.6 Energy storage ... 156
5.3.7 Flexible demand ... 160
5.4.2 Case study results ... 168
5.4.3 Case study discussion ... 175
5.5 Conclusions ...178
5.6 References for Chapter 5 ...179
Chapter 6: Dynamic Locational Marginal Pricing ... 182
6.1 The economics of Optimal Power Flow and Dynamic Optimal Power Flow 183 6.1.1 Overview of Locational Marginal Prices in Optimal Power Flow ... 184
6.1.2 Merchandising surplus ... 186
6.2 Defining Dynamic Locational Marginal Pricing ...189
6.2.1 A simple example of Dynamic Locational Marginal Pricing ... 191
6.2.2 Dynamic Optimal Power Flow shadow prices ... 197
6.2.3 Merchandising surplus in Dynamic Optimal Power Flow ... 200
6.2.4 Dynamic Locational Marginal Pricing with flexible demand ... 202
6.3 Discussion of Dynamic Locational Marginal Pricing ...204
6.3.1 Wind generation in Dynamic Locational Marginal Pricing ... 205
6.4 Conclusions ...209
6.5 References for Chapter 6 ...211
Chapter 7: Dynamic Optimal Power Flow on an islanded distribution network 213 7.1 The Shetland power system ...216
7.1.1 Stability on Shetland ... 219
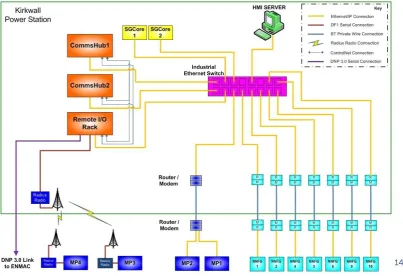
7.1.2 The Northern Isles New Energy Solutions project ... 220
7.2 Defining stability for Shetland ...225
7.2.1 Defining and maintaining stability in Active Network Management228 7.2.2 Defining stability rules in Dynamic Optimal Power Flow ... 230
7.3 NINES: the case study defined ...233
7.3.1 Objective ... 233
7.3.2 Network model... 235
7.3.3 Wind power model ... 235
7.3.4 Demand model ... 236
7.3.5 Active Network Management model ... 236
7.3.6 Network stability model ... 237
7.3.7 Other network components ... 238
7.3.8 Time-steps and time-horizon... 238
7.3.9 Case study questions ... 238
7.4 The benefit of non-firm wind capacity ...239
7.4.1 Analysing the schedule: 12th June 2011 ... 245
7.4.2 Base case summary ... 246
7.5 The benefit of energy storage ...247
7.5.1 Energy storage operation: 12th June ... 249
7.5.2 Other benefit streams for energy storage on Shetland ... 250
7.6 The benefit of Domestic Demand Side Management ...251
7.6.1 The benefit of flexible Domestic Demand Side Management ... 254
7.6.2 Domestic Demand Side Management on the 12th June ... 255
Management ... 258
7.7 Summary of the NINES case study ...261
7.7.1 The deployment of Dynamic Optimal Power Flow in the Northern Isles New Energy Solutions project ... 263
7.8 Modelling Shetland with Dynamic Locational Marginal Prices ...263
7.8.1 Base case analysis ... 265
7.8.2 Non-firm wind ... 267
7.8.3 Energy storage ... 268
7.8.4 Domestic Demand Side Management ... 272
7.9 Conclusions ...275
7.10 References for Chapter 7 ...276
Chapter 8: Conclusions ... 279
8.1 Review of conclusions ...279
8.1.1 Conclusions from the review of literature on existing ANM schemes and optimisation methods ... 280
8.1.2 Conclusions from a linear programming model ... 282
8.1.3 Dynamic Optimal Power Flow for Active Network Management ... 284
8.1.5 Conclusions from applying Dynamic Optimal Power Flow to a real Active Network Management scheme ... 287
8.2 The contribution to knowledge ...289
8.2.1 The first study of effect of energy storage on operation of ANM ... 289
8.2.2 The development of Dynamic Optimal Power Flow for Active Network Management ... 290
8.2.3 The theory of Dynamic Locational Marginal Pricing... 291
8.2.4 An operational application of DOPF to an islanded distribution network ... ... 291
8.3 Future Work ...292
8.3.1. Integrating other Active Network Management technologies ... 292
8.3.2 Modelling uncertainty in wind and demand forecasts ... 293
8.3.3 Developing Dynamic Locational Marginal Pricing ... 294
8.4 Summary ...294
8.5 References for Chapter 8 ...295
Appendix 1: Mathematical formulation of optimisations ... 296
A1.1 Linear programming optimisation of Chapter 4 ...296
A1.2 Dynamic Optimal Power Flow formulation of Chapter 5 ...298
A1.3 Modifications to the Dynamic Optimal Power Flow formulation presented in Chapter 7 ...302
Appendix 2: Summary of software developed to implement Dynamic Optimal Power Flow ... 306
A2.1 Dynamic modelling for Matpower ...306
Fn: rundopf() ... 308
Fn: dopf() ... 308
Fn: storageConstraintInequality() ... 308
Fn: stabilityConstraints() ... 309
Fn: stat2dyn() ... 309
Fn: postProcessing_1() ... 309
A2.2 Using Dynamic Modelling for Matpower ...310
A2.2.1 Install Matlab and Matpower ... 310
A2.2.2 Install Dynamic Modelling for Matpower ... 310
A2.2.3 Create a Dynamic Modelling for Matpower CaseFile ... 310
A2.2.4 Objective of the Dynamic Modelling for Matpower Optimisation ... 315
A2.2.5 Coding network stability rules ... 316
A2.2.6 Calling Dynamic Modelling for Matpower ... 318
A2.2 References for Appendix 2 ...319
Figure list
Figure 1 : The energy trilemma ... 2
Figure 2: Wind resource map of the UK ... 4
Figure 3: Definition of the firm limit on distributed generation capacity ... 5
Figure 4: The place of ANM relative to other distribution network control systems ... 19
Figure 5: Schematic of the elements required for an ANM scheme ... 21
Figure 6: Summary of key wind turbine generator types ... 27
Figure 7: Outline of the Orkney Islands Distribution network ... 36
Figure 8: Communication and control infrastructure for the Orkney ANM scheme.. ... 37
Figure 9: The Shetland Islands. ... 39
Figure 10:Example ofthe form of the 2-dimensional histogram used in reference [3.26] ... 69
Figure 11: Single bus representation of a distribution network ... 96
Figure 12: Generic model of an energy storage system. ... 99
Figure 13 : Illustration of power flow to / from the one bus distribution network . 102 Figure 14: Fraction of curtailment occurring between midnight and 6AM with non-firm wind generation ... 109
Figure 15: Time-series of normalised demand and generation for two weeks during October 2009 ... 109
Figure 16: Load duration curve for chapter 4 case study. ... 110
Figure 17: Two weeks data for curtailment of non-firm wind generation and network demand. ... 110
Figure 18: Price duration curve for Chapter 4 case study ... 111
Figure 19: Example results from the single busnetwork optimisation for a 1MW/6MWh 77% efficient energy store.. ... 114
Figure 20: Energy storage revenue generated as a function of round trip efficiency ... 118
Figure 21: System price and optimised schedules for scenario I ... 121
Figure 22: Change in the reduction in curtailed energy with energy storage capacity ... 122
Figure 23: Quantity of otherwise-curtailed wind energy returned to grid after energy storage losses. ... 123
Figure 24: Histogram of the depth of discharge of cycles for the optimal charging strategy for a 77% efficient storage device in Scenario III ... 126
Figure 25: Two scenarios for the location of energy storage relative to a wind farm ... 128
Figure 26: Marginal Revenue and marginal curtailment reduction curves for 75% efficient energy storage in scenario III with 20MW of non-firm wind capacity. ... 131
Figure 27 A 3-bus network to illustrate the concept of Optimal Power Flow ... 146
form of energy storage with example processes ... 161
Figure 31: Comparison of models for (A) energy storage and (B) flexible demand components ... 163
Figure 32: Case study distribution network for Chapter 5 ... 166
Figure 33: Normalised input time-series for Chapter 5 case study ... 167
Figure 34: Curtailed wind for (A) WF4 and (B) WF5 in scenario I ... 170
Figure 35: State of charge for energy storage in Scenario II ... 172
Figure 36: Overall charging / discharging schedule for energy storage and reduction in curtailment for scenario II. ... 172
Figure 37: Separate actions of charging and discharging components of energy store, ... 173
Figure 38: Schedule of flexible demand at bus 7 compared and effect on curtailment at WF4 in scenario III ... 174
Figure 39: (a) dispatch of flexible demand unit at bus 2 compared with (b) apparent power flow through the GSP in scenario III ... 174
Figure 40: Change in export between scenario III and scenario IV ... 175
Figure 41: Reduction in curtailment at WF4 and 5 with the addition of flexible demand. ... 177
Figure 42: A two-bus power system used to illustrate locational marginal pricing in Chapter 6 ... 185
Figure 43: Example 2–bus DOPF network model with three time-steps used to illustrate DLMPs. ... 189
Figure 44: Time-series of demand for example DLMP case study ... 192
Figure 45: (A) Generation and (B) DLMP values for Bus 1 and 2 with no storage included. ... 193
Figure 46: (A) Generation, (B) DLMP and (C) storage schedule for the case where a totally efficient store is added to the test 2-bus network. ... 194
Figure 47: (A) DLMP and (B) storage schedule when an energy store with round-trip efficiency of 0.7 is included in the 2-bus test network. ... 196
Figure 48: Variation of marginal value of (A) power and (B) energy capacity of the energy storage using shadow prices. ... 200
Figure 49: DLMPs for bus 1 with and without flexible demand and the schedule for flexible demand. ... 203
Figure 50: The effect of firm wind generation on DLMPs at bus 1. ... 207
Figure 51: DLMP values for bus 1 with 9.9MW of firm wind compared with 10MW of firm + 0.1MW of non-firm wind. ... 208
Figure 52: Load duration curve for the Shetland power system. ... 216
Figure 53: The Shetland islands: (A) Map of the islands and (B) topological outline of the 33kV power system ... 217
Figure 54: Illustration of demand profiles for (A) space heating and (B) water heating in a group of approximately 100 houses in Lerwick. ... 222
Figure 55: Heat flow from existing and planned components linked to the Lerwick district heating network. ... 223
second-generation system ... 230 Figure 58: Network diagram of Shetland power system showing flexible
components modelled in this chapter. ... 234 Figure 59: The stable wind generation envelope for the Shetland case study with no flexible demand. ... 238 Figure 60: The benefit of each additional MW of non-firm wind capacity in terms of the energy it generates during a 1-year period ... 242 Figure 61: Reduction in losses with installed non-firm wind capacity ... 244 Figure 62: Available and scheduled non-firm wind generation for 12th June 2011. 245
Figure 63: Results showing the wind generation and system generation at each of the 96 time-steps of 12th June 2011. ... 246
Figure 64: The effect of energy storage on total generation and wind generation at each time-step, 12th June 2011. ... 249
Figure 65: The underlying demand profile for heat in 1750 houses ... 253 Figure 66: The normalised teleswitching envelope for Shetland ... 253 Figure 67: The effect of introducing flexible demand in the form of DDSM on
dispatch of generation for the 12th June ... 255
Figure 68: The effect of flexible DDSM on the viable wind capacity ... 257 Figure 69: The increase in viable capacity created by frequency-responsive DDSM ... 259 Figure 70: Scatter plot of total generation with (A) flexible DDSM and (B) frequency-responsive DDSM. ... 261 Figure 71: DLMP values for selected locations for the 12th June with no non-firm
wind. ... 266 Figure 72: DLMPs at selected locations with 15MW of non-firm wind capacity. ... 268 Figure 73: (A) DLMP values for Lerwick on the 12th of June with and without energy
Table list
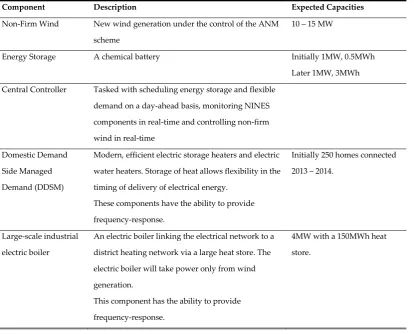
Table 1: Devices potentially under ANM control in the NINES network ... 40
Table 2: Summary of network for Chapter 4 case study ... 108
Table 3: Revenue generation and curtailment reduction for Chapter 4. ... 113
Table 4: Summary statistics for a 1MW, 6MWh 77% efficient energy storage devices connected under Chapter 4 Scenario III ... 115
Table 5: Gradient of annual revenue as a function of energy storage efficiency ... 119
Table 6: Number of cycles in the lifetime of a sodium sulphur battery at various depths of discharge ... 124
Table 7: Calculation of an estimate of the battery life used over 1 year for a 77% efficient storage device representing a sodium sulphur battery ... 127
Table 8: Total increase in wind farm subsidies ... 129
Table 9: Characteristics of sodium sulphur battery technology ... 132
Table 10: Net present value of Sodium Sulphur battery energy storage ... 133
Table 11: General structure of mathematical formulation for OPF and DOFP problems ... 150
Table 12: Parameters of distributed generation and active network management components ... 167
Table 13: Results showing wind farm curtailments, net exports and losses for scenarios I – IV and revenues for scenarios III and IV. ... 168
Table 14: Export increase relative to scenario I for variations in size and location of energy storage ... 177
Table 15: Summary of components in example DLMP network for Chapter 6 ... 192
Table 16: Comparing the change in objective function with small increases in power and energy capcacity of the store... 199
Table 17: Values of payments and economic surpluses with energy storage. ... 202
Table 18: Value of payments and economic surpluses for case with flexible demand ... 204
Table 19: Payments and surpluses for the example case including wind generation with zero marginal cost. ... 208
Table 20: The effect of adding a 1MW/6MWh 70% energy storage on payments and surpluses with 15MW of wind generation ... 209
Table 21: A summary of the electrical characteristics of the Shetland power system ... 217
Table 22: Example of 'planned' capacities of wind farms for the Shetland case study ... 240
Table 23: Results for non-firm wind generation for base case simulations with no flexible demand or energy storage on Shetland ... 241
Table 24: Marginal conventional generation reduction and marginal capacity factor of each 1MW of non-firm wind capacity added to the NINES network. ... 243
Table 25: The effect of a 1MW/6MWh 77% efficient store on wind and conventional generation ... 247
Table 28: The effect of DDSM on energy generation at WF2, 3 and 4. ... 254 Table 29: Aggregated effect of DDSM including the addition of an extra 0.7MW of viable non-firm wind capacity. ... 257 Table 30: The effect of frequency-responsive DDSM on both wind generation and conventional generation ... 259 Table 31: Setup for the DLMP study of the Shetland power system ... 265 Table 32: Payments and merchandising surplus for the 12th June using DLMP ... 267
List of definition boxes
Box 1: Initial Working Definition of Active Network Management used in this thesis………...18 Box 2: A working definition of second-generation Active Network Management…48
Box 3: Dynamic Locational Marginal Pricing definition based on marginal cost....190
Abstract
The role of distribution networks is changing. There is a significant drive, influenced by climate change and security of supply issues, to move electricity generation towards renewable technologies. This is leading to an increase in demand for renewable generation connections at the distribution network level and putting pressure on distribution network operators to change the ‘fit-and-forget’ philosophy of network operation to include more active approaches. In the UK this is seen through the development of Active Network Management schemes which manage distributed generation in real-time, applying constraints when required to maintain network limits.In parallel, technologies have been developed that are capable of providing intertemporal flexibility, of which two particular examples are energy storage and flexible demand.
The objective of the thesis is to answer the questions: How can energy storage and flexible demand be scheduled in a second-generation Active Network Management scheme? And how should they be operated to gain most benefit from distributed wind generation?
To answer these questions, the thesis develops and uses tools to study the optimisation of second-generation Active Network Management schemes including intertemporal technologies. The tools developed include a Dynamic Optimal Power Flow algorithm for management of energy storage and flexible demand. The thesis provides the first fully flexible model of energy storage in this context, the first implementation of principles-of-access in an optimal power flow, and the first detailed study of the role of energy storage and flexible demand in managing thermal limits and reducing curtailment of distributed wind generation.
them.
The thesis goes on to provide a detailed report of the application of Dynamic Optimal Power Flow and Dynamic Locational Marginal Pricing to an islanded Active Network Management scheme currently in deployment in the UK. This highlights the ability of the tools developed to contribute to future projects.
A conclusions of the thesis is that DOPF provides a useful method of scheduling flexible devices such as energy storage and power systems. It takes full account of network constraints and limitations, and as applied in this thesis, the most complete models of the intertemporal effects of energy storage and flexible demand to date. The studies contained in the thesis show that energy storage and flexible demand can increase the benefit of distributed wind generation in Active Network Management by minimising curtailment and transferring generated electricity to periods during which the energy has greatest value in offsetting expensive, fossil fuel based generation. The thesis notes the importance of a useful definition of the ‘benefit’ of wind generation in terms of global objectives such as minimising emissions rather than interim objectives such as maximising generation from renewables.
to provide a significant benefit in terms of reduced wind curtailment. This ability is further enhanced for island situations if demand has a frequency-responsive component.
Abbreviation list
ANM Active Network Management
DDSM Domestic Demand Side Management DHN District Heating Network
DLMP Dynamic Locational Marginal Pricing DMS Dynamic Merchandising Surplus DNO Distribution Network Operator DOPF Dynamic Optimal Power Flow FITS Feed-in tariffs
LIFO Last In First Out
LMP Locational Marginal Pricing LPS Lerwick Power Station
NINES Northern Isles New Energy Solutions NPV Net Present Value
OPF Optimal Power Flow
ROCs Renewable Obligation Certificates
SHEAP Shetland Heat Energy And Power (Operator of the Lerwick district heating network)
Chapter 1:
Introduction
MART GRID is one of the most frequently used terms in the academic literature about power systems. During the period January 2010 – May 2013, 919 journal and magazine articles were published by the IEEE containing Smart Grid as a key word [1.1]. A specific journal, IEEE Transactions on Smart Grids, was launched in 2010 [1.2] and in the first edition’s editorial the smart grid concept is described as follows:
Smart grid represents a vision for digital upgrade of electric power systems. It optimizes grid operations, enhances grid security, and opens new markets for the utilization of sustainable energy. [1.3]
This description highlights the novelty of the techniques and technology required to operate the future grid. Smart Grid is predicated on the need for the power system to help achieve greater utilisation of sustainable energy sources whilst maintaining safe and secure operation of the grid. The concept of smart grid is about managing power systems to meet the energy needs of our future society.
1.1
The challenge of the future energy system
Any energy system should be designed to accomplish the energy goals set by the society which it serves. In many countries, the aims of their current energy policy combines aspects of three competing objectives which together lead towards sustainability: low-carbon generation; security of supply; and the lowering of costs.
to one objective is often at the expense of meeting the other two. The tensions are illustrated by the energy trilemma [1.4]illustrated in Figure 1.
Figure 1 : The energy trilemma showing the three competing objectives of modem energy policy which lead towards a sustainable system (adapted from [1.4]).
Low-carbon technologies include wind generation, nuclear or fossil fuel generation fitted with carbon capture. The associated costs are higher than those of traditional carbon-intensive technologies: in the UK context the levelised cost of onshore and round three offshore wind generation is estimated at approximately £90/MWh and £113/MWh respectively; this compares with £85/MWh for closed-cycle gas turbines [1.5].
The third horn of the trilemma – security of supply – includes both the day-to-day operational security of energy infrastructure and longer term issues regarding fuel prices and availability. Wind generation, as an example of an intermittent renewable technology is likely to reduce the operational security of a power system due to the uncertainty of its operation. However, in the longer term the availability of wind generation in the UK is considerably more certain than the price or availability of fossil fuels and nuclear fuels purchased in the geopolitical market.
renewable electricity generation is more mature than renewable heat or transport, it is expected that this will provide the greatest contribution to meeting those targets. The UK Government expects that 30% of the UK’s electricity will be generated by renewables by 2020, compared with 12% of heat and 10% of transport energy [1.7]. Within the UK, Scotland has put in place the most stringent renewable targets, aiming for 100% of electricity demand to be met by renewable energy when averaged across a year [1.8].
These targets highlight the important role that the electrical networks will play in connecting, distributing and facilitating the use of electricity from onshore wind generation. The UK Government’s Renewable Energy Roadmap estimates that onshore wind capacity will increase to 13GW in 2020 [1.9]. The role of the electricity networks is to ensure that this energy is available to meet demand for electricity where and when it is required whilst maintaining safety.
1.2
Distribution networks and distributed wind
generation
Traditionally, distribution networks have been designed to take power from the point of connection with the transmission network and deliver it to consumers - power flow has been outwards. This design formed part of a power system with a small number of large, centrally located and controllable generators.
The expansion of renewable generation changes both the character and the location of generation. Generation from wind farms is intermittent and significantly less controllable than conventional fossil fuel generation. In addition, a significant capacity of wind generation is connected to the distribution rather than the transmission network. Connecting wind generation as distributed generation (connected to the distribution network) is advantageous because it entails significantly lower costs for small-scale developments and in many locations it is the
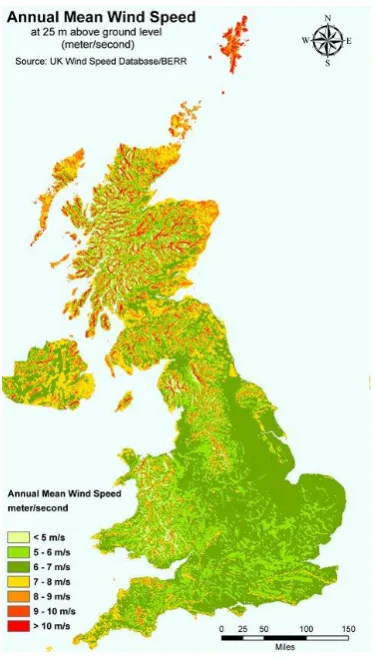
generally towards the northern and western fringes in Scotland, western England and Wales. These are the areas that are poorly served by the transmission network, and wind farms developed in these areas have no choice but to connect to the distribution network.
Figure 2: Wind resource map of the UK1
Whilst there is high demand for distribution-level connections for generation in these areas, capacity on distribution networks is limited. Passive operation of distribution networks has until recently been the norm, and this significantly limits the capacity of wind generation that can be connected. Distribution Network Operators (DNOs) define a firm limit on the capacity of distributed generation. This is calculated using
were designed to operate autonomously without direct control from the operator, it was considered important that distributed generation did not lead to the violation of either voltage or thermal limits at any demand level that might be expected on the distribution network. As such, DNOs identify the condition during which the least distributed generation is possible - and define this as the limit on the distributed
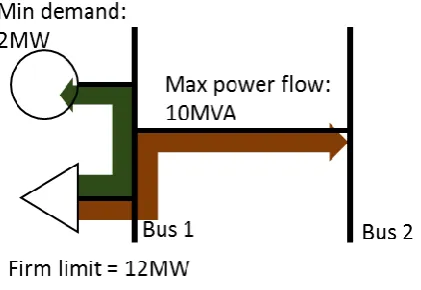
[image:23.595.219.430.315.460.2]capacity that they will connect. The worst-case scenario is usually the minimum demand [1.10, 1.11]. Figure 3 illustrates the flow of real power from a distributed generator (either to a local demand or up the distribution network towards the transmission network). The maximum allowable output of a distributed generator is equal to the local demand and the thermal limit on the distribution branch.
Figure 3: Definition of the firm limit on distributed generation capacity. As power flow limits are normally quoted in MVA to represent apparent power, it is assumed here that reactive power flows are negligible.
firm limit is binding.
The move to active operation of distribution networks has been developed over the past decade in the UK through Active Network Management (ANM). This allows an increased capacity of distributed generation to connect under the condition that its output is curtailed when required, to maintain thermal and voltage limits. This new wind is connected under non-firm contracts which do not guarantee network access at all times. Curtailment schemes involving non-firm distributed generation have been deployed, or are in the process of being deployed, on a number of distribution networks across the UK.
The introduction of non-firm wind generation increases the capacity of renewable generation on the power system. But each unit of non-firm capacity provides less benefit because some of its potential output is curtailed. Gaining the greatest benefit from non-firm wind generation involves minimising curtailment. Two methods of achieving this are: time-shifting otherwise curtailed generation by using energy storage; and the use of flexible demand which can be scheduled to use otherwise curtailed generation.
Both these technologies are being rolled out on UK distribution networks during 2013. On the Orkney distribution network, the UK’s first large-scale battery was commissioned during August 2013 [1.12]. On the Shetland Islands, a flexible electric heating project is underway with a local housing association [1.13].
intertemporal technologies with the requirement of scheduling form part of a move identified in this thesis towards second-generation ANM schemes.
1.3
Focus of the thesis
This thesis focuses on the need to develop optimisation tools capable of modelling both the network effects and the intertemporal effects of second-generation ANM schemes. The focus is on the needs identified from existing and planned ANM schemes in the UK, particularly those on the Orkney and Shetland Islands. Energy storage and flexible demand are used as two examples of intertemporal flexibility. The methodological frameworks developed are general and can include many technologies relevant to ANM schemes; a subset of these technologies are modelled in the case studies, and the focus is on issues identified in the review of literature as requiring development. The case studies focus on: curtailment due to thermal constraints; the operation of non-firm wind; energy storage; and flexible demand. The role of other ANM technologies such as coordinated voltage control and reactive power dispatch, which are well developed by the existing literature, are also discussed.
1.4
Thesis objectives
The main question this thesis attempts to answer is:
How can energy storage and flexible demand be scheduled in a second-generation ANM scheme? How should they be operated to gain the most benefit from distributed wind generation?
Answering this question requires the development of several tool and techniques which will model the optimisation of Active Network Management schemes. It also entails defining what is meant by ‘benefit from distributed wind’. Finally these tools and techniques will be applied to a case study based on the ANM scheme currently in development on the Shetland Islands.
conclude on the likely future development trends.
Review the optimisation methods currently used for operation of ANM, particularly those based on Optimal Power Flow. Identify the developments required for modelling second-generation ANM, including energy storage and flexible demand.
Define the benefit delivered by distributed wind generation.
Develop optimisation tools which can be applied to the operation of non-firm wind generation, energy storage and flexible demand in a distribution network.
Develop a multi-time-step or Dynamic Optimal Power Flow (DOPF) framework suitable for modelling and optimising the operation of non-firm wind, energy storage and flexible demand.
Benchmark the benefits provided by non-firm wind generation using the optimisation tools developed.
Investigate the increase in benefit from distributed wind generation when energy storage and flexible demand are included in a distribution network with the optimisation tools developed.
Identify the factors important for maximising the benefit provided by such ANM schemes.
Demonstrate the application of DOPF to an industrial project developing a new ANM scheme.
Extend the concept of Locational Marginal Prices (LMPs) and the economic signals from optimal power flow solutions to use the results of DOPF; develop a theory of Dynamic Locational Marginal Prices (DLMPs).
1.5
Contributions to knowledge
The thesis delivers a number of important contributions to engineering in terms of both knowledge and novel techniques:
1. It provides the first study of the effect of energy storage on the operation of an ANM scheme. This includes the effect of energy storage on other network participants, particularly how it affects the access to the network given to non-firm generators. It is also the first study to consider the influence of renewable subsidies on the siting and operation of energy storage (Chapter 4).
2. The development of a multi-time-step DOPF framework capable of modelling key second-generation Active Network Management technologies. The reframing of energy storage and flexible demand as branches within that network carrying out a similar role to electric circuits: transferring energy between network nodes with the nodes connected by these technologies separated by time rather than space (Chapter 5).
3. The realisation of full models of the following technologies within that framework: energy storage; flexible demand; principles-of-access for non-firm wind generation (Chapter 5).
4. The first fully flexible formulation of energy storage including:
- The ability to set charging and discharging efficiencies separately at any value between 0 and 1 whilst at the same time removing the need to pre-define times for charging and discharging (Chapter 5).
5. The theory of Dynamic Locational Marginal Prices as an extension of the existing theory of Locational Marginal Prices, and an example of its application to an islanded distribution network (Chapters 6 and 7).
Through the development of this thesis, the author has published the following journal articles as main author:
S. Gill, I. Kockar, G. Ault, Dynamic Optimal Power Flow for Active Distribution
Networks, Power Systems, IEEE Transactions on, vol. 29, no. 1, pp, 121 – 131, Jan 2014.
S. Gill, E. Barbour, I. A. G. Wilson, D. Infield, “Maximising revenue for non-firm
distributed wind generation with energy storage in an active management scheme”, Renewable Power Generation, IET, vol. 7, no. 5, Sep 2013.
S. Gill, B. Stephen, S. Galloway, “Wind Turbine Condition Assessment Through
Power Curve Copula Modeling”, Sustainable Energy, IEEE Transactions on, vol.3, no.1, pp.94-101, Jan. 2012.
S. Gill, M. J. Dolan, D. Frame, G. Ault, “The role of electric heating and district heating networks in the integration of wind energy to island networks”, Distributed Energy Resources, International Journal of, vol. 7, pp 245-262, July 2011.
The author has also contributed to the following conference papers either as main author or co-author:
B. O’Neill, C. Foot, R. MacDonald, M.J. Dolan, S. Gill, C. Mathieson, S. Reid, “Active Network Management on Islanded Systems: The Shetland Experience”,
Innovative Smart Grid Technologies (ISGT Europe), 4th IEEE/PES, Copenhagen,2013.
I. Kockar, S. Gill, “Dynamic Optimal Power Flow for the improved integration of Distributed Energy Resources”, Power and Energy Society General Meeting,
Vancouver, 2013.
S. Gill, G. Ault, I. Kockar, "Using dynamic optimal power flow to inform the design and operation of active network management schemes”, CIRED,
of an active network management scheme for the Northern Isles new energy solutions project”, CIRED, Stockholm, June 2013.
L. Kane, G. Ault, S. Gill, “An assessment of principles of access for wind generation curtailment in active network management schemes”, CIRED, Stockholm, June 2013.
S. Gill, G. Ault, I. Kockar, S. Reid, C. Foot, “Operating a wind farm in the future
smart grid - lessons from designing and deploying a smart grid on Shetland," European Wind Energy Association, Vienna, Jan. 2013.
M. J. Dolan, G. Ault, D. Frame, S. Gill, I. Kockar, O, Anaya-Lara, S. Galloway, B. O'Neill, C. Foote, C, A. Svalovs, “Northern Isles New Energy Solutions: Active network management stability limits”, Innovative Smart Grid Technologies (ISGT Europe), 2012 3rd IEEE PES International Conference and Exhibition on, 14-17 Oct.
2012, Berlin, 2012.
S. Gill, E. Barbour, I. A. G. Wilson, D, Infield, “Maximising revenue for non-firm
distributed wind generation with energy storage in an active management scheme”, Renewable Power Generation (RPG 2011), IET Conference on, Sept. 2011, Edinburgh, 2012.
S. Gill, G. Ault, I. Kockar, “The optimal operation of energy storage in a wind power curtailment scheme,” Power and Energy Society General Meeting, 2012 IEEE , pp.1,8, San Diego, 2012.
The structure of this thesis mirrors the development of the concepts – from initial scoping, through development of the underpinning theory, to deployment to a real project.
Chapter 2 provides a review of the academic literature and on-the-ground developments in ANM in the UK. It also discusses two international examples of active distribution networks. It identifies that whilst the first generation of ANM is becoming business-as-usual, a second-generation ANM concept can be identified which includes intertemporal technologies such as energy storage and flexible demand.
Chapter 3 reviews the use of optimal power flow to study active distribution networks, energy storage and flexible demand. It identifies the concept of DOPF – initially used for the problem of hydro-thermal coordination – as useful in the analysis of second-generation ANM schemes.
Chapter 4 is a simplified linear programming-based optimisation study of the operation of an ANM scheme containing energy storage. It discusses how the benefit of distributed wind generation will be defined in the thesis. It then studies a distribution network aggregated to a single-bus and linked to the transmission network by a thermally constrained circuit. The study identifies the role of energy storage in increasing the output of non-firm generation whilst acting to maximise its own revenue. The chapter investigates the benefit provided by energy storage, carries out a cost-benefit analysis, and outlines the effect that renewable subsidies will have on decisions regarding both its placement and efficiency.
Chapter 5 presents the full theoretical framework of DOPF for ANM schemes. It
to illustrate the concept.
Chapter 7 describes the adaptation and deployment of the DOPF formation to an industrial project developing an ANM scheme for an islanded network. It describes the Northern Isles New Energy Solutions project on Shetland and the role of DOPF within the project. The chapter goes on to give a detailed analysis of a year-long study into operation of non-firm generation, energy storage and flexible demand with the objective of minimising conventional generation on the Shetland Islands. Finally, the chapter extends the analysis to apply DLMPs to the operation of the Shetland network.
Chapter 8 concludes the thesis and brings together the learning from each chapter. It
justifies the contributions to knowledge listed above and answers the key thesis question. Finally, important future work is identified.
1.8
References for Chapter 1
[1.1] IEEE, Search Results for "Smart Grid" journal and magazine articles, 2013, Available: http://ieeexplore.ieee.org/search/searchresult.jsp?ranges%3D2010 _2012_p_Publication_Year%26queryText%3D%22smart+Grid%22&refineme nts=4291944246&pageNumber=1&resultAction=REFINE accessed: 10/09/2013.
[1.2] IEEE, ‘Smart Grids, IEEE Transactions on’, 2010. Available at: http://ieeexplore.ieee.org/xpl/RecentIssue.jsp?punumber=5165411, accessed: 10/09/2013.
[1.3] M. Shahidehpour, "Editorial", Smart Grid, IEEE transactions on, vol. 1, pp. 1-2, 2010.
[1.4] A. Boston, "Delivering a secure electricity supply on a low carbon pathway,"
Energy Policy, vol. 52, pp. 55-59, 2013.
[1.5] DECC, “Electricity Generation Costs”, London, 2012.
[1.6] European Commission, “Renewable Energy Road Map Renewable energies in the 21st century: building a more sustainable future”, London, p. 21, 2006. [1.7] European Commission, “Directive of the European Parliament and of the
Scotland”, Edinburgh, 2011.
[1.9] Department of Energy and Climate Change, "UK renewable energy roadmap", London, 2011.
[1.10] P. Djapic, C. Ramsay, D. Pudjianto, G. Strbac, J. Mutale, N. Jenkins, et al., "Taking an active approach," Power and Energy Magazine, IEEE, vol. 5, pp. 68-77, 2007.
[1.11] N. Jenkins, R. Allan, P. Crossley, D. Kirschen, and G. Strbac, Embedded Generation. London: IEE, 2000.
[1.12] The Orcadian, (14/08/2013), “SHEPD energies UK's first grid battery in Orkney”. Available at: http://www.orcadian.co.uk/2013/08/shepd-energises-uks-first-grid-battery-in-orkney/, accessed 10/09/2013.
Chapter 2:
Active Network
Management and smart
distribution networks
CTIVE NETWORK MANAGEMENT is an instance of the smart grid. It relates
to the infrastructure, technology and techniques needed to make electrical distribution networks both dynamic and able to respond to the challenge of distributed generation and changing demand patterns. It moves away from the paradigm of passive fit-and-forget distribution networks in which power flows from the transmission network out to the load. It is also a requirement if the capacity of distributed generation is to be increased beyond the firm limit and it is therefore important for the growth of distributed renewable generation, particularly on-shore wind power.
This chapter introduces the concepts and technologies of ANM and puts them within the wider context of the smart grid. It provides a summary of the key technologies and techniques required for ANM, before giving case studies of existing ANM and other smart distribution schemes in the UK and elsewhere.
This chapter also attempts to understand the role of ANM schemes in gaining the greatest benefit from wind generation. Firstly by allowing more distributed wind capacity onto the network, and secondly by managing that generation capacity and other components of smart distribution networks.
often privately owned. This can be contrasted with international developments in active distribution networks which include examples that take a more distributed approach to control, for example the Olympic Peninsula project’s use of variable pricing in the USA [2.1].
Existing ANM schemes such as on the Orkney Islands that operate in real-time by continual monitoring and control of power flows and generator outputs. The chapter identifies that the introduction of intertemporal technologies such as energy storage and flexible demand requires that ANM controllers will need to include the ability to schedule devices ahead of real-time. Such ANM schemes are designated as second-generation ANM. This chapter justifies the need to develop tools and techniques suitable for analysing such second-generation ANM schemes.
2.1
Active Network Management: A definition
Distribution networks have traditionally been passively operated. That is, they have contained relatively few controllable devices and those that they do contain require no communications infrastructure. A key reason for this is reliability: a system with fewer complex parts is likely to have less to go wrong with it. Secondly, greater complexity was not required: the role of distribution networks was to transfer power from the transmission network to customers, with power flowing in one direction. Power system engineers, working on the assumption of one-way power flow, have been able to design simple and effective systems to meet this objective.
networks” ([2.2], page 3). This is a change in philosophy for distribution network operation, away from a fit-and-forget strategy, where minimal control or intelligence is required for secure operation, towards a strategy of real-time connect-and-manage
incorporating monitoring and control technologies. It is a requirement if we wish to make greater use of distribution networks for connecting renewable generation. The term Active Network Management itself is regularly used in the UK, although it remains relatively vaguely defined. In [2.3] it is defined as “Pre-emptive operation… to maintain networks within accepted operating parameters”.
This broad definition overlaps with network protection and other forms of
network automation. It also disregards the fact that ANM should be actively
facilitating the meeting of objectives rather than simply maintaining limits. There
is a significant difference between ensuring that voltage stays within acceptable
bounds, and actively manipulating voltage to ensure the greatest capacity of
distributed generation can be connected.
In [2.4] an extended interim definition for ANM is presented. The key aspect is
that “ANM is understood to mean systems that operate to take action
automatically to maintain networks within their normal operating parameters”
([2.4], page 6). It goes on to specify the difference between protection and ANM:
protection is specifically for fault conditions, whereas ANM involves pre-emptive
action. The definition discusses the relevance of ANM to distributed generation
but does not include it formally in its definition.
In [2.5], active networks are simply defined as a solution to the problems posed
by reaching the levels of distributed generation “proposed over the coming years”
Finally, a report on active distribution networks discussed definitions from
respondents to a questionnaire [2.6]. From the 8 responses listed, an analysis leads
to the following combined definition:
“Active Distribution Networks (ADNs) have systems in place to control a combination of distributed energy resources (DERs), defined as generators, loads and storage. Distribution system operators (DSOs) have the possibility of managing the electricity using a flexible network topology. DERs take some degree of responsibility for system support, which will depend on a suitable regulatory environment and connection agreement.” (from [2.6], page 16)
The common factors of these definitions are: (a) the real-time or pre-emptive
nature of ANM intervention; (b) the differentiation from protection systems; and
(c) the management of constraints.
In this thesis these three common factors are used as a base of a definition but are
extended to note explicitly the role that ANM systems can play in meeting
network objectives, rather than simply maintaining limits. The initial working
definition for current Active Network Management used in this thesis is given in
box 1; the definition is revisited at the end of this chapter in light of the future
developments of second-generation ANM discussed.
Active Network Management means the use of any technology or technique applied to a distribution network that involves controlling the operation of network components in response to measurements in real-time to maintain limits and support wider network objectives.
The technologies used in ANM may vary and this definition is broad enough to ensure that ANM can be used in a range of situations to achieve a wide variety of goals, whether simply constraint management, or more complex goals such as optimisation of a network towards a particular objective. Figure 4 illustrates the position of ANM within the control hierarchy of a distribution network. It shows the overlap with both protection at the lower end and centralised control systems at the higher end (SCADA, Distribution Management System (DMS) or Energy Management Systems (EMS)). The ANM scheme is subordinate to the SCADA/DMS/EMS control system but the overarching ANM decisions are still made by a centralised controller. The control of individual elements is distributed to local controllers for example at the generators which responds to signals from the central controller. In addition, local controllers have fail-safe control actions to implement when communication are lost.
Figure 4: The place of ANM relative to other distribution network control systems (adapted from [2.7])
2.2
Technologies and techniques for Active Network
Management
of technology, such as reactive power compensation, a new way of operating an existing piece of hardware such as a transformer, or the introduction of a technique to manage other parts of the network, such as demand.
This section presents the key technologies and techniques that have so far been deployed or proposed, together with others that have the potential to support the ANM philosophy in the future. The techniques covered include: voltage management, generation curtailment, dynamic line ratings, energy storage, direct demand-side management and dynamic pricing. One way to categorise the techniques is as time-independent, and time-dependant. Time-independent techniques are those whose operation at one point in time does not affect operation at other times; conversely time-dependant techniques are those that cannot be operated at one time without consideration of operation at other times.
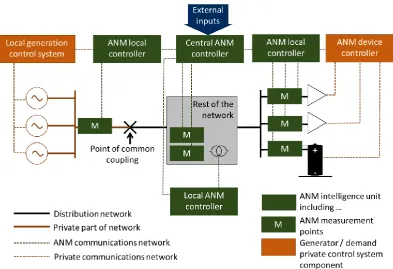
As noted in the working definition of ANM (Box 1, see section 2.1), schemes require measurement and control systems. Taking measurements across a geographically dispersed system and combining them also requires a robust communications system. These systems: control, measurements, and communication are prerequisites for the deployment of any of the techniques listed below, and are mirrored in other smart grid applications.
Figure 5: Schematic of the elements required for an ANM scheme as part of a distribution network.
2.2.1
Generation curtailment
Traditionally operated distribution networks have strictly limited capacities of distributed generation. This limit is defined by considering the ability of the distribution network to securely manage the output of all distributed generation
during the worst case scenario and with no intervention. The worst case situation is generally low demand and full distributed generation output. During these situations two effects tend to limit distributed generation: thermal export limits from the distributed generator; and the voltage rise effect [2.8].
Thermal limits: are created by the finite capacity of overhead lines, cables and
a feeder. This severely limits the capacity of distributed generation that can connect at the extremities.
Voltage rise effect: Power flows from high voltage to low voltage. When built, the design of networks made use of this fact, with voltages set relatively high within the allowed limits in the centre and allowed to drop at the extremities. On load tap changing transformer and voltage regulators can be used to raise the voltage if it drops below the minimum limit at the extremes, however these devices generally have a fixed target voltage on the downstream side and are controlled to maintain this (again to allow outward power flow). Distributed generation leads to power flow up towards the centre, and therefore must raise the voltage at the extremes. Excess generation at the extremes can raise the voltage above allowed limits at the location of the generator, and the voltage rise problem can be made more severe by the action of transformers [2.8, 2.9].
The maximum capacity of firm generation on a distribution network - that is generation that is guaranteed network access at all times - is defined as the maximum injection of power that can be accommodated during minimum demand without breaching voltage and thermal limits. This limits the capacity by considering demand levels that may occur for only a few hours a year. The rest of the time, greater injections of power from distributed generators is possible. When the majority of distributed generation is from wind generation, for long periods the wind generators are not able to generate at full power due to a lack of wind. The average UK capacity factor for on-shore wind generation was 0.27 during 2011 [2.10].
The reality of implementing a generation curtailment system requires consideration of a variety of issues: communications latency, speed and reliability; speed of response from turbines; the uncontrolled rate of change of demand and generation; and failure to safe state [2.11-2.13].
2.2.1.1 Non-firm contracts and principles of access
The curtailment of distributed generation requires new operating principles. One method of implementing curtailment is through a contract referred to as non-firm as it is a contract which does not provide firm network access at all times [2.11]. With multiple non-firm generators, the rules defining which generators receive access to a constrained network must be laid out in a principle-of-access which defines the commercial arrangement [2.14].
A number of principles-of-access have been identified for non-firm generators in an ANM scheme, for example in [2.14]. However, only one has been implemented to date: priority order principle-of-access in the form of Last-In-First-Out (LIFO) [2.15]. In [2.16] the following principles for commercial arrangements are listed: they should be safe and secure; equitable and efficient; transparent; feasible and in line with the grid code, distribution codes, and relevant legislation. Some identified principles of access are:
the maximum capacity of distributed generation connecting as late connections will receive very restricted network capacity.
- Shared Percentage: A shared percentage scheme ensures that curtailment is equally shared between all generators contributing to a constraint. This has the advantage that no one generator is excessively constrained and it is more likely than LIFO to lead to the maximum viable capacity connecting. However as more generators connect, leading to increased curtailment, existing generators will find their curtailment levels rising. This uncertainty in future network access is likely to be a deterrent to investment.
- Market-Based Methods: Network capacity can be considered as an economic good of limited supply. Generators can be required to bid either for access to network (the right to generate) or alternatively to offer to be curtailed. Implementing a market mechanism is likely to find favour within the current climate of liberalised energy markets, however as noted in [2.14] it may be too complex to implement in relatively small scale distribution networks.
- Technical Best: A technical best principle-of-access will allow the distribution network operator to define the best way of dispatching the network functioning under the current conditions and to impose that solution on generators. The definition of technical best may include minimisation of losses or most secure operation. Such a principle-of-access has the advantage of providing strong signals to developers as to where to develop - as a generator connected in a location that is often ‘technically bad’ is likely to receive high levels of curtailment.
curtailment levels, and discusses a number of possibilities for getting around this commercially. It recommends two implementations of shared percentage. Firstly to pre-define a maximum level of curtailment then allow generators to connect until curtailment for all non-firm generators reaches that limit. This limit is defined as the curtailment level at which the cost of curtailment outweighs the cost of network reinforcement. This highlights the role of ANM in deferring reinforcement cost. The second method is a capacity auction in which, once accepted for connection, generators bid for the annual level of curtailment they would be prepared to accept. The report highlights the difficulty in maintaining the principles of fairness and simplicity and at the same time ensuring efficiency of network use.
2.2.2
Co-ordinated voltage control
Voltage management is a significant issue for all distribution networks. The main method of controlling voltage across a traditional passive distribution network is through on-load-tap-changing transformers which are controlled based on the local voltage. Local voltage control makes use of the assumption of one-way power flow. If this assumption is not valid it significantly reduces the usefulness of local voltage control; the fact that power flows, and therefore voltage ramps can be in either direction along a radial feeder means that using the local voltage to control on-load-tap-changing may no longer be feasible.
The addition of communications infrastructure which comes with an ANM scheme allows the control of transformers and voltage regulators in response to remote voltage or generator outputs. Such a scheme is known as co-ordinated voltage control.
shows that area based control can significantly decrease the curtailment required for non-firm generation. For example a 3MW wind farm would suffer 2500MWh of curtailment without voltage control, but this reduces to just 90MWh with area based control from a remote on-load-tap-changing transformer.
2.2.3
Reactive power dispatch of distributed generation
Figure 6: Summary of key wind turbine generator types. (Adapted from [2.22])
The inclusion of power electronic converters in doubly-fed induction or fully-rated machines allows for the dispatch of reactive power. A fully-rated convertor based machine can technically be able to provide full 4-quadent power control operating up to its rated apparent power at any power factor through the power electronic interface [2.23] and a doubly fed induction machine can provide between reactive power between 0.5 and 1 per unit depending on the real power output [2.21].
Using reactive power dispatch, or power-factor control of wind turbines in an active network management context has been presented in a number of studies, see for example in [2.25-2.27]. Allowing centralised, or co-ordinated dispatch of reactive power from distributed generation, combined with centralised control of on-load tap-changing transformers and other reactive power devices can provide a powerful method of increasing the ability of a network to deal with voltages.
In [2.28] power factor control of distributed wind generation is studied in terms of its ability to increase the viable distributed wind capacity that can connect to a particular distribution network. The study is a multi-period optimal power flow study (see Chapter 3) which combines power-factor control of distributed wind generation, co-ordinated control of on-load tap-changing transformers and generation curtailment. If generation curtailment is not allowed, the combination of co-ordinated control of transformers and power factor control of distributed generation raises the viable capacity from 29.6MW (at the best fixed power factor) to 39.4MW, an increase of 33%.
2.2.4
Energy storage
Electricity is the ultimate perishable good. In most power systems its production and consumption must be matched near-perfectly on a second-by-second basis. This means balancing the conversion of the primary energy resource to the final energy demand across the network. Operating such a system securely leads to many additional costs beyond those associated with direct electricity generation: the cost of providing spinning reserve and ancillary services which hedge against faults and outages is a significant percentage of the total operating cost.
Energy storage is able to reduce some of these costs by providing a method for storing energy from the electricity system and returning it later. Until recently the only technology capable of large-scale energy storage has been pumped-hydro. Today there are a range of developing technologies able to bulk time-shift energy with capacities of multiple MW and MWh. These include compressed air stores and battery technology (sodium sulphur, lead acid, lithium ion, nickel cadmium and flow-batteries) [2.29-2.32].
The first grid scale battery energy storage device connected to an ANM scheme was energised in mid-2013 on Orkney [2.33]. Over the coming year a battery is likely to be deployed in the ANM scheme being developed on the Shetland Islands [2.34].
2.2.5
Dynamic pricing and flexible demand
The concept of real-time pricing of electricity has been part of the wholesale electricity market since liberalised-electricity markets were introduced. However, small consumers have been excluded from this and are generally presented with fixed price or two-tier tariffs from electricity suppliers. This contributes to the almost complete inelasticity of demand for electricity seen in many power markets [2.35].
The introduction of dynamic pricing to distribution level customers has the potential to allow consumers to respond either manually or through automated smart meter control systems to price signals in close to real-time.
to make greatest use of available wind generation. An interruptible load management trial has been applied to non-domestic demand for electricity in [2.37].
2.2.6
The wider energy system
The electrical network forms only a part of the energy system, other components include heat provision, transport and the gas network. The overall aim of energy policy is to balance the competing objectives of the energy trilema (see Chapter 1) across all aspects of energy. For example the EU 2020 targets for renewable generation is set as a percentage of total energy demand rather than total electrical demand [2.38]. The linkages between the electrical network and demand for heat and transport are likely to increase in the decades to come. This is partly due to the maturity of renewable electrical generation as opposed to other energy sectors: between 2004 and 2014 UK installed wind capacity rose from 809MW to over 10,00MW. [2.39, 2.40]. The link between electricity and heat systems is already apparent in areas with limited gas supply. In these areas, electrical heating is used in a significant fraction of houses – for example 28% in the Highlands of Scotland [2.41]. Storage heaters provide some level of flexible demand for electricity through the ability to store heat energy. As the technology is simply a resistive element, electric boilers are effectively 100% efficient at converting electricity to heat. Despite this, a significant improvement in the use of electricity can be achieved by using heat pumps.
As heat pumps use electricity to ‘pump’ heat from cool to warm areas they can output significantly higher quantities of useful heat than the quantity of electrical energy used. The ratio of useful heat energy out to electrical energy used is known as the coefficient of performance, and heat pumps can in some instances achieve coefficient of performance well in excess of unity [2.42]. In recent years heat-pump technologies have been used, notably in Scandinavian countries. Studies of the Danish power system have highlighted electric boilers and heat storage as low cost solutions in
terms of managing fluctuating renewable energy sources [2.43]. Heat pumps are
![Figure 1 : The energy trilemma showing the three competing objectives of modem energy policy which lead towards a sustainable system (adapted from [1.4])](https://thumb-us.123doks.com/thumbv2/123dok_us/1634509.116743/20.595.222.413.133.266/figure-energy-trilemma-showing-competing-objectives-sustainable-adapted.webp)
![Figure 4: The place of ANM relative to other distribution network control systems (adapted from [2.7])](https://thumb-us.123doks.com/thumbv2/123dok_us/1634509.116743/37.595.150.488.407.569/figure-place-relative-distribution-network-control-systems-adapted.webp)
![Figure 6: Summary of key wind turbine generator types. (Adapted from [2.22])](https://thumb-us.123doks.com/thumbv2/123dok_us/1634509.116743/45.595.219.424.88.412/figure-summary-key-wind-turbine-generator-types-adapted.webp)
![Figure 7: Outline of the Orkney Islands Distribution network (taken from [2.64])](https://thumb-us.123doks.com/thumbv2/123dok_us/1634509.116743/54.595.221.420.80.349/figure-outline-orkney-islands-distribution-network-taken.webp)