Ethnic differences and socio-demographic
predictors of illness perceptions, self-management,
and metabolic control of type 2 diabetes
Abdul-Razak Abubakari1 Martyn C Jones2
William Lauder3 Alison Kirk4 John Anderson5 Devasenan Devendra6 Ebrahim K Naderali1
1School of Health Sciences, Liverpool
Hope University, Hope Park, Liverpool, 2School of Nursing and
Midwifery, University of Dundee, Dundee, 3School of Nursing and
Midwifery and Health, University of Stirling, Stirling, 4Department
of Sport, Culture and the Arts, University of Strathclyde, Glasgow,
5Homerton University Hospital NHS
Trust, Homerton Row, London,
6West Hertfordshire Hosptials NHS
Trust, Watford, UK
Correspondence: Abdul-Razak Abubakari School of Health Sciences,
Liverpool Hope University, Hope Park, Liverpool, UK
Email [email protected]
Objectives: This study investigated ethnic differences in diabetes-specific knowledge, illness perceptions, self-management, and metabolic control among black-African, black-Caribbean,and white-British populations with type 2 diabetes. The study also examined associations between demographic/disease characteristics and diabetes-specific knowledge, illness perceptions, self-management, and metabolic control in each of the three ethnic groups.
Design: Cross-sectional
Setting: Diabetes/retinal screening clinics in Hackney and Brent, London.
Methods: Black-African, black-Caribbean and white-British populations with type 2 diabetes were asked to participate. Questionnaires measuring demographic/disease characteristics, diabetes-specific knowledge, self-management, and illness perceptions were used for data collection. Data for glycated hemoglobin (HbA1c) and microvascular complications were obtained from medical records. Ethnic differences in diabetes-related measures were estimated using analysis of variance/covariance. Multiple regression techniques were used to determine relation-ships between demographic/disease characteristics and measured diabetes-related outcomes. Results: Three hundred and fifty-nine patients participated in the study. White-British participants had high diabetes-specific knowledge compared to their black-African and black-Caribbean counterparts. Black-Africans reported better adherence to self-management recommendations than the other ethnic groups. Compared to the white-British patients, black-African and black-Caribbean participants perceived diabetes as a benign condition that could be cured. Educational status and treatment category were determinants of diabetes-specific knowledge in all three ethnic groups. However, different demographic/disease characteristics predicted adherence to self-management recommendations in each ethnic group.
Conclusion: Clearly, there is disease (diabetes) knowledge-perception variation between different ethnic groups in the UK which may partly influence overall disease outcome. It is plausible to recommend screening, identifying, and dispelling misconceptions about diabetes among ethnic minority patients by health care professionals as well as emphasizing the importance of self-management in managing chronic diseases such as diabetes.
Keywords: black-African, black-Caribbean, white-British, diabetes, illness perceptions, self-management
Introduction
Diabetes has become a global epidemic with over 371 million people affected worldwide.1 As a result of the sustained hyperglycemia that often characterizes
the condition, people with diabetes have a high risk of developing microvascular and macrovascular complications in the long term.2 These complications include
retinopathy, neuropathy, nephropathy, cerebrovascular, and cardiovascular diseases.
O R I G I N A L R E S E A R C H
open access to scientific and medical research
Open Access Full Text Article
Number of times this article has been viewed
This article was published in the following Dove Press journal: International Journal of General Medicine
In fact, diabetes is the second biggest cause of cardiovascular disease in the UK and a major cause of death and disability in most developed countries.3,4
To avoid or minimize the risk of diabetes complications, patients are encouraged to play an active role in the day-to-day management of their condition, a phenomenon referred to as self-management.5 The Recommended Diabetes
Management (DSM) activities include dietary planning, regu-lar exercise, blood glucose monitoring, and where applicable, appropriate use of oral-hypoglycemic or insulin medication.6
Patients need to self-regulate if they are to successfully inte-grate DSM activities into their daily routines. The required adjustments in daily routines may be considerable for many patients. Thus, adherence to DSM recommendations may be influenced by patients’ social, cultural, and psychologi-cal experiences.7 Moreover, self-management is a complex
phenomenon and patients need various skills to optimally engage in it. Some of the skills required include some level of health literacy and knowledge about the disease, problem-solving, planning, and decision-making skills.
Depending on the country, time of classification (eg, census year) or route of migration (eg, directly from Africa or via the Caribbean), people of African ancestry are identified by different terminologies in various epidemiological literature.8 For example, some of the more recent
termi-nologies used to describe African-origin populations include black-African, black-Caribbean, or African-Caribbean in the UK and African-Americans in the US.
Irrespective of their location, African-origin populations have a higher risk of developing diabetes and its microvascular complications compared to their European-origin counterparts. For example, compared to the general populations of the US, UK, or Australia, the prevalence of diabetes is higher among African-origin populations.9–11 African-origin populations
also have higher rates of diabetes microvascular complica-tions, including diabetic nephropathy.12,13
The ethnic differences in the prevalence of diabetes may partly be explained by variations in genetic predisposition and/or disparities in the general distribution of behavioral risk factors such as ‘unhealthy’ dietary practices. Data from the US indicate that African-origin patients have poorer diabetes control outcomes compared to non-Hispanic white Americans.14 Nonetheless, it is important to note that the
reasons for the variations in the risk of diabetes complica-tions are generally not clear and that variacomplica-tions in diabetes-related outcomes are not fully explained by self-management behaviors.15 In some specific populations (mainly
European-origin), the illness perceptions of people with diabetes are
found to predict adherence to DSM recommendations or glycemic control.16 Investigating ethnic differences in illness
perceptions about diabetes may therefore help to explain some of the observed disparities in self-management and metabolic control of diabetes.14,17 Thus, this study was
designed to answer the following research questions: 1. Do differences exist in diabetes-related knowledge, illness
perceptions, self-management, or glycated hemoglobin (HbA1c) levels between black-Africans, black-Caribbean, and white-British patients?
2. Which demographic/disease characteristics predict diabetes-specific knowledge, self-management, or HbA1c levels in each of the three ethnic groups?
3. Do illness perceptions of people with diabetes in any of the three ethnic groups predict their HbA1c levels or microvascular complication status?
Methods
Participants and procedures
People with type 2 diabetes who attended diabetes and retinal screening clinics between February and June 2008 in the London Boroughs of Brent and Hackney were recruited for this study. The two Boroughs have higher proportions of African-origin populations compared to other locations in the UK.18 Patients who were adults ($18 years), capable of
for the study was granted by the Brent and East London Ethics Committees. The methods for this study have already been reported elsewhere.19
Study questionnaires
A demographic questionnaire was designed to capture data on the age, gender, educational status, ethnicity, duration and type of treatment for diabetes, and number of years resident in the UK. Diabetes-specific knowledge, self-management, and illness perceptions were measured using the brief diabetes knowledge test (DKT),20 the summary
of diabetes self-care activities (SDSCA),21 and the revised
illness perceptions (IPQ-R)22 questionnaires, respectively.
All the three instruments have been validated and found to have acceptable psychometric properties among people with diabetes.20–22
The brief DKT is a 23-item tool with two sub-scales (14-item general and nine-item insulin use sub-scales). The 14-item general knowledge sub-scale was used in this study, as it is suitable for use with type 2 diabetes patients. The questionnaire requires patients to demonstrate from multiple choice questions, what they think are the correct responses about diabetes and its management. The SDSCA has eleven core items which ask patients to indicate how many of the last 7 days they have performed the recommended dietary, exercise, self-monitoring of blood glucose (SMBG), and foot self-management activities. Overall DSM in this study was computed by adding up patients’ responses for dietary, exercise, SMBG, and foot self-management. The IPQ-R measures both cognitive and emotional dimensions of illness perceptions using nine sub-scales. The sub-scales include: identity (the symptoms or labels patients associate with their diabetes), timeline-acute/chronic (patients’ opinions as to whether their diabetes is a long-term or a short-term condition), timeline-cyclical (patients’ perceptions about the stability or changeability of their illness symptoms), conse-quences (patients’ perceptions of the impact the illness has on their lives, their finances, and their close associates), personal control (patients’ perceived control over their diabetes), treat-ment control (patients’ perceptions about the effectiveness of their treatment in controlling or curing their diabetes), illness coherence (the consistency of patients’ understanding about the illness), emotional representation (patients’ mood or feelings about the illness), and cause (patients’ beliefs in relation to the possible causes or attributions of their diabetes). Questions for all the subscales (except identity) have five-point Likert-type responses (strongly disagree; disagree; neither agree nor disagree; agree; strongly agree).
The identity subscale has 14 items and each question is scored by a ‘yes’ or ‘no’ response. The IPQ-R has recently been found to be acceptably valid and reliable among African-origin populations with diabetes.23
As demonstrated among Tongans,24 ‘God’s will’ was
added to the list of 18 causal items contained in the IPQ-R. This addition was informed by our knowledge of the existing literature, which identifies religion as a crucial determinant of how African-origin populations cope with illnesses.25 Similar
to the brief illness perception questionnaire,26 an overall
illness perception score (IPS) was computed by reversing participants’ scores for personal control, treatment control, and illness coherence perceptions and adding them to the scores for identity, timeline-acute/chronic, consequences, timeline-cyclical, and emotional representation.26 The IPS
indicates the extent to which patients perceive their illness to be life threatening. Low scores indicate benign perceptions whereas high scores indicate life-threatening perceptions.
Statistical analysis
Data were entered into SPSS (v 16; SPSS, Inc, Chicago, IL, USA) for statistical analysis. For continuous variables such as age and HbA1c, group differences were investigated using analysis of variance (ANOVA). Bonferroni post-hoc proce-dures were performed to reveal specific differences between individual groups in ANOVA. To minimize the potential for confounding, analysis of covariance (ANCOVA) was used to adjust for statistically significant between-group differ-ences in demographic variables such as age and duration of diabetes. Bivariate correlations were used to investigate relationships between variables. The enter method was used for identifying potential demographic/disease char-acteristics that predicted various outcomes in multiple regression analysis. In order to reduce losses in degrees of freedom and statistical power, only independent variables that were significantly correlated (or had a correlation coef-ficient $0.15) with the appropriate outcome variables were entered into the regression model.27 Dummy variables were
0 5 10 15 20 25 30 35 40 45 50
Stress/worry Mental attitude Family problems/worries
Overwork Emotional state My personality
Number of patients (%
)
White-British Black-Caribbean Black-African
† **
† *
[image:4.612.90.505.54.282.2]Perceived cause
Figure 1 Perceived psychological causes of diabetes by ethnicity.
Notes:†Significant linear trend; *P# 0.03; **P# 0.01; for significant differences between ethnic groups (P-values are from chi-square tests).
0 10 20 30 40 50 60 70 80
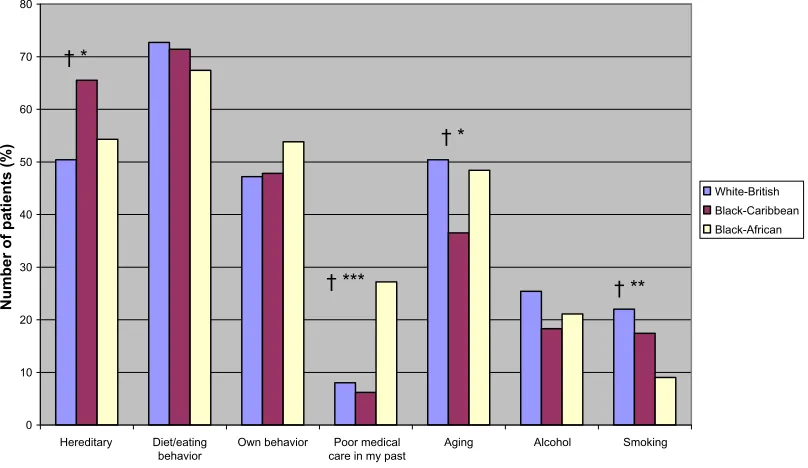
Hereditary Diet/eating
behavior Own behavior care in my pastPoor medical Aging Alcohol Smoking
Number of patients (%
)
White-British Black-Caribbean Black-African
† *
† ***
† *
† **
Figure 2 Perceived risk factor causes of diabetes by ethnicity.
Notes:†Significant linear trend; *P# 0.03; **P# 0.01; ***P# 0.001; for significant differences between ethnic groups (P-values are from chi-square tests).
the potential for type 1 errors due to multiple testing, we considered P-values #0.03 as significant. As reported elsewhere,19 the initial determination of sample size based
on the effect size of 0.30 for correlations between illness perceptions and self-management, found that a minimum of 82 participants were required for each ethnic group to achieve 80% power.
Results
Demographic/disease characteristics
[image:4.612.97.501.450.684.2]0 5 10 15 20 25 30
Germ/virus Chance/bad luck Pollution Accident/injury Altered immunity God's will
Number of patients (%
)
White-British Black-Caribbean Black-African † *
[image:5.612.83.549.53.321.2]† **
Figure 3 Perceived other causes of diabetes by ethnicity.
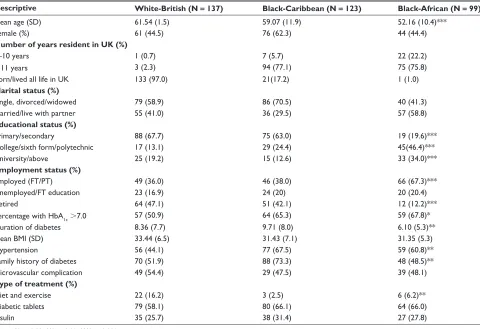
Notes:†Significant linear trend; *P# 0.03; **P# 0.01; for significant differences between ethnic groups (P-values are from chi-square tests). Table 1 Demographic/disease characteristics of participants by self-reported ethnicity
Descriptive White-British (N = 137) Black-Caribbean (N = 123) Black-African (N = 99)
Mean age (SD) 61.54 (1.5) 59.07 (11.9) 52.16 (10.4)***
Female (%) 61 (44.5) 76 (62.3) 44 (44.4)
Number of years resident in UK (%)
1–10 years 1 (0.7) 7 (5.7) 22 (22.2)
.11 years 3 (2.3) 94 (77.1) 75 (75.8)
Born/lived all life in UK 133 (97.0) 21(17.2) 1 (1.0)
Marital status (%)
Single, divorced/widowed 79 (58.9) 86 (70.5) 40 (41.3)
Married/live with partner 55 (41.0) 36 (29.5) 57 (58.8)
Educational status (%)
Primary/secondary 88 (67.7) 75 (63.0) 19 (19.6)***
College/sixth form/polytechnic 17 (13.1) 29 (24.4) 45(46.4)***
University/above 25 (19.2) 15 (12.6) 33 (34.0)***
Employment status (%)
Employed (FT/PT) 49 (36.0) 46 (38.0) 66 (67.3)***
Unemployed/FT education 23 (16.9) 24 (20) 20 (20.4)
Retired 64 (47.1) 51 (42.1) 12 (12.2)***
Percentage with HbA1c.7.0 57 (50.9) 64 (65.3) 59 (67.8)*
Duration of diabetes 8.36 (7.7) 9.71 (8.0) 6.10 (5.3)**
Mean BMI (SD) 33.44 (6.5) 31.43 (7.1) 31.35 (5.3)
Hypertension 56 (44.1) 77 (67.5) 59 (60.8)**
Family history of diabetes 70 (51.9) 88 (73.3) 48 (48.5)**
Microvascular complication 49 (54.4) 29 (47.5) 39 (48.1)
Type of treatment (%)
Diet and exercise 22 (16.2) 3 (2.5) 6 (6.2)**
Diabetic tablets 79 (58.1) 80 (66.1) 64 (66.0)
Insulin 35 (25.7) 38 (31.4) 27 (27.8)
Note: *P# 0.03; **P# 0.01; ***P# 0.001.
[image:5.612.77.557.363.692.2]The duration of diabetes was shorter in black-Africans but there was no difference in average body mass index between groups. Also, the proportions of participants on insulin and hypoglycemic agents were similar across ethnic groups. However, smaller proportions of black-African and black-Caribbean participants were on lifestyle only (diet and exercise) treatments.
Ethnic differences in knowledge,
illness perceptions, self-management,
and metabolic control
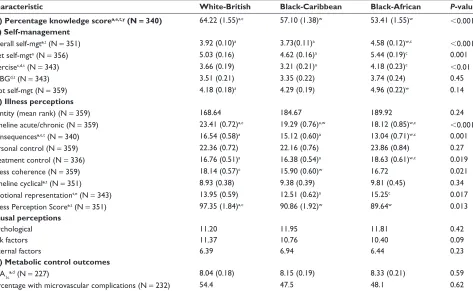
To ensure that ethnic differences in measured variables were not confounded by demographic/disease characteristics, correlation coefficients between the two sets of variables were first produced. Subsequent comparisons between ethnic groups then took into account demographic/disease characteristics that were found to significantly correlate with the measured variable of interest. Table 2 shows the mean scores for knowledge, illness perceptions, and DSM by ethnic group. White-British participants had higher dia-betes knowledge scores compared to their black-African
(11% point difference) and black-Caribbean (7% point difference) counterparts. There was no statistically significant difference in diabetes knowledge between black-African and black-Caribbean participants.
The three ethnic groups also differed in their levels of adher-ence to DSM recommendations (Table 2B). Black-Africans had higher overall DSM scores compared to the other two groups. Black-Africans also reported higher adherence to dietary and exercise self-management recommendations com-pared to black-Caribbean patients and higher adherence to foot management compared to white-British patients. Generally, black-Caribbean participants had lower adherence scores for most aspects of DSM regimen, except foot management.
[image:6.612.64.537.390.681.2]As seen in Table 2C, there were no ethnic differences in the perceptions of diabetes regarding symptom load (identity), patients’ perceived control over diabetes (personal control), or their perception of the stability or otherwise (timeline-cyclical) of diabetes. However, illness perceptions differed by ethnic groups in all other dimensions. Compared to white-British, both black-Caribbean and black-Africans perceived diabetes as short term (timeline-acute/chronic) and benign
Table 2 Ethnic differences in diabetes-specific knowledge, illness perceptions, self-management, and metabolic control outcomes
Characteristic White-British Black-Caribbean Black-African P-value
(A) Percentage knowledge scorea,e,t,y (N = 340) 64.22 (1.55)a,c 57.10 (1.38)w 53.41 (1.55)w ,0.001 (B) Self-management
Overall self-mgta,t (N = 351) 3.92 (0.10)a 3.73(0.11)a 4.58 (0.12)w,c ,0.001
Diet self-mgta (N = 356) 5.03 (0.16) 4.62 (0.16)a 5.44 (0.19)c 0.001
Exercises,d,t (N = 343) 3.66 (0.19) 3.21 (0.21)a 4.18 (0.23)c ,0.01
SMBGd,t (N = 343) 3.51 (0.21) 3.35 (0.22) 3.74 (0.24) 0.45
Foot self-mgt (N = 359) 4.18 (0.18)a 4.29 (0.19) 4.96 (0.22)w 0.14
(C) Illness perceptions
Identity (mean rank) (N = 359) 168.64 184.67 189.92 0.24
Timeline acute/chronic (N = 359) 23.41 (0.72)a,c 19.29 (0.76)a,w 18.12 (0.85)w,c ,0.001
Consequencesa,e,t (N = 340) 16.54 (0.58)a 15.12 (0.60)a 13.04 (0.71)w,c 0.001
Personal control (N = 359) 22.36 (0.72) 22.16 (0.76) 23.86 (0.84) 0.27
Treatment control (N = 336) 16.76 (0.51)a 16.38 (0.54)a 18.63 (0.61)w,c 0.019
Illness coherence (N = 359) 18.14 (0.57)c 15.90 (0.60)w 16.72 0.021
Timeline cyclicala,t (N = 351) 8.93 (0.38) 9.38 (0.39) 9.81 (0.45) 0.34
Emotional representationt,e (N = 343) 13.95 (0.59) 12.51 (0.62)a 15.25c 0.017
Illness Perception Scorea,t (N = 351) 97.35 (1.84)a,c 90.86 (1.92)w 89.64w 0.013 Causal perceptions
Psychological 11.20 11.95 11.81 0.42
Risk factors 11.37 10.76 10.40 0.09
External factors 6.39 6.94 6.44 0.23
(D) Metabolic control outcomes
HbA1ca,d (N = 227) 8.04 (0.18) 8.15 (0.19) 8.33 (0.21) 0.59
Percentage with microvascular complications (N = 232) 54.4 47.5 48.1 0.62
Notes:asignificantly different from black-Africans; csignificantly different from black-Caribbean; dadjusted for duration of diabetes; eadjusted for educational status; tadjusted
for treatment category; wsignificantly different from white-British; aadjusted for age; yadjusted for number of years resident in the UK. Please note that demographic/clinical
variables with significant between-group differences were adjusted in analysis of covariance. Adjustments were conducted if demographic/clinical variables were significantly associated with respective outcome variables (see details in statistical analysis in methods).
Table 3 Regression coefficients for predicting knowledge from demographic/disease characteristics for people with type 2 diabetes
Predictor variable B (SE) 95% CI P-value β Adjusted R2
(A) White-British (N = 126) 0.18
Duration of diabetes 0.20 (0.24) -0.28, 0.67 0.41 0.08
University vs primary/secondary 13.74 (3.64) 6.53, 20.94 ,0.001 0.32 College/sixth form vs primary/secondary 10.88 (4.18) 2.60, 19.16 0.01 0.22
Insulin vs food and exercise 12.69 (5.28) 2.24, 23.13 0.02 0.33
Diabetic tablet vs food and exercise 6.48 (4.12) -1.68, 14.64 0.12 0.19
(B) Black-Caribbean (N = 113) 0.15
Age -0.25 (0.13) -0.50, 0.00 0.05 -0.20
Duration of diabetes -0.15 (0.18) -0.51, 0.20 0.39 -0.09
Number of years lived in UK 0.47 (1.91) -3.31, 4.26 0.81 0.02
College/sixth form vs primary/secondary 8.55 (3.48) 1.64, 15.45 0.02 0.24
University vs primary/secondary 7.89 (4.08) -0.19, 15.97 0.06 0.18
(C) Black-Africans (N = 95) 0.10
Age -0.23 (0.15) -0.53, 0.08 0.14 -0.16
Duration of diabetes 0.31 (0.34) -0.37, 1.00 0.37 0.34
College/sixth form vs primary/secondary 5.40 (3.83) -2.20, 13.00 0.16 0.19
University vs primary/secondary 6.12 (3.97) -1.77, 14.02 0.13 0.20
Tablet vs diet 12.27 (5.64) 1.06, 23.49 0.03 0.42
Insulin vs diet 15.69 (6.74) 2.29, 29.08 0.02 0.50
Abbreviations: B, regression co-efficient; CI, confidence interval; SE, standard error; β, standardized regression co-efficient; vs, versus; R2, proportion of variance explained
by model.
(IPS). Compared to white-British and black-Caribbean partici-pants, black-Africans perceived their diabetes to have lesser consequences and could be controlled effectively or even be cured by their treatment. As recommended by the developers of the IPQ-R, a principal component analysis on the causal items resulted in three subgroups: psychological, lifestyle, and other causal beliefs. As shown in Table 2, no ethnic differences were found for the three composite cause subscales. However, there were a number of differences in the proportions of people who attributed their diabetes to individual cause items as shown in Figures 1–3. Considering the psychological items, higher proportions of black-African and black-Caribbean participants perceived their diabetes to be caused by family problems or other emotional issues compared to their white-British counterparts (Figure 1). Similar differences in causal attributions were also observed for pollution and ‘God’s will’ in the other causal beliefs (Figure 3).
After controlling for the differences in age and duration of diabetes, white-British participants had 0.29% and 0.11% lower HbA1c values compared to African and black-Caribbean participants, respectively. However, these differ-ences were not statistically significant (Table 2D).
Predicting knowledge, self-management,
and HbA
1clevels from demographic/
disease characteristics
Various demographic/disease characteristics were associ-ated with knowledge, IPS, self-management, or metabolic
control (HbA1c levels and microvascular complication status) in the multiple regression analyses. As seen in Table 3, only educational status or treatment category predicted knowledge about diabetes in any of the three groups. Compared to par-ticipants with primary/secondary education, white-British and black-Caribbean participants with university education had significantly higher diabetes-specific knowledge scores. Also, white-British and black-Africans who were treated with oral hypoglycemic agents or with insulin had signifi-cantly higher diabetes-specific knowledge scores compared to those who were treated with lifestyle only (diet/exercise) treatments.
Regressions for predicting self-management from demographic/disease characteristics are shown in Table 4. Older age in white-British and black-Caribbean participants was generally associated with higher adherence to DSM recommendations. Compared to those treated with diet/exercise alone, white-British patients treated with insulin also reported higher adherence to overall DSM and SMBG recommendations. Among black-Caribbean participants, longer residence in the UK was associated with lower adherence to overall, exercise, and foot DSM recommendations. Black-African participants with primary/secondary education adhered highly to dietary recommendations compared to those with higher levels of educational status.
Table 4 Regression coefficients for predicting self-management from demographic/disease characteristics for people with type 2 diabetes
Predictor variable B (SE) 95% CI P-value β Adjusted R2
(A) White-British
Overall DSM (N = 136) 0.10
Age 0.025 (0.01) 0.01, 0.04 0.001 0.28
Tablet vs diet 0.09 (0.26) -0.42, 0.60 0.73 0.04
Insulin vs diet 0.65 (0.29) 0.08, 1.23 0.03 0.25
Diet (N = 136) 0.03
Age 0.03 (0.01) 0.00, 0.05 0.04 0.18
Gender 0.37 (0.32) -0.27, 1.00 0.25 0.10
Exercise (N = 131) 0.02
Duration of diabetes -0.03 (0.03) -0.10, 0.03 0.27 -0.12
Tablet vs diet -0.11 (0.55) -1.21, 0.99 0.84 -0.02
Insulin vs diet -0.67 (0.72) -2.09, 0.76 0.36 0.13
SMBG (N = 129) 0.21
Duration of diabetes -0.02 (0.03) -0.08, 0.05 0.63 -0.05
Tablet vs diet 0.19 (0.55) -0.91, 1.28 0.74 0.04
Insulin vs diet 2.82 (0.72) 1.40, 4.25 ,0.001 0.49
Marital status -0.71 (0.40) -1.50, 0.07 0.08 -0.14
(B) Black-Caribbean
Overall DSM (N = 121) 0.11
Age 0.02 (0.01) 0.01, 0.04 0.01 0.23
Number of years lived in UK -0.37 (0.16) -0.69, -0.05 0.02 -0.20
Tablet vs food and exercise -0.81 (0.62) -2.04, 0.42 0.19 -0.30
Insulin vs food and exercise -0.38 (0.64) -1.64, 0.88 0.55 -0.14
Diet (N = 121) 0.05
Age 0.04 (0.01) 0.01, 0.07 ,0.01 0.26
Gender 0.00 (0.33) -0.65, 0.66 0.99 0.00
Exercise (N = 121) 0.12
Age 0.02 (0.02) -0.02, 0.05 0.33 0.09
Gender -1.06 (0.39) -1.83, -0.28 0.01 -0.23
Number of years lived in UK -0.69 (0.27) -1.23, -0.15 0.01 -0.22
Tablet vs diet v1.56 (1.06) -3.65, 0.53 0.14 -0.34
Insulin vs diet -2.11 (1.08) -4.25, 0.41 0.05 -0.45
SMBG (N = 116) 0.24
Age 0.02 (0.02) -0.02, 3.89 0.42 0.07
Gender 0.91 (0.44) 0.04, 1.78 0.04 0.17
Duration of diabetes 0.03 (0.03) -0.04, 0.10 0.37 0.09
Tablet vs diet -0.08 (1.33) -2.71, 2.55 0.95 -0.02
Insulin vs diet 2.12 (1.39) -0.63, 4.87 0.13 0.39
(C) Black-Africans
Diet (N = 96) 0.05
Age 0.02 (0.02) -0.02, 0.05 0.30 0.11
College/sixth form vs primary/secondary school -1.31 (0.49) -2.28, -0.34 0.01 -0.36 University vs primary/secondary school -1.15 (0.52) -2.17, -0.13 0.03 -0.30
SMBG (N = 96) 0.08
Duration of diabetes 0.01 (1.06) -0.10, 0.12 0.88 0.02
College/sixth form vs primary/secondary school 0.22 (0.67) -1.11, 1.55 0.74 0.04 University vs primary/secondary school 1.08 (0.70) -0.31, 2.46 0.13 0.21
Tablet vs diet 0.86 (0.98) -1.08, 2.81 0.38 0.17
Insulin vs diet 2.26 (1.15) -0.02, 4.54 0.05 0.41
[image:8.612.54.541.79.688.2]treated with insulin was associated with higher HbA1c (poorer glycemic control). Older age and female gender were associated with lower HbA1c levels (better glycemic control), whereas longer duration of diabetes was associated with higher HbA1c levels (poorer glycemic control) among black-Caribbean participants.
Predicting IPS from HbA
1clevels
and microvascular complication status
In white-British (B = 0.88, 95% CI: -1.96 to 3.72, β= 0.07,
P= 0.54), black-Caribbean (B = 2.28, 95% CI: -0.31 to 4.88, β= 0.20, P= 0.08), or black-Africans (B = 0.05, 95% CI: -0.02 to 0.11, β = 0.18, P = 0.14), HbA1c levels did not predict IPS. Also, microvascular complication of diabetes did not predict whether patients perceived their diabetes as benign or life threatening (IPS) in white-British (B =-1.05, 95% CI: -9.35 to 7.26, β=-0.03, P= 0.80), black-Caribbean (B = 2.66, 95% CI: -7.39 to 12.70, β= 0.07, P= 0.60), or black-Africans (B = 0.08, 95% CI: -0.14 to 0.31, β= 0.08,
P= 0.45).
Discussion
Summary and discussion of findings
Patients’ perceptions about illnesses, including diabetes, have been reported as key determinants in the way they adhere to treatment recommendations.28 Few studies have examined
variations in illness perceptions and diabetes self-manage-ment in relation to ethnicity.24,29 Thus far, none of these studies
have included participants of African ancestry with different experiences and history of migration. Exploring ethnic dif-ferences in illness perceptions can help explain difdif-ferences
in behaviors such as adherence to self-management, and by extension, variations in clinical outcomes such as metabolic control for diabetes.17 This study investigated ethnic
differ-ences in diabetes-specific knowledge, illness perceptions, adherence to DSM recommendations, as well as HbA1c levels. The study also examined the extent to which any of the diabetes-related outcomes above are influenced by demographic/disease characteristics.
Our results indicate that important differences exist, in relation to the way black-Africans, black-Caribbean, and white-British populations with diabetes perceive their con-dition and their adherence to DSM recommendations. Both black-African and black-Caribbean participants had poorer diabetes-specific knowledge than their white-British counter-parts. Black-Caribbean participants generally reported lower adherence to DSM recommendations. Compared to their white-British counterparts, both African and black-Caribbean participants perceived their diabetes as a short-term and benign condition, with less serious consequences. The results also indicate that, despite some similarities, significant differences exist among the three ethnic groups in relation to which demographic/disease characteristics predict knowledge, self-management, or metabolic control outcomes. For example, age, duration of diabetes, and educational status significantly contributed to variations in HbA1c levels among black-Caribbean participants, yet none of these factors predicted HbA1c levels in white-British or black-Africans. The finding that longer duration of residence in the UK was associated with poorer adherence to DSM recommendations in the black-Caribbean participants is worrying and further research to ascertain the reasons for
Table 5 Regression coefficients predicting HbA1c from demographic and clinical characteristics for people with type 2 diabetes
Predictor variable B (SE) 95% CI P-value β Adjusted R2
(A) White-British (N = 87) 0.12
Age -0.02 (0.01) -0.05, 0.01 0.16 -0.16
Duration of diabetes 0.01 (0.03) -0.04, 0.06 0.72 0.05
Tablet vs food and exercise 0.98 (0.48) 0.02, 1.94 0.05 0.32
Insulin vs food and exercise 1.64 (0.63) 0.39, 2,89 0.01 0.48
(B) Black-Caribbean (N = 73) 0.31
Age -0.06 (0.02) -0.09, -0.02 ,0.01 -0.39
Gender -0.87 (0.35) -1.56, -0.18 0.01 -0.25
Duration of diabetes 0.06 (0.03) 0.01, 0.12 0.03 0.30
College/sixth form vs primary/secondary 0.27 (0.45) -0.62, 1.16 0.54 0.07 University vs primary/secondary -0.06 (0.49) -1.05, 0.92 0.90 -0.01
Tablet vs diet 1.33 (0.84) -0.35, 3.02 0.12 0.39
Insulin vs diet 2.15 (0.91) 0.32, 3.96 0.02 0.60
(C) No demographic or clinical characteristic significantly predicted HbA1c in black-Africans
Abbreviations: B, regression co-efficient; CI, confidence interval; HbA1c, glycated hemoglobin; SE, standard error; β, standardized regression co-efficient; vs, versus;
this could be useful for planning diabetes education services for black-Caribbean patients.
The lower levels of diabetes-specific knowledge among black-Caribbean and black-Africans was perhaps not surpris-ing, given that several other studies have reported similar findings among minority ethnic populations, both in the UK and elsewhere.30,31 Irrespective of ethnicity, over 70% of the
participants failed to identify correctly questions related to: low calorie containing foods as the best diet for people with diabetes; food items not suitable for treating hypoglycemia; and what time period HbA1c reflects as a measure of diabetes control. These questions depict practical situations, which people with diabetes would be expected to face on a daily basis when fulfilling the self-management recommendations.6
For example, people with diabetes have to be conscious of the amount of calories they consume at any point in time. They are also required to consume calorie-rich diets, to avert imminent hypoglycemic attacks.
Intricately related to the knowledge deficit among black-Caribbean and black-Africans was their numerous misconceptions about diabetes (eg, perceiving diabetes as a short-term, curable condition, with less severe con-sequences). Similar misconceptions about diabetes have been reported in other indigenous or minority populations, including African-American patients.24,29,32 For instance,
compared to European-origin patients, Tongans in New Zealand perceived their diabetes as acute.24 Shorter-term
perceptions about diabetes have also been reported among Asian and Pacific Island patients compared to their European-origin counterparts.29 Perceiving diabetes as a short-term
condition is incompatible with the actual chronic nature of the condition. Secondly, the unrealistic expectation (belief) of a possible cure may result in disappointment, and its attendant psychological ramifications. Equally worrying is black-African and black-Caribbean patients’ perceptions that diabetes has less severe consequences. In fact, diabetes is a serious condition with debilitating consequences, and patients need to recognize this fact and pursue preventive behaviors, to help reduce its complications.28 It is not clear how
attrib-uting diabetes to factors such as ‘Gods will’ may influence patients’ self-management behaviors. However, research has shown that, patients who perceive their condition to be controlled by powerful others, are less likely to engage in health-related behaviors.33
Despite their low knowledge scores and numerous inconsistent beliefs about diabetes, black-Africans reported comparatively higher adherence to DSM recommendations. This finding may be explained by the fact that, although some
knowledge may be required to facilitate DSM, knowledge is not the main determinant of patients’ self-management behavior.34 It is also possible that black-Africans
uninten-tionally overestimated their self-management performance levels due to their poor knowledge about diabetes and what is involved in its management. For instance, some items in the SDSCA questionnaire asked patients about healthy eating and high fat foods. Patients can respond appropriately to such questions only if they have good knowledge of the nutrient content of food items, and daily dietary requirements for the various food nutrients.
After adjusting for demographic/disease characteristics, there were no statistically significant differences in HbA1c levels between ethnic groups. However, unequivocal evi-dence indicates that a percentage reduction in HbA1c could result in significant decrease in all-cause and diabetes-related mortality, as well as substantial reductions in the risk of diabetes complications.35,36 Therefore, although statistically
not significant, the 0.29% difference in HbA1c between white-British and black-Africans in this study may be clini-cally important.
Limitations
This study has a number of limitations which should be con-sidered when interpreting its findings. For example, recent evidence suggests that self-management is an inherently complex concept and how patients make ‘sense’ of it may actually differ from the perspectives of policy makers or health care practitioners.37 Indeed patients’ interpretation of
self-management may be a product of their personal experi-ences of the illness and their sociocultural background. This complexity of self-management has led to calls for a rather focused and contextualized interpretation of the concept.37
Secondly, our study did not collect information as to whether or not participants had received any formal diabetes educa-tion after diagnosis. Such informaeduca-tion might have been use-ful for explaining the ethnic variations in diabetes-specific knowledge. Also, as a cross-sectional study, it is neither feasible to determine the direction of effect in the reported associations, nor draw firm causal inferences from the find-ings. For example, the finding that treatment with insulin was associated with higher adherence to self-management recom-mendations can be given different interpretations. One plau-sible explanation is that treatment regimen is often used as an index of severity for type 2 diabetes.38 Thus, patients who
to self-management recommendations. Another method-ological limitation of our study is the potential for selection bias, given that participants were non-randomly sampled from only two boroughs of London (Brent and Hackney). Thus the findings reported here are limited to the populations studied, although policy makers and practitioners working in similar populations may draw useful lessons from them. Finally, self-reported questionnaires were used in this study. It is therefore likely that some participants responded to the questions in ways that portray them as good or adherent to recommendations and not necessarily their ‘true’ behavior or perceptions (social desirability bias). It may be appropriate for future studies to further explore these issues using objec-tive measures such as blood glucose monitors and pedometers as well as real-time data collection devices such as Personal Digital Assistants (PDAs).
Conclusion
Various demographic/disease characteristics were associated with knowledge, illness perceptions, and self-management in all ethnic groups. These characteristics should therefore be taken into consideration when assessing the needs of people with diabetes for possible intervention. Even after control-ling for demographic/disease characteristics, there were still significant differences in knowledge, illness perceptions, and self-management of diabetes among the three ethnic groups. The two populations of African-origin (black-African and black-Caribbean) had substantially poor knowledge levels and high levels of misconceptions about their diabetes. Whilst we urgently call for future research to explore how the high knowledge deficit and misconceptions about diabetes in the African-origin populations impact on their self-management behaviors, it is also appropriate to highlight some important lessons to be drawn from our findings. Adequate and appro-priate levels of disease-specific knowledge and perceptions are essential for individuals to accept diagnosis of a complex disease like diabetes and to facilitate their understanding of the required behavior changes needed to ensure optimum self-management and improved disease outcomes. There is there-fore the need for effective interventions aimed at addressing the knowledge misconception gap between African-origin and white-British populations with diabetes. The findings also present a number of lessons for health care profession-als (HCPs), researchers, and policy makers. For example, the specific misconceptions (such as diabetes being a short-term and less serious condition) discovered in this study, present opportunities for HCPs and researchers to effectively work towards changing such negative and inconsistent beliefs
among individuals and specific patient groups.39,40 Secondly,
given the sub-optimal levels of adherence to DSM recom-mendations, particularly among black-Caribbean patients, HCPs may need to work collaboratively with individuals and groups of patients to identify barriers preventing them from engaging in self-management, and work towards resolving such barriers. Finally, important knowledge deficits were also found in all patient groups, particularly on areas bordering on practicalities of DSM, indicating the need for HCPs to emphasize practical and skill-based aspects of DSM during self-management education, and to periodically review and supplement the knowledge requirements of all patients.
Disclosure
This study was funded by a grant from the Alliance for Self Care Research consortium. The authors report no conflicts of interest in this work.
References
1. International Diabetes Federation. IDF Diabetes Atlas Update 2012. Brussels: International Diabetes Federation; 2012. Available from: http:// www.idf.org/diabetesatlas/5e/Update2012. Accessed May 2, 2013. 2. Ekoé JM, Zimmet P. Diabetes Mellitus: diagnosis and classification.
In: Ekoé JM, Zimmet P, Williams R, editors. The Epidemiology of Diabetes Mellitus: an International Perspective. Chichester: John Wiley; 2001:11–29.
3. American Diabetes Association. Economic costs of diabetes in the U.S. in 2007. Diabetes Care. 2008;31:596–615.
4. Diabetes UK. Diabetes Heartache: The Hard Reality of Cardiovascular Care for People with Diabetes. 2007, London: Diabetes UK; 2007. Available from: http://www.diabetes.org.uk/Documents/News/ Heartache_report07.pdf. Accessed June 13, 2013.
5. Rijken M, Jones M, Heijmans M, Dixon A. Supporting Self-management. In: Nolte E, McKee M, editors. Caring for People with Chronic Conditions: A Health System Perspective. Maidenhead: Open University Press; 2008:116–142.
6. American Diabetes Association. Standards of medical care in diabetes – 2008. Diabetes Care. 2008;31:S12–S54.
7. Manderson L, Kokanovic R. “Worried all the time’’: distress and the circumstances of everyday life among immigrant Australians with type 2 Diabetes. Chronic Illn. 2009;5:21–32.
8. Agyemang C, Bhopal R, Bruijnzeels M. Negro, Black, Black African, African Caribbean, African American or what? Labelling African origin populations in the health arena in the 21st century. J Epidemiol Community Health. 2005;59:1014–1018.
9. Saleh A, Amanatidis S, Samman S. Cross-sectional study of diet and risk factors for metabolic diseases in a Ghanaian population in Sydney, Australia. Asia Pac J Clin Nutr. 2002;11:210–216.
10. UK Department of Health. Health Survey for England 2004: The Health of Minority Ethnic Groups. London; UK Department of Health; 2005. 11. Ong KL, Cheung BM, Wong LY, Wat NM, Tan KC, Lam KS.
Prevalence, treatment, and control of diagnosed diabetes in the U.S. National Health and Nutrition Examination Survey 1999–2004.
Ann Epidemiol. 2008;18:222–229.
12. Baskar V, Kamalakannan D, Holland MR, Singh BM. Does ethnic origin have an independent impact on hypertension and diabetic complications? Diabetes Obes Metabol. 2006;8:214–219.
13. Lambie M, Richards N, Smith S. Ethnicity, age and incidence rates for renal replacement therapy (RRT) in Birmingham, UK: 1990–2004.
International Journal of General Medicine
Publish your work in this journal
Submit your manuscript here: http://www.dovepress.com/international-journal-of-general-medicine-journal The International Journal of General Medicine is an international,
peer-reviewed open-access journal that focuses on general and internal medicine, pathogenesis, epidemiology, diagnosis, monitoring and treat-ment protocols. The journal is characterized by the rapid reporting of reviews, original research and clinical studies across all disease areas.
A key focus is the elucidation of disease processes and management protocols resulting in improved outcomes for the patient.The manu-script management system is completely online and includes a very quick and fair peer-review system. Visit http://www.dovepress.com/ testimonials.php to read real quotes from published authors. 14. Kirk JK, Agostino RB, Bell RA, et al. Disparities in HbA1c Levels
between African-American and non-Hispanic white adults with diabetes. Diabetes Care. 2006;29:2130–2136.
15. Adams AS, Trinacty CM, Zhang F, et al. Medication adherence and racial differences in A1c control. Diabetes Care. 2008;31:916–921. 16. Griva K, Myers LB, Newman S. Illness perceptions and self efficacy
beliefs in adolescents and young adults with insulin dependent diabetes mellitus. Psychol Health. 2000;15:733–750.
17. Nwasuruba C, Khan M, Egede L. Racial/ethnic differences in multiple self-care behaviors in adults with diabetes. J Gen Intern Med. 2007;22: 115–120.
18. Office for National Statistics. Census 2001 Key Statistics, Local Authori-ties in England and Wales. Newport: Office for National Statistics; 2001. Available from http://www.ons.gov.uk/ons/rel/census/census-2001-key-statistics/local-authorities-in-england-and-wales/index.html. Accessed on June 25, 2013.
19. Abubakari AR, Jones MC, Lauder W, Kirk A, Anderson J, Devendra D. Associations between knowledge, illness perceptions, self-management and metabolic control of type 2 diabetes among African and European-origin patients. J Nurs Healthc Chronic Illn. 2011;3:245–256. 20. Fitzgerald JT, Funnell MM, Hess GE, et al. The reliability and validity
of a brief diabetes knowledge test. Diabetes Care. 1998;21:706–710. 21. Toobert DJ, Hampson SE, Glasgow RE. The summary of diabetes
self-care activities measure: results from 7 studies and a revised scale.
Diabetes Care. 2000;23:943–950.
22. Moss-Morris R, Weinman J, Petrie K, Horne R, Cameron L, Buick D. The Revised Illness Perception Questionnaire (IPQ-R). Psychol Health. 2002;17:1–16.
23. Abubakari AR, Jones MC, Lauder W, Kirk A, Devendra D, Anderson J. Psychometric properties of the Revised Illness Perception Question-naire: Factor structure and reliability among African-origin populations with type 2 diabetes. Int J Nurs Stud. 2011;49:672–681.
24. Barnes, L, Moss-Morris R, Kaufusi M. Illness beliefs and adherence in diabetes mellitus: a comparison between Tongan and European patients.
N Z Med J. 2004;117(1188):U743.
25. Koffman J, Morgan M, Edmonds P, Speck P, Higginson IJ. “I know he controls cancer”: the meanings of religion among Black Caribbean and White British patients with advanced cancer. Soc Sci Med. 2008;67:780–789.
26. Broadbent E, Petrie KJ, Main J, Weinman J. The brief illness perception questionnaire. J Psychosom Res. 2006;60:631–637.
27. Tabachnick BG, Fidell LS. Using Multivariate Statistics. 3rd ed. New York: HarperCollins College; 1996.
28. Glasgow RE, Hampson SE, Strycker LA, Ruggiero L. Personal-model beliefs and social-environmental barriers related to diabetes self-management. Diabetes Care. 1997;20:556–561.
29. Bean D, Cundy T, Petrie KJ. Ethnic differences in illness perceptions, self-efficacy and diabetes self-care. Psychol Health. 2007;22:787–811. 30. Baradaran H, Knill-Jones R. Assessing the knowledge, attitudes and
understanding of type 2 diabetes amongst ethnic groups in Glasgow, Scotland. Pract Diabetes Int. 2004;21:143–148.
31. Persell SD, Keating NL, Landrum MB, et al. Relationship of diabetes-specific knowledge to self-management activities, ambulatory preventive care, and metabolic outcomes. Prev Med. 2004;39:746–752. 32. Mann DM, Ponieman D, Leventhal H, Halm EA. Misconceptions
about diabetes and its management among low-income minorities with diabetes. Diabetes Care. 2009;32:591–593.
33. Wallston KA. The validity of the multidimensional health locus of control scales. J Health Psychol. 2005;10:623–631.
34. Nuovo J. Type 2 diabetes. In: Nuovo J, editor. Chronic Disease Management. New York: Springer; 2007:139–187.
35. Stratton IM, Adler AI, Neil HA, et al. Association of glycaemia with macrovascular and microvascular complications of type 2 diabetes (UKPDS 35): prospective observational study. BMJ. 2000;321: 405–412.
36. Ray KK, Seshasai SR, Wijesuriya S, et al. Effect of intensive control of glucose on cardiovascular outcomes and death in patients with diabetes mellitus: a meta-analysis of randomised controlled trials. Lancet. 2009;73:1765–1772.
37. Atkin K, Stapley S, Easton A. No one listens to me, nobody believes me: self management and the experience of living with encephalitis.
Soc Sci Med. 2010;71:386–393.
38. Lemp GF, Zwaag RV, Hughes JP, et al. Association between the severity of diabetes mellitus and coronary arterial atherosclerosis. Am J Cardiol. 1987;60:1015–1059.
39. Petrie KJ, Cameron LD, Ellis CJ, Buick D, Weinman J. Changing illness perceptions after myocardial infarction: an early intervention randomized controlled trial. Psychosom Med. 2002;64:580–586. 40. Keogh KM, White P, Smith SM, McGilloway S, O’Dowd T, Gibney J.
Changing illness perceptions in patients with poorly controlled type 2 diabetes, a randomised controlled trial of a family-based intervention: protocol and pilot study. BMC Fam Pract. 2007;8:36.