Effect of sample thickness on the extracted near-infrared bulk optical properties of Bacillus subtilis in liquid culture
Elitsa Dzhongova1, Colin R. Harwood2, Suresh N. Thennadil3*
1
School of Chemical Engineering and Advanced Materials, Newcastle University, Newcastle upon Tyne, United Kingdom
2
Institute for Cell and Molecular Biosciences, Newcastle University, Newcastle upon Tyne, United Kingdom
3
Department of Chemical and Process Engineering, University of Strathclyde, Glasgow, United Kingdom
ABSTRACT
In order to determine the bulk optical properties of a Bacillus subtilis culture during growth phase we investigated the effect of sample thickness on measurements taken with different measurement configurations, namely total diffuse reflectance and total diffuse transmittance. The bulk optical properties were extracted by inverting the measurements using the radiative transfer theory. While the relationship between reflectance and biomass changes with sample thickness and the intensity (absorbance) levels vary significantly for both reflectance and transmittance measurements, the extracted optical properties show consistent behavior both in terms of the relationship with biomass and magnitude. This observation indicates the potential of bulk optical properties for building models that could be more easily transferable compared to those built using raw measurements.
Keywords: Multiple light scattering, optical properties, radiative transfer theory, fermentation, Bacillus subtilis.
INTRODUCTION
In a previous study1, we demonstrated that the Radiative Transfer Theory (RTT) could be
build robust calibration models for estimating the concentration of various constituents in the sample, it is important to know how the path length of the sample affects the estimation of the bulk optical properties and thus the performance of the corresponding calibration models. In theory, the extracted bulk optical properties should be the same, to within experimental error, irrespective of the sample thickness provided the extraction routine is stable. In this paper we investigated the effect of sample thickness both on extracted bulk optical properties as well as the raw measurements taken with different configurations, namely total diffuse reflectance (Rd) and total diffuse transmittance (Td).
MATERIALS AND METHODS
Three growth cycle experiments were carried out using the Gram-positive bacterium Bacillus subtilis strain 168, obtained from the Institut Pasteur, Paris. In each experiment,
the strain was cultivated in 100ml Spizizen’s minimal medium containing trace element solution2
in a 250 ml Erlenmeyer flask. All the bacterial growth cycle experiments were carried out with the medium at pH of 7.0 ± 0.5, the temperature controlled at 370C ± 0.5, and in an orbital incubator with an agitation rate of 220rpm. For all the three cultures, data was collected during the growth phase and a total of five samples were taken at approximately 2-hour intervals during the growth phase.
For each sample Rd, Td and Tc measurements were made using cuvettes with
used for both the spectroscopic measurements and the gravimetric measurements were the same as that used in previous work1, 2. Bulk optical properties of the samples were extracted from the measurements using the inverse adding-doubling method to invert the radiative transfer equation. Details of this procedure can be found elsewhere.1,3-5
RESULTS AND DISCUSSION
Total diffuse reflectance (Rd) measurements
reflection at the back end of the cuvette and therefore have a greater probability of making it back to the detector.
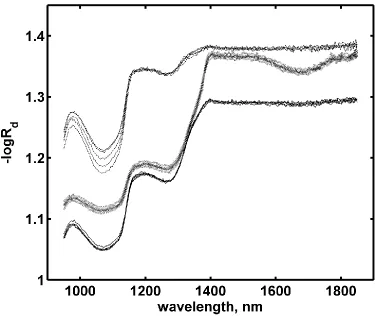
The largest variation in reflectance spectra over the course of the cultivation occurs for the sample thickness of 10mm at wavelengths in the region 950 – 1150nm. The spread in the data seen for the 10mm samples occur during the growth phase, indicating that during this phase the greatest sensitivity to changes can be observed using Rd measurements. Above
1400nm, only the measurements with a sample thickness of 2mm show features of potential interest, indicating that this thickness is the most suitable for extracting information from reflectance measurements in the first overtone region.
In order to examine the spectral variations over the course of a cultivation in more detail, values for diffuse reflectance (-logRd) were plotted against biomass at a single wavelength.
Two wavelengths were chosen: 1050nm (Figure 2) and 1602nm (Figure 3), respectively, to examine trends in the measurements for the scattering dominated region and absorption dominated region.
Measurements with the 2mm thickness sample (Figure 2a) show that the reflectance increases, corresponding to a decrease in absorbance over the course of the growth phase. The same observation has been made by Ge et al.6, while monitoring cell density from a fed-batch fermentation of Saccharomyces cerevisiae. A decrease in –logRd versus cell mass
were collected with an integrating sphere setup. Although two different techniques were used, the same trend for diffuse reflectance was observed in the scattering dominated region.
In the case of the measurements obtained with 4mm (Figure 2b) and 10mm (figure 2c) path length cuvettes collected during the growth phase, the –logRd values increased with
increasing biomass which was the opposite of the trend exhibited by data from 2mm sample thickness. Thus for the growth phase, it was found that sample thickness not only affects the levels of reflected intensity but also affects the nature of relationship of the reflected intensity with respect to biomass concentration.
Values (-logRd) from the absorption dominated region (1602nm) are shown as a function of
biomass in Figures 3a-c. For the measurements with 2mm path length cuvettes (Figure 3a) the –logRd value decreases with the increase in biomass, although the relationship is very
weak. For the other two sample thicknesses there are no discernible trends in the absorbance values with respect to biomass. This is because the major contribution to the spectra due to changes in biomass comes from changes in the amount of scattering and thus the scattering dominated region will be more sensitive to these changes than the absorbance dominated region.
Total diffuse transmittance (Td) measurements
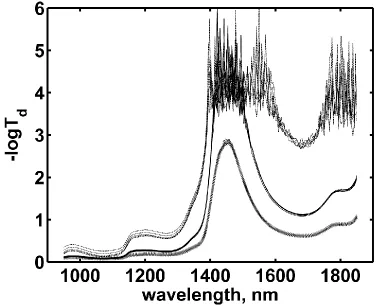
4mm path length cuvette in which the water absorption peak around 1450nm is very noisy. For 10mm thick samples, the region beyond 1350nm is very noisy, indicating that it would not be possible to obtain useful information beyond this wavelength. However, for this thickness, the transmittance signal (-logTd) in the region 950nm-1350nm was seen to have a
much higher variation over the course of the growth phase, indicating that this thickness will have the greatest sensitivity with respect to changes in biomass concentration.
In order to study these variations in greater detail, values for diffuse transmittance were plotted against biomass at wavelengths 1050nm (Figure 5) and 1602nm (Figure 6). At 1050nm wavelength, values (-logTd) obtained with 2mm thick sample (Figure 5a) during
the growth phase do not indicate a clear trend with respect to the increase in biomass while, for the thicker samples, absorbance increases approximately linearly with biomass with a slight nonlinearity visible for the 4mm thickness at the lower end of the biomass concentration. Data from the absorption dominated region (1602nm), shows dependence of –logTd with biomass (Figure 6). There is no discernible relationship with biomass for any
of the sample thickness. This is due to the fact that the absorbance of water is the major contributor to variations in absorption whereas biomass is the major contributor to the variations in the scattering effect and therefore the scattering dominated region is much more sensitive to biomass than the absorption dominated region.
Bulk scattering coefficient
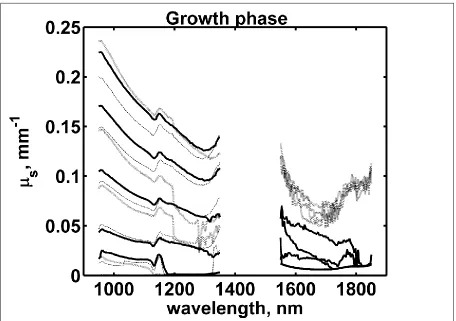
Figure 7 shows the bulk scattering coefficients (μs) obtained during the growth phase of a
change in μs over the duration of the growth phase is large. In the region of the water peak
(1450nm) where calculations were highly influenced by the water absorption, reliable estimates could not be obtained. Also, in the region 1550-1850nm, the extracted bulk scattering coefficients exhibit a high degree of uncertainty as indicated by the high noise in the scattering spectra in this region, and by the fact that μs extracted at different times
during the growth phase appear to have inconsistent trends in this region. This high degree of uncertainty in the extracted bulk scattering coefficients is probably due to the fact that in the absorption dominated region spectra are much less sensitive to changes in scattering coefficients than to changes in the absorption properties. In the region between 1550nm and 1850nm, only scattering spectra for 2mm and 4mm sample thicknesses are presented, since the high level of noise in the raw measurements for the 10mm thick sample led to convergence problems when attempting to extract the optical properties in this region.
By analogy with the raw measurements, values for μs are displayed against biomass for
wavelengths of 1050nm (Figure 8) and 1602nm (figure 9) in order to examine in more detail the trends in the scattering spectra. It can be seen that μs for 2mm, 4mm, and 10mm
show clear linear relationship with respect to the growth phase (Figure 8).
At 1602nm, the 2mm thick samples do not show any significant relationship between μs
outliers are observed in this region. These are more likely to be due to convergence problem in the inversion rather than to any physical characteristics in the system.
The significance of the results in this section lies in the observation that μs values extracted
using different sample thickness have similar values and their relationship with biomass is of the same form, irrespective of the sample thickness. This is in contrast to what we observed with the Rd and Td measurements. In both these cases, there are significant
differences in the absorbance levels with different cuvette path lengths (Figures 1 and 4). In addition, in the case of Rd measurements, the functional form of the relationship may vary
with different sample thicknesses (Figure 2). This observation has potential implications in terms of calibration transfer. For models built using the raw measurements, different calibration models have to be built even when the sample thickness or measurement configuration change slightly, since the level of absorption and the functional form of the relationship between the measurement and the analyte of interest could change significantly. When optical properties are used, as long as the optical properties are obtained accurately, calibration transfer should be much easier to accomplish, regardless of the sample thickness on which the models are built. In principle, calibration transfer should also be easy to accomplish even when a different set of measurement configurations are used to extract the bulk optical property. The latter is a fundamental property of the sample itself and therefore should not vary according to the type of measurement used to extract it.
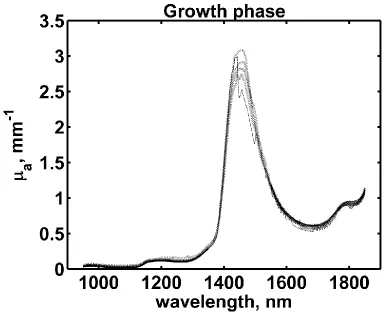
Figure 10 shows the bulk absorption coefficients (μa) during the growth phase of a single
cultivation run for the different sample thicknesses. The absorption band of water dominates the spectra since it is the major absorbing species in the sample, and consequently changes in absorption during the growth phase are very small. The absorption coefficients extracted using different sample thicknesses are almost identical in the full region studied (950nm-1850nm). For the 4mm and 10mm thick samples, μa could not be
extracted in the region of the water peak due to the high level of noise in the raw measurements.
Values for μa at 1050nm and 1602nm versus biomass are shown in Figures 11 and 12
respectively. A linear relationship between μa and biomass are evident for the 4mm and
10mm thick samples at 1050nm whereas the 2mm samples show a very weak trend, mainly due to the lack of sensitivity resulting from the short path length travelled by the photons being insufficient for them to encounter a high number of cells. Such an increase in the bulk absorption coefficient has also been reported by Beauvoit et al,7 while estimating optical properties of commercial Baker’s yeast. The magnitude of increase in μa with
increase in biomass is smaller by almost an order of magnitude compared to the changes in μs at the same wavelength. In figure 12, the absorption coefficient at 1602nm is plotted
against biomass. The values for 10mm thick sample were not extracted in this region due to the high level of noise in the raw measurements. It can be seen that, for 2mm sample thickness that μa does not hold any relation with the biomass whereas the data obtained
The consistency in the extracted values for all three samples thicknesses indicates the reliability of the inversion method. Also this points to the potential of obtaining robust calibration models built on the extracted μa for absorbing species in the mixture (e.g.
glucose) provided the errors in the extracted values are sufficiently low. Work on model suspensions8,9 have shown that the models built by separating the absorption and scattering effects by extracting bulk optical properties and then building a calibration model using the bulk absorption coefficient can lead to significant improvement in performance. In addition to an improvement in performance, as discussed in the previous section, models built on μa
have the potential to be easily transferred due to the fact that this is a fundamental property of the sample.
CONCLUSIONS
culture for building models that could be more easily transferable compared to those built using raw measurements.
ACKNOWLEDGMENTS
This work was funded by Marie Curie FP6 (INTROSPECT) and by EPSRC grants GR/S50441/01 and GR/S50458/01.
1
E. Dzhongova, C. R. Harwood, S. N. Thennadil, Applied Spectroscopy 63, 1, 25 (2009).
2
C. R. Harwood, S. M. Cutting, Molecular Biology Methods for Bacillus (John Wiley & Sons Ltd., 1990).
3
S. A. Prahl, "The Adding-Doubling Method," in Optical Thermal Response of Laser Irradiated Tissue, A. J. Welch, v. G. M. J. C., eds. (Plenum Press, New York, 1995).
4
W. Saeys, M. Velazco-Roa, S. Thennadil, H. Ramon, B. Nikolai, Applied Optics 47, 7, 908 (2008).
5
M. A. Velazco-Roa , S. N. Thennadil, Applied Optics 46, 18, 3730 (2007).
6
Z. Ge, A. Cavinato, J. Callis, Analytical Chemistry 66, 1354 (1994).
7
B. Beauvoit, H. Liu, K. Kang, P. D. Kaplan, M. Miwa, B. Chance, Cell Biophys 23(1-3), 91 (1993).
8
R. Steponavicius, S. N. Thennadil, Analytical Chemistry 81, 7713 (2009).
9
List of Figure Captions
Figure 1. Diffuse reflectance spectra taken during growth phase at different sample thicknesses (2mm, dotted line, 4mm solid line, and 10mm dashed line).
Figure 2. Total diffuse reflectance measurements (-logRd) at 1050nm during growth phase for three cultivations [run 1, triangles, run 2, circles run 3, squares] versus biomass for different sample thicknesses. (a) 2mm, (b) 4mm, (c) 10mm.
Figure 3. Total diffuse reflectance measurements (-logRd) at 1602nm during growth phase for three cultivations [run 1, triangles, run 2, circles run 3, squares] versus biomass for different sample thicknesses (a) 2mm, (b) 4mm, (c) 10mm.
Figure 4. Diffuse transmittance spectra taken during growth phase at different sample thicknesses (2mm, dotted line, 4mm solid line, and 10mm dashed line).
Figure 5. Total diffuse transmittance measurements (-logTd) at 1050nm during growth phase for three cultivations [run 1, triangles, run 2, circles run 3, squares] versus biomass for different sample thicknesses (a) 2mm, (b) 4mm, (c) 10mm.
Figure 6. Total diffuse transmittance measurements (-logTd) at 1602nm during growth phase for three cultivations [run 1, triangles, run 2, circles run 3, squares] versus biomass for different sample thicknesses. (a) 2mm, (b) 4mm, (c) 10mm.
Figure 7. Estimated bulk scattering coefficients during growth phase at different samples thickness (2mm, dotted line, 4mm solid line, and 10mm dashed line).
Figure 8. Estimated bulk scattering coefficient at 1050nm during growth phase for three cultivations [run 1, stars, run 2, circles run 3, triangles] versus biomass for different sample thicknesses. (a) 2mm, (b) 4mm, (c) 10mm.
Figure 9. Estimated bulk scattering coefficient at 1602nm during growth phase for three cultivations [run 1, triangles, run 2, circles run 3, squares] versus biomass for different sample thicknesses. (a) 2mm, (b) 4mm.
Figure 10. Estimated bulk absorption coefficients during the growth phase of the cultivation and at different samples thicknesses (2mm, dotted line, 4mm solid line, and 10mm dashed line).
Figure 11. Estimated bulk absorption coefficient at 1050nm during growth phase for three cultivations [run 1, triangles, run 2, circles run 3, squares] versus biomass for different sample thicknesses. (a) 2mm, (b) 4mm, (c) 10mm.
Figure 3. Total diffuse reflectance measurements (-logRd) at 1602nm during growth phase for three cultivations [run 1, triangles, run 2, circles run 3,
Figure 11. Estimated bulk absorption coefficient at 1050nm during growth phase for three cultivations [run 1, triangles, run 2, circles run 3, squares] versus biomass for different
![Figure 2. Total diffuse reflectance measurements (-logRd) at 1050nm during growth phase for three cultivations [run 1, triangles, run 2, circles run 3, squares] versus biomass for different sample thicknesses](https://thumb-us.123doks.com/thumbv2/123dok_us/1682938.121692/15.612.182.416.72.659/reflectance-measurements-cultivations-triangles-squares-biomass-different-thicknesses.webp)
![Figure 3. Total diffuse reflectance measurements (-logRd) at 1602nm during growth phase for three cultivations [run 1, triangles, run 2, circles run 3, squares] versus biomass for different sample thicknesses (a) 2mm, (b) 4mm, (c) 10mm](https://thumb-us.123doks.com/thumbv2/123dok_us/1682938.121692/16.612.173.388.74.656/figure-reflectance-measurements-cultivations-triangles-biomass-different-thicknesses.webp)
![Figure 5. Total diffuse transmittance measurements (-logTd) at 1050nm during growth phase for three cultivations [run 1, triangles, run 2, circles run 3, squares] versus biomass for different sample thicknesses (a) 2mm, (b) 4mm, (c) 10mm](https://thumb-us.123doks.com/thumbv2/123dok_us/1682938.121692/18.612.177.417.69.659/figure-transmittance-measurements-cultivations-triangles-biomass-different-thicknesses.webp)
![Figure 6. Total diffuse transmittance measurements (-logTd) at 1602nm during growth phase for three cultivations [run 1, triangles, run 2, circles run 3, squares] versus biomass for different sample thicknesses](https://thumb-us.123doks.com/thumbv2/123dok_us/1682938.121692/19.612.178.416.71.657/transmittance-measurements-cultivations-triangles-squares-biomass-different-thicknesses.webp)
![Figure 8. Estimated bulk scattering coefficient at 1050nm during growth phase for three cultivations [run 1, stars, run 2, circles run 3, triangles] versus biomass for different sample thicknesses](https://thumb-us.123doks.com/thumbv2/123dok_us/1682938.121692/21.612.191.405.73.600/estimated-scattering-coefficient-cultivations-triangles-biomass-different-thicknesses.webp)
![Figure 9. Estimated bulk scattering coefficient at 1602nm during growth phase for three cultivations [run 1, triangles, run 2, circles run 3, squares] versus biomass for different sample thicknesses](https://thumb-us.123doks.com/thumbv2/123dok_us/1682938.121692/22.612.116.465.73.596/estimated-scattering-coefficient-cultivations-triangles-circles-different-thicknesses.webp)