Rapid characterization of the ultraviolet induced fiber
Bragg grating complex coupling coefficient as a function
of irradiance and exposure time
Gordon M. H. Flockhart,1,* Geoffrey A. Cranch,1 and Clay K. Kirkendall2
1SFA, Inc., 2200 Defense Highway, Suite 405, Crofton, Maryland 21114, USA 2U.S. Naval Research Laboratory, 4555 Overlook Avenue SW, Washington, D.C. 20375, USA
*Corresponding author: [email protected]
Received 25 July 2007; accepted 30 September 2007; posted 15 October 2007 (Doc. ID 85539); published 26 November 2007
We report the application of optical frequency domain reflectometry and a discrete-layer-peeling inverse scattering algorithm to the spatial characterization of the UV induced complex coupling coefficient during fiber Bragg grating growth. The fiber grating is rapidly characterized using this technique to give irradiance dependent growth as a function of exposure time, thereby providing the complete character-ization of the coupling coefficient in the form of a “growth surface,” which is related to the fiber’s photosensitivity. We compare measurements of fiber Bragg grating growth in SMF-28 when exposed to continuous wave 244 nm irradiation from 0 to 90 W cm⫺2for exposure times up to 3230 s with a selection of other fibers including high germanium concentration fiber and erbium doped fiber. © 2007 Optical Society of America
OCIS codes: 060.0060, 060.3738, 060.2270, 060.2410, 120.3180, 160.5335.
1. Introduction
Fiber Bragg gratings (FBGs) are periodic variations of an optical fiber’s core refractive index along the axis (length) of the optical fiber. This class of grating structures obeys a phase matching condition whereby energy is coupled from a forward propagating core mode to a backward propagating core mode. FBGs are highly versatile devices whose spectral ampli-tude, wavelength, and dispersion properties can be tailored by controlling numerous properties of the refractive index grating structure, including: fringe periodicity and chirp, fringe magnitude and apodiza-tion, and fringe tilt angle [1]. As a result of their versatility FBGs have found uses in many applica-tions in optical fiber sensing [2] and as in-fiber de-vices for telecommunication applications [3]. FBG based devices such as multiband spectral filters [4] can require extremely complicated grating struc-tures. The exacting specifications of these devices de-mand precise control of the refractive index grating
structure. FBGs can be fabricated by exposing the core of an optical fiber to a sinusoidal UV irradiance pattern along the length of the fiber formed by the interference between two UV laser beams [5,6]. Ad-vanced fabrication techniques have been developed to allow the various parameters of the grating structure to be controlled during fabrication [7]. To design and fabricate sophisticated FBG devices grating modeling and synthesis algorithms are required, as well as precise knowledge of the optical fiber’s refractive in-dex change with applied optical radiation, commonly referred to as the fiber’s photosensitivity.
To fabricate an FBG with a target spectral re-sponse it is necessary to determine the required com-plex coupling coefficient of the grating structure from the spectral response. This problem is commonly known as an inverse scattering problem, and one of the most promising techniques to calculate the grating structure from the target spectrum is the discrete-layer-peeling inverse scattering algorithm [8 –10]. This algorithm can be combined with a spe-cific set of conditions to ensure the FBG’s target spec-trum can be obtained by a physical grating structure [11]. The final step of the process is to write a refrac-0003-6935/07/348237-07$15.00/0
tive index modulation in the optical fiber to give the desired complex coupling coefficient profile, ideally in a one-step process. Therefore the fiber’s photosensi-tivity must be known and is typically described as the refractive index change for a given exposure irradi-ance. In the simplest case the refractive index mod-ulation shape is assumed to be sinusoidal, from which the coupling coefficient can be directly calculated. If we approximate the refractive index modulation n
along the longitudinal axis of the fiberxto be sinu-soidal, the perturbation can be described by [11]
n⫺neff⫽ ⌬nac共x兲cos
冉
2
⌳ z⫹ 共x兲
冊
⫹ ⌬ndc共x兲, (1)whereneffis the effective index of the guided mode of
the nascent fiber; ⌬nac共x兲and ⌬ndc共x兲 are the slowly
varying “ac” and “dc” components of the refractive index modulation; ⌳is the grating’s spatial period; and 共x兲 is the grating spatial phase. The coupling coefficient magnitude is directly related to the ac component of the refractive index variation,⌬nac共x兲,
by [12]
ⱍ
q共x兲ⱍ
⫽ B ⌬nac共x兲, (2)
whereB⫽2neff⌳is the design Bragg wavelength and
is the guided mode overlap factor. The phase of the coupling coefficient describes the grating’s phase en-velope. This is a combination of the geometrical phase
共x兲 and the phase due to the dc refractive index change⌬ndc共x兲and is described by
arg关q共x兲兴⫽ 共x兲⫺4 B
冕
0
x
⌬ndc共x⬘兲dx⬘⫹
2. (3)
Although the refractive index perturbation repre-sents the physical change in the optical fiber when the grating is fabricated, it is the complex coupling coefficient of the grating structure that describes the magnitude and phase of the mode coupling. In mate-rials with nonlinear photosensitivity, i.e., the refrac-tive index change is a nonlinear function of the incident irradiance, the refractive index modulation shape is no longer sinusoidal and a modified coupling coefficient must therefore be determined [13,14].
Milleret al.proposed a three-dimensional growth surface describing the fiber’s photosensitivity as a function of irradiance and exposure time, thereby be-ing able to predict the refractive index modulation shape and hence the modified coupling coefficient [14]. Recently, characterization of the growth surface of a germanosilicate fiber was reported using an in-terferometric approach to directly measure the re-fractive index change when exposed to fringeless UV radiation [15]. However characterization of the fiber’s photosensitivity in terms of the UV induced complex
coupling coefficient obviates the need to know the precise refractive index modulation shape and hence the need to calculate a modified coupling coefficient. Knowledge of the spatially varying complex coupling coefficient, design wavelength, andneffare sufficient
to completely characterize the spectral properties of the FBG over the first-order resonance regime.
In this paper we propose a technique to rapidly characterize a fiber’s photosensitivity in terms of the UV induced coupling coefficient as a function of incident UV irradiation and exposure time. Char-acterization in terms of the UV induced coupling coefficient, rather than the UV induced refractive index change, is advantageous for FBG design and fabrication as it provides a direct measure of the coupling strength of the grating structure realized in the fiber. This measurement therefore includes effects such as the contribution of higher diffraction orders for direct phase mask inscription, which can degrade the UV fringe pattern or any reduction in UV fringe visibility in interferometric writing set-ups. We report the full characterization of the cou-pling coefficient growth surface of SMF-28 for exposure to 244 nm radiation from 0 to⬃90 W cm⫺2 and a total accumulated exposure time of 3230 s. After characterization of the beam profile and align-ment of the optics, a typical measurealign-ment will take
⬃2–3 h depending on the required total fluence. The measurement is fully automated and requires no user intervention. We also report measurements of a high germanium-doped fiber and three erbium-doped fi-bers for comparison.
2. Experimental Setup
To characterize the optical fiber’s growth surface as a function of irradiance and exposure time, we perform a stepwise growth of a FBG exposed to an incident UV beam with a nonuniform irradiance profile. Spa-tial characterization of the complex coupling coeffi-cient and knowledge of the UV beam’s irradiance profile allows the irradiance dependent growth to be determined. As a result the fiber grating’s growth can be rapidly characterized as a function of irradiance and exposure time in a single experiment. To dem-onstrate this technique a number of FBG exposures were characterized in five different optical fibers.
[image:2.603.329.521.593.686.2]A diagram of the optical setup is shown in Fig. 1. A continuous wave frequency-doubled argon-ion laser
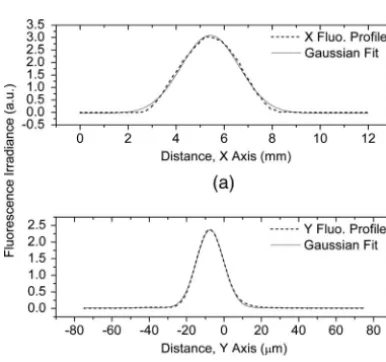
( ⫽ 244 nm and output power Pout ⫽ 125 mW) is used to expose the optical fiber through a uniform period phase mask共⌳PM⫽1067 nm兲. The laser beam is expanded (6⫻ telescope not shown) and focused using a cylindrical lens to a line with a 1兾e2 beam width of⬃14m (full width 28m), and a slit aper-ture truncates the sidelobes of the beam leaving an approximately Gaussian profile with a 1兾e2 beam width of 2.4 mm. The FBGs are written using a static full field exposure, and the focused beam shape is characterized before each series of exposures. The focused beam profile is measured by scanning an op-tical fiber through the beam waist. The emitted 410 nm fluorescence [16] guided by the fiber is de-tected using a silicon photodiode and is recorded as a function of position. A horizontal and a vertical beam profile are recorded. The fluorescence inten-sity decays as a function of UV exposure, therefore the scan speed must be set appropriately to avoid measurement errors in the beam profile. The total power incident on the phase mask is measured
共P⫽70 mW兲and used to calculate the beam irradi-ance. We assume the measured horizontal and verti-cal beam profiles represent the beam shape across the full beam width, thus we approximate the full beam by matrix multiplication of the two beam profiles. The beam irradiance is calculated by numerical integra-tion of the beam shape and scaled by the⫾1 diffrac-tion efficiencies of the phase mask共⬃38%兲 and the Fresnel reflection. Typical horizontal and vertical beam irradiance profiles are shown in Fig. 2.
The fiber is exposed for a set period of time increas-ing from 50 ms up to 600 s, after which the gratincreas-ing is allowed to decay for 60 s [17]. The complex reflectivity of the FBG is then measured using an optical fre-quency domain reflectometer (OFDR) [18]. Prelimi-nary measurements were performed using an in-house OFDR [19], however the fringe amplitude of the OFDR depended on the polarization state incident on the FBG under test. A polarization controller was used to
maximize the fringe visibility at the start of an ex-periment, and the incident polarization state was assumed not to change during the course of the experiment. Any drift in the incident polarization state would affect the fringe visibility and hence the mea-sured reflectivity accuracy. Also in the case of a bire-fringent FBG a change in the incident polarization state would result in a change of the measured FBG spectrum. Therefore to eliminate these errors a com-mercial OFDR (Luna OVA CTe) capable of polariza-tion resolved measurements has been used for the results presented in this paper [20]. The FBG’s trans-mission spectrum is also measured using the OFDR to accurately scale the measured reflectivity thereby tak-ing into account any connector or fusion splice losses. The FBG’s complex coupling coefficient is calculated from the polarization averaged complex reflectivity us-ing the discrete layer peelus-ing algorithm. Recently a polarization-resolved discrete layer peeling algorithm has been developed [21] and used to investigate UV induced birefringence. Potentially this could be applied to measurements reported in this paper.
The measured UV beam irradiance profile along the axis of the fiber is resampled to the same spatial resolution 共38.4m兲 of the reconstructed coupling coefficient. The magnitude of the coupling coeffi-cient is aligned to the irradiance profile data by a correlation to allow the growth at a specific spatial location to be related to the incident UV irradiance. However it was necessary to perform this correla-tion for each characterizacorrela-tion scan due to variacorrela-tions in the FBG’s measured position as a result of envi-ronmental perturbations in the downlead to the FBG under test. The FBG forms a reflector in one arm of an interferometer, therefore environmental perturbations in the downlead can affect the phase difference between the arms, and hence the mea-sured position of the FBG’s impulse response from which the complex reflectivity is calculated by Fou-rier transformation. The fiber downleads to the OFDR (⬃5 m in length) were insulated from environ-mental perturbations wherever possible. However the repeatability of the OFDR was measured to range from⫾25m for measurements in rapid succession (⬃30 s intervals) to ⫾100m over the course of an experiment共⬃1.75 h兲. Also the UV laser beam point-ing stability affects the FBG growth at a particular position. Any beam movement along the axis of the optical fiber will expose a specific position in the fiber to different irradiances. Any beam movement perpen-dicular to the fiber’s axis will lead to a misalignment affecting all positions in the fiber reducing the inci-dent irradiance. These effects can be minimized by allowing the laser to warm up sufficiently to ensure stable operation.
3. Results
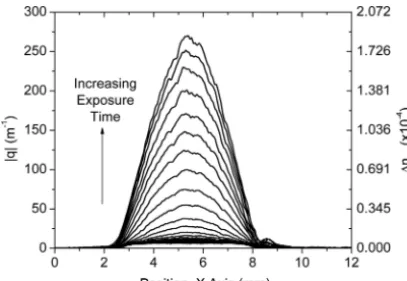
[image:3.603.72.265.505.686.2]The photosensitivity of SMF-28 in its nascent form was characterized. The magnitude of the complex coupling coefficient, |q|, versus position for SMF-28 after centering by correlation with the beam profile is shown in Fig. 3 for increasing exposure times. The Fig. 2. Measured fluorescence profiles of UV beam waist with
Gaussian fits. (a) Horizontal 1兾e2 beam width of 2.4 mm
magnitude of the coupling coefficient is directly pro-portional to ⌬nac共x兲 for an equivalent sinusoidal
re-fractive index modulation as described in Eq. (2). The design Bragg wavelength B was calculated, using
the centroid wavelength of the reflectivity spectrum for the first exposure, to be 1543.830 nm. The guided mode overlap factor was calculated using the Gaussian mode approximation by
⫽1⫺exp
冉
⫺2a 22
冊
, (4)whereais the core radius andis the mode radius. Using values for SMF-28 [22], the core radius is 4.1m and mode field radius is 5.2m, givesto be 0.71. Theacindex modulation⌬nac共x兲was calculated
using these values from the magnitude of the cou-pling coefficient and is added as a second dependent variable axis in Figs. 3 and 4.
Since we also have measured the irradiance profile of the UV beam, these data can be combined to in-vestigate the induced coupling coefficient magnitude for different UV irradiances and as a function of ex-posure time. The growth of the FBG can be plotted as a function of irradiance and is shown in Fig. 4 for a
[image:4.603.67.271.38.178.2] [image:4.603.325.528.39.180.2] [image:4.603.66.270.543.686.2]selected number of exposure times. For the initial exposure of 0.05 s the measured coupling coefficient magnitude is approximately constant for irradiances above 30 W cm⫺2. As the exposure time increases, the UV induced coupling coefficient is observed to in-crease as a function of irradiance. To visualize the growth of |q|, all of the acquired data can be plotted in three dimensions as a growth surface. Figure 5 shows the measured data points, circles, for nonhy-drogen loaded SMF-28 characterizing the UV in-duced coupling coefficient magnitude as a function of incident irradiance (from 0 to 92 W cm⫺2) and accu-mulated exposure time (from 0.050 to 3229.7 s). This surface completely describes the fiber’s photosensi-tivity in terms of the magnitude of the complex coupling coefficient and therefore can be directly used with grating synthesis algorithms to deter-mine the required exposure conditions to fabricate an FBG with a desired spectral response. To use this surface for grating design it is desirable to describe the surface analytically. Therefore we must perform a surface fit to the measured data. Previous photosensitivity measurements have indi-cated a power law growth [23]. However it has also been suggested the growth exhibits a sigmoidal be-havior and exhibits power law characteristics only over a small region of the growth curve [24,25]. It is beyond the scope of this paper to investigate the photosensitivity mechanisms contributing to the measured growth curve. The fundamental under-standing of the UV induced refractive index change is still under investigation [26,27] and references therein. In this work we report the rapid character-ization of the UV induced growth and determine an analytical description of it for FBG fabrication pur-poses. Therefore to investigate the growth function, |q| is plotted for different irradiance values versus the accumulated exposure time on a log–log plot, see Fig. 6. The growth does not follow a power law for all exposure times but does exhibit power law behavior for longer exposure times and at higher irradiances. Fig. 3. Measured coupling coefficient magnitude after alignment
with fluorescence profile and⌬nac共x兲for an equivalent sinusoidal
refractive index modulation.
Fig. 4. Measured coupling coefficient magnitude versus irradi-ance for select exposure times, and⌬nac共x兲for an equivalent
sinu-soidal refractive index modulation.
Fig. 5. (Color online) Measured |q| as a function of accumulated exposure time and incident UV irradiance (circles) and 3D surface fit of Eq. (5). (The color fill of the data points describes the mag-nitude of the residual compared to the standard error of the fit: red
A logistic function was found to best describe grating growth for specific irradiance values versus time, and these fits are shown in Fig. 6. These fits agree very well for the individual data sets, therefore a surface fit based on this logistic function was investigated to describe the growth as a function of irradiance and time. A logistic function of the form
ⱍ
q共I, t兲ⱍ
⫽ A1共I兲⫺A2共I兲1⫹关t兾共I兲兴␣共I兲⫹A2共I兲,
where
A1共I兲⫽a11I 2⫹
a12I⫹a13,
A2共I兲⫽a21I2⫹a22I⫹a23,
共I兲⫽ 1I⫹ 2I⫹ 3,
␣共I兲⫽ ␣1I⫹ ␣2, (5)
was determined to be the best description of the growth surface. The coefficient of determination,R2, for the surface fit was 0.9994, and the coefficients of the logistic surface fit are given in Table 1 with their
respective standard errors. The surface fit is shown in Fig. 5.
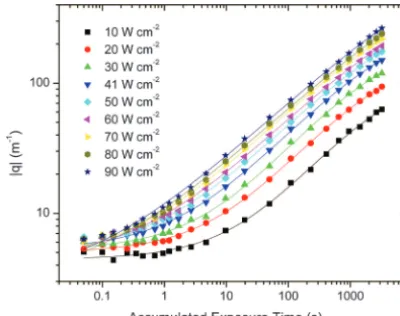
Although it is clear that the change in the UV induced coupling coefficient is irradiance dependent, we can also investigate the growth as a function of the cumulative fluence. The cumulative fluence for all irradiance values is calculated and is plotted for ir-radiance values between 10 and 90 W cm⫺2in Fig. 7. This plot clearly shows that the growth is not purely a function of cumulative fluence, but is dependent on the incident UV irradiance. The resultant UV in-duced coupling coefficient for exposure conditions with equal fluences depends on the irradiance level of the illuminating radiation.
The study of the fiber’s photosensitivity has con-centrated on the magnitude of the coupling coeffi-cient, which is proportional to⌬nacfor an equivalent
sinusoidal grating. However the phase of the coupling coefficient can also be used. The phase described in Eq. (3) describes any excess phase in the grating structure due to a physical chirp of the grating period
共x兲or due to a change of⌬ndc. These two terms have
the same effect on the grating’s response, and there-fore cannot be distinguished between unlessa priori
knowledge of the grating’s structure is used. In this work a uniform period phase mask is used to expose the fiber, therefore we make the assumption that there is no physical chirp of the grating period, i.e.,
共x兲 ⫽ 0. Any excess phase will be the result of a change in⌬ndc共x兲 which can be calculated by
differ-entiation of Eq. (3) with respect tox, yielding
⌬ndc共x兲⫽ ⫺ B
4
d arg关q共x兲兴
dx , (6)
[image:5.603.325.530.38.203.2]The phase of the complex coupling coefficient is differentiated and smoothed using a Savitzky–Golay filter to remove excess noise and is plotted in Fig. 8. It is clear that the phase information exhibits in-creased noise compared with the amplitude informa-tion, especially where the grating structure is very weak, i.e., at the edges. In the center of the grating Fig. 6. (Color online) Log–log plot of |q| versus time for select
[image:5.603.68.268.39.197.2]irradiance values (data points), with individual logistic fits (curve).
Table 1. Coefficients for Logisitic Eq. (5)
Coefficient Value
Standard Error
a11 ⫺1.45⫻10⫺
3 5.10⫻10⫺5
a12 0.138 4.39⫻10⫺3
a13 1.17 5.80⫻10⫺2
a21 ⫺1.9⫻10⫺
3 2.92⫻10⫺3
a22 12.6 0.232
a23 1.1 0.251
1 8.4 0.401
2 431 30.9
3 1570 125
␣1 ⫺7.9⫻10⫺4 3.19⫻10⫺5
␣2 0.5123 3.08⫻10⫺3
[image:5.603.49.289.569.717.2]the differentiated phase indicates a change in ⌬ndc
as a function of position and of similar shape to the UV beam irradiance. This is expected for illumi-nation with a Gaussian beam and gives rise to self-chirping of the grating structure. It is also in-teresting to compare the magnitudes of the ac
anddcrefractive index changes. The peak⌬nacand ⌬ndcfor the accumulated exposure time of 3229.7 s
are 1.866⫻10⫺4and 3.386⫻10⫺4, respectively. The visibility of the fringes can be calculated by the ratio of ⌬nac:⌬ndc and is 0.55. The reduction from unity
fringe visibility may be attributed to the contribution of the zeroth-order beam, and higher-order diffrac-tion beams, reducing the interference fringe’s visibil-ity as well as modifying the fringe modulation shape [28]. Also the nonlinear photosensitivity affects the refractive index modulation shape, which in effect changes the fringe visibility in comparison to a sinu-soidal modulation shape described by⌬nac.
Finally, to compare the response of a number of fibers we have plotted in Fig. 9, the peak |q| versus accumulated exposure time for the following fibers:
Liekki Er25, Fibercore SM1550 (5.3兾80), Nufern CD549 (also called DD17), and Corning LVMX-1 (no longer produced). The Fibercore SM1500 fiber is a high Ge-concentration fiber and exhibits consider-ably higher photosensitivity compared to SMF-28. The remaining fibers are erbium doped fibers and the increased photosensitivity of these fibers is of partic-ular interest for the fabrication of FBG defined fiber lasers. Nufern’s erbium doped fiber, CD549, exhibits the highest UV induced coupling coefficient of the erbium fibers tested.
4. Conclusions
We have demonstrated rapid characterization of FBG growth by the use of OFDR and discrete layer peeling to measure the complex coupling coefficient along the length of the grating during stepwise exposure to a UV beam with a Gaussian profile. These measure-ments are combined with a measurement of the UV writing beam irradiance profile to determine the growth as a function of irradiance and exposure time, thereby providing an experimental determination of the growth surface for the fiber under test. The mea-sured growth surface for SMF-28 is described in terms of the complex coupling coefficient magnitude. The complex coupling coefficient is related to theac
anddcrefractive index changes in the fiber according to Eqs. (2) and (3), however it is not a true measure-ment of the fiber’s photosensitivity in terms of the UV induced refractive index change. Characterization in terms of the coupling coefficient is beneficial for grat-ing design and prevents the need to determine the associated coupling coefficient for nonsinusoidal re-fractive index modulation shapes. Also in comparison to photosensitivity measurements using fringeless UV illumination, direct determination of the coupling coefficient realized in the fiber also includes the effi-ciency of the writing setup.
The surface clearly shows the nonlinear irradi-ance and time dependence of the growth and was found to be best described analytically by a logistic function. A surface fit was performed to the data, and the coefficient of determination,R2, was 0.9994. This technique was applied to the characterization of a selection of fibers and their growth characteristics were compared.
The authors thank Gary A. Miller for provision of the SM1500 fiber to be tested and for the useful discussions regarding the growth surface charac-terization.
References
1. T. Erdogan, “Fiber grating spectra,” J. Lightwave Technol.15,
1277–1294 (1997).
2. A. D. Kersey, M. A. Davis, H. J. Patrick, M. LeBlanc, K. P. Koo, C. G. Askins, M. A. Putnam, and E. J. Friebele, “Fiber grating sensors,” J. Lightwave Technol.15,1442–1463 (1997). 3. C. R. Giles, “Lightwave applications of fiber Bragg gratings,” J.
Lightwave Technol.15,1391–1404 (1997).
[image:6.603.62.274.37.205.2]4. J. Bland-Hawthorn, M. Englund, and G. Edvell, “New ap-proach to atmospheric OH suppression using an aperiodic fibre Bragg grating,” Opt. Express12,5902–5909 (2004).
Fig. 8. Differentiated and smoothed phase of complex coupling coefficient for select exposure times.
[image:6.603.66.268.520.686.2]5. G. Meltz, W. W. Morey, and W. H. Glenn, “Formation of Bragg gratings in optical fibers by a transverse holographic method,” Opt. Lett.14,823– 825 (1989).
6. K. O. Hill, B. Malo, F. Bilodeau, D. C. Johnson, and J. Albert, “Bragg gratings fabricated in monomode photosensitive optical fiber by UV exposure through a phase mask,” Appl. Phys. Lett.
62,1035–1037 (1993).
7. A. Asseh, H. Storoy, B. E. Sahlgren, S. Sandgren, and R. A. H. Stubbe, “A writing technique for long fiber Bragg gratings with complex reflectivity profiles,” J. Lightwave Technol.15,1419 – 1423 (1997).
8. R. Feced, M. N. Zervas, and M. A. Muriel, “An efficient inverse scattering algorithm for the design of nonuniform fiber Bragg gratings,” IEEE J. Quantum Electron.35,1105–1115 (1999). 9. L. Poladian, “Simple grating synthesis algorithm,” Opt. Lett.
25,787–789 (2000).
10. J. Skaar, L. G. Wang, and T. Erdogan, “On the synthesis of fiber Bragg gratings by layer peeling,” IEEE J. Quantum Elec-tron.37,165–173 (2001).
11. J. Skaar and O. H. Waagaard, “Design and characterization of finite-length fiber gratings,” IEEE J. Quantum Electron.39,
1238 –1245 (2003).
12. J. Skaar, “Synthesis and characterization of fiber Bragg grat-ings,” Ph.D. dissertation (The Norwegian University of Science and Technology, 2000).
13. J. A. Besley, L. Reekie, C. Weeks, T. Wang, and C. Murphy, “Grating writing model for materials with nonlinear photosen-sitive response,” J. Lightwave Technol.21,2421–2428 (2003). 14. G. A. Miller, C. G. Askins, and E. J. Friebele, “Modified F-matrix calculation of Bragg grating spectra and its use with a novel nonlinear index growth law,” J. Lightwave Technol.24,
2416 –2427 (2006).
15. G. A. Miller, C. G. Askins, G. A. Cranch, and E. J. Friebele, “Early index growth in germanosilicate fiber upon exposure to continuous wave ultraviolet light,” J. Lightwave Technol.25,
1034 –1044 (2007).
16. D. L. Williams, S. T. Davey, R. Kashyap, J. R. Armitage, and B. J. Ainslie, “Direct observation of UV induced bleaching of
240-nm absorption-band in photosensitive germanosilicate glass-fibers,” Electron. Lett.28,369 –371 (1992).
17. T. Erdogan, V. Mizrahi, P. J. Lemaire, and D. Monroe, “Decay of ultraviolet-induced fiber Bragg gratings,” J. Appl. Phys.76,
73– 80 (1994).
18. Luna Technologies, “Optical Vector Analyzer CTe,” http:// www.lunatechnologies.com/products/ova/files/DATASHEET_ OVACTe.pdf.
19. G. M. H. Flockhart, G. A. Cranch, and C. K. Kirkendall, “Char-acterization of fiber Bragg grating growth using optical fre-quency domain reflectometry and layer-peeling,” in Bragg Gratings, Poling & Photosensitivity兾30th Australian Conference on Optical Fibre Technology (BGPP兾ACOFT)(2005), pp. 76 –78. 20. M. Froggatt, “Distributed measurement of the complex mod-ulation of a photoinduced Bragg grating in an optical fiber,” Appl. Opt.35,5162–5164 (1996).
21. O. H. Waagaard, “Polarization-resolved spatial characteriza-tion of birefringent fiber Bragg gratings,” Opt. Express 14,
4221– 4236 (2006).
22. Corning, “SMF-28e optical fiber product information,” http:// www.corning.com.
23. H. Patrick and S. L. Gilbert, “Growth of Bragg gratings pro-duced by continuous-wave ultraviolet-light in optical-fiber,” Opt. Lett.18,1484 –1486 (1993).
24. B. Poumellec, “Links between writing and erasure (or stabil-ity) of Bragg gratings in disordered media,” J. Non-Cryst. Sol-ids239,108 –115 (1998).
25. J. Canning, “The characteristic curve and site-selective laser excitation of local relaxation in glass,” J. Chem. Phys.120,
9715–9719 (2004).
26. M. Douay, W. X. Xie, B. LeConte, T. Taunay, P. Bernage, P. Niay, P. Cordier, J. F. Bayon, H. Poignant, and E. Delevaque, “Progress in silica optical fibre photosensitivity,” Ann. Tele-commun.52,543–556 (1997).
27. M. Kristensen, “Ultraviolet-light-induced processes in germanium-doped silica,” Phys. Rev. B6414,144201 (2001).