S
TRATHCLYDE
D
ISCUSSION
P
APERS IN
E
CONOMICS
DISAGGREGATING
THE
HOUSEHOLD
SECTOR
IN
A
2004
UK
INPUT
OUTPUT
TABLE
AND
SOCIAL
ACCOUNTING
MATRIX
BY
INCOME
QUINTILES
B
Y
JANINE DE FENCE AND KAREN TURNER
10-28
D
EPARTMENT OF
E
CONOMICS
U
NIVERSITY OF
S
TRATHCLYDE
Disaggregating the Household Sector in a 2004 UK Input Output Table and Social Accounting Matrix by Income Quintiles
By Janine De Fence1* and Karen Turner2
1. Fraser of Allander Institute, Department of Economics, University of Strathclyde. *
Corresponding author: janine.de-fence@strath.ac.uk
2. Stirling Mangement School, Division of Economics, University of Stirling
Acknowledgements: The research reported in this paper has been carried out with the support of
the ESRC First Grants Initiative ESRC grant ref: RES-061-25-0010 and an ESRC funded Climate
Change Leadership Fellowship, grant ref: RES-066-27-0029 awarded to Karen Turner from the
University of Stirling.
1
Abstract. This paper disaggregates a UK Input-Output (IO) table for 2004 based on household
income quintiles from published survey data. In addition to the Input-Output disaggregation, the
household components of a UK Income Expenditure (I-E) account used to inform a Social Accounting
Matrix (SAM),have also been disaggregated by household income quintile. The focus of this paper is
on household expenditure on the UK energy sector.
Key Words: Disaggregated Household Expenditure, Energy Consumption, Input-Output,
Income-Expenditure Accounts.
JEL Codes: Q48, Q41, Q56, J11
Differences in expenditure patterns between household groups within a country or region capture a
increasing fuel poverty, security of energy supply and climate change, require simultaneous and often
conflicting policies in place. However, a current lack of energy expenditure data at the disaggregated
household group level will slow decision makers achieving targets or goals, as well as slow research
into the impact of energy policy instruments on different household groups. As well as informing
energy policy and research, the provision of additional detail on household expenditure will help
inform socio or welfare analyses, and provide general detail about household living standards.
Most publications only consider household income as the basis for observations regarding living
standards and as the basis of policy formulation, for example the Households Below the Average
Income (HBAI) series published by the Department for Work and Pensions. For energy policy in
particular it is essential to have an understanding of energy demand across various household groups
as it is through the demand for energy sector output (energy services) and the linkages between the
energy supply and the local economy that policy will be able to target the basket of energy concerns.
To capture household expenditure and to enable extensions to capture economy wide linkages, we
use data from the UK Input-Output (IO) table for 2004 (produced as part of the work under the ESRC
Climate Change Leadership Fellowship ESRC ref: RES-066-27-00291) to disaggregate household
activity. Using the IO table for aggregate household expenditure data, the first section of this paper
disaggregates household expenditure on goods and services from the UK production sectors based
on household income quintiles using published survey data from the ‘Family Spending: A report on
the 2003-2004 expenditure and food survey’ (EFS)2.
To extend the disaggregation, the second part of this paper then disaggregates the additional income
and expenditure components which make up the complete picture of all household income and
expenditure in the UK economy. The additional components of income and expenditure that we
present in the form of an Income and Expenditure (I-E) account are not recorded in an IO table but
are required for building a social accounting matrix (SAM) .Social accounting matrices present all
transactions within an economy or region including income transfers, and once disaggregated give
the full picture of household trends, regarding both expenditure and sources of income. Thus again,
using published survey data from the Office of National Statistics (ONS) the second part of this paper
disaggregates the I-E account for UK households 2004.
With household expenditure and income disaggregated it is possible to make observations about
different patterns that exist across household income groups, in particular the relationship between
household income and energy expenditure. The findings here show that the higher income groups
spend more on in absolute terms on energy services from the energy sector, yet it is the lowest
income groups that spend a larger share of their income on energy. Where the disaggregated
database in this paper can be used to feed more complex economic models (for example see Lecca
1
To meet project objectives and to allow the user community to observe the value of the tables for pollution accounting a UK IO
table for 2004 was produced under the ESRC climate change leadership fellowship with assistance from the Scottish
Government IO team and the Stockholm Environmental Institute.
2
et al 2010 for a CGE application of household energy efficiency improvements), it will be possible to
answer policy relevant questions that can only be answered when household behaviour and price
changes are taken into account3. However, ahead of more complex modelling (Lecca et al 2010), the
findings here highlight the important differences that exist within UK households with respect to
energy purchases.
Household expenditure disaggregation using the six sector UK input Output (IO) table 2004
Analytical Input-output (IO) tables form the basis of different types of analysis for any national or
regional economy but also used as a dataset have formed the basis of this household expenditure
disaggregation. The IO table used in this paper, produced as part of the work under the ESRC
Climate Change Leadership Fellowship (ESRC ref: RES-066-27-0029) has been aggregated from
123 sectors (based on the UK Standard Industrial Classification of economic activities (SIC))to 6
sectors with a special focus on the energy sector within the UK economy. As well as special focus on
household energy sector expenditure, the higher level of aggregation was also due to the difficulty
mapping between the sector classification used in the data from the EFS and the SIC. IOC code
mapping from 123 to 6 sectors is presented as Appendix A4.
IO tables show the flows of all inputs and outputs throughout the economy over the period of a single
year and can be used as a valuable accounting or modelling tool. Where linkages between local
production and the final demand groups can be quantified, it is possible to calculate output multipliers
(and multipliers relating to key economic performance indicators) which relate final demand to the
output of local production (both directly and indirectly from the linkages between the sectors)5. The
IO framework links household energy demand to the energy sector and therefore energy sector
output, which is closely linked to all production sectors and the performance of the economy. Where
household demand for energy is a derived demand though the use of services which require energy
as an input, any change to energy demand will trigger a multiplier effect throughout the economy that
will stimulate all sectors that the energy sector has linkages with, which will include stimulating the
energy sector itself through own sector purchases.
This disaggregation can be considered a first step in providing the necessary database for a whole
host of analyses (for example, applications using IO models or CGE). As a first step the following
section identifies the absolute values and percentage shares of household energy expenditure from
the UK IO table for 2004.
3
Lecca et al 2010, forthcoming in the Strathclyde Discussion Paper Series, available at:- http://www.strath.ac.uk/economics/research/discussionpapers/
4
In the absence of an analytical UK IO table for 2004 and to meet ESRC CCLF project objectives, the IO table for 2004 used in this study was produced under the ESRC CCLF with assistance from the Scottish Government IO team and the Stockholm Environment Institute (SEI). Available to download at:-
http://www.strath.ac.uk/fraser/research/2004ukindustry-byindustryanalyticalinput-outputtables/ 5
Multipliers for Scotland generated by the Scottish Government IO team are available from :-
http://www.scotland.gov.uk/Topics/Statistics/Browse/Economy/Input-Output. For an impact study using IO multipliers for Scotland see Allan et al 2006, available to download from the Strathclyde Discussion Paper Series,
Household Expenditure Disaggregation
Disaggregation of the household expenditure from the 2004 IO table is based on the ‘Family
Spending: A report on the 2003-2004 expenditure and food survey’ (EFS) which presents information
on household incomes and household expenditure published by the Office of National Statistics
(ONS). The EFS report is the only official source of expenditure data for UK households and is an
amalgamation of the Family Expenditure and National Food surveys (FES and NFS). The EFS report
was primarily the source of spending pattern data for the retail price index and is today used as a
source of information for government and the wider community as it charts changes in household
expenditure and food patterns.
For the financial year 2003-2004, 7048 households took part in the survey with a 58% (from the 7048
households) response rate. Although the sample size is small, the EFS report breaks out household
expenditure by income decile groups over a range of commodities and services, which include a
section titled ‘other items recorded’, which takes into consideration household payments to capital and
investment. The use of survey data as the basis of any household expenditure disaggregation is an
approach that has been used by many other studies such as Druckman and Jackson (2008),who use
survey data to disaggregate households based on geographical location.
The data presented in the EFS splits households into income deciles based on gross weekly income
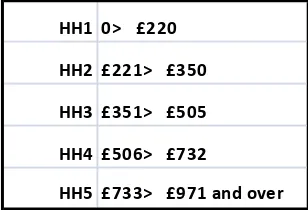
per week. The deciles in the EFS have been aggregated into income quintiles presented in Table 1
[image:5.595.73.227.477.582.2]below.
Table 1- Gross weekly income for five income groups in the UK 2004
HH1 0> £220
HH2 £221> £350
HH3 £351> £505
HH4 £506> £732
HH5 £733> £971 and over
The remainder of this paper is based on the income quintiles identified in Table 1 above.
The range of commodities and services in the EFS is based on the Classification of Individual
Consumption by Purpose (COICOP) which is the coding frame used for the EFS. The COICOP is the
classification system used on Household Budget Surveys (HBS) and across the EU to update the
weights in the basket of goods and services used in consumer price indices. Where the classification
system used in this paper is based on the 6 aggregated sectors from the IO table (Appendix A), a
commodity/service mapping between the EFS report and the IO was required and presented as
Using the mapping between the EFS and the IO, the total spend in each sector was summed and the
share spent by each household income group calculated. The shares calculated were then used to
split out the single household column of sector expenditure in the IO table into five columns of
[image:6.595.73.526.326.528.2]expenditure based on household income group. The results from the calculations are presented in
Table 2 below.
575764 There are two limitations with the current data and methodology, firstly where the majority of the EFS
sectors mapped to the six IO sectors, not all 123 IO sectors within each of the aggregated 6 sectors
were represented by EFS data. Secondly, for the ‘Agriculture, Forestry and Fishing’ no data was
available from the EFS. For this sector the average expenditure for each of the household income
groups was applied to disaggregate this sector.
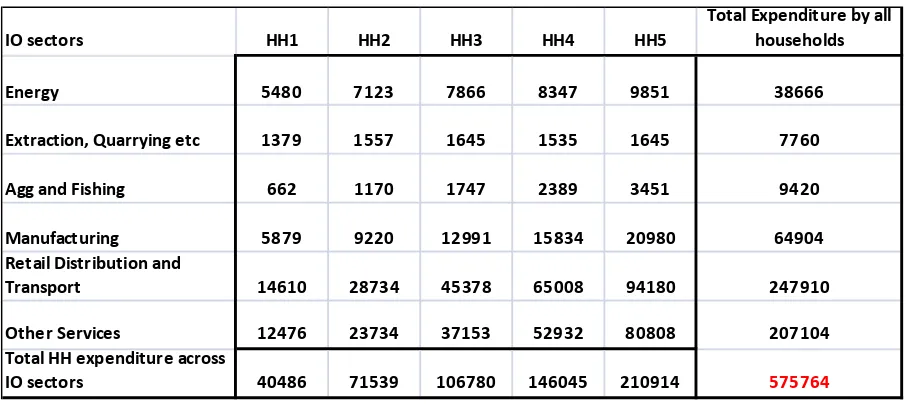
Table 2 below presents the results from the expenditure disaggregation in absolute values.
Table 2- Disaggregated household expenditure across the six sector IO table (expressed as £million and in absolute
values)
IO sectors HH1 HH2 HH3 HH4 HH5
Total Expenditure by all
households
Energy 5480 7123 7866 8347 9851 38666
Extraction, Quarrying etc 1379 1557 1645 1535 1645 7760
Agg and Fishing 662 1170 1747 2389 3451 9420
Manufacturing 5879 9220 12991 15834 20980 64904
Retail Distribution and
Transport 14610 28734 45378 65008 94180 247910
Other Services 12476 23734 37153 52932 80808 207104
Total HH expenditure across
IO sectors 40486 71539 106780 146045 210914
The row totals in Table 2 represent total household expenditure across each of the sectors in the six
sector IO table, where the entry 575764 (£ million) represents total household expenditure across all
sectors in the UK economy. Column totals represent the total expenditure by each of the household
income groups across all of the six IO sectors.
Where the absolute values are important to form the basis of datasets for economic analysis, to make
observations about household income group expenditure it is necessary to calculate the percentage
shares of sector expenditure allocated to each household group. As well as the shares of overall
sector expenditure from each income group it is indicative to calculate the proportion of income, as a
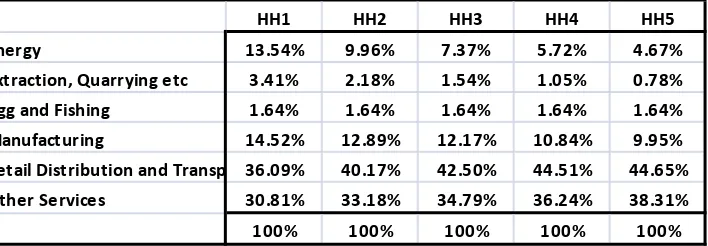
percentage share, that is spent on each sector. Both Table 3 and Table 4 are based on the absolute
values presented in Table 2.
HH1 HH2 HH3 HH4 HH5
Energy 13.54% 9.96% 7.37% 5.72% 4.67%
Extraction, Quarrying etc 3.41% 2.18% 1.54% 1.05% 0.78%
Agg and Fishing 1.64% 1.64% 1.64% 1.64% 1.64%
Manufacturing 14.52% 12.89% 12.17% 10.84% 9.95%
Retail Distribution and Transp 36.09% 40.17% 42.50% 44.51% 44.65%
Other Services 30.81% 33.18% 34.79% 36.24% 38.31%
[image:7.595.83.437.72.195.2]100% 100% 100% 100% 100%
Table 3 shows the shares of income spent on each of the IO sectors by each income group. Note that
the lower household income groups spend a larger share of income on energy services (heating and
lighting in the home) and manufacturing (food and clothing is included in the manufacturing sector),
whereas the higher income groups spend a larger share of income on ‘luxury’ spends within the
‘Retail Distribution and Transport’ and the ‘Other services’ sectors (which include air travel and hotel
expenditure).
To look at the contribution of each household group to overall household sector expenditure, the
share of each household income groups expenditure out of total expenditure is given in Table 4
below.
Table 4- Household Income Group Expenditure as a share of total household expenditure.
HH1 HH2 HH3 HH4 HH5
Total Expenditure
by all households
Energy 14.17% 18.42% 20.34% 21.59% 25.48% 100%
Extraction, Quarrying etc 17.77% 20.06% 21.20% 19.78% 21.20% 100%
Agg and Fishing 7.03% 12.43% 18.55% 25.37% 36.63% 100%
Manufacturing 9.06% 14.21% 20.02% 24.40% 32.32% 100%
Retail Distribution and Transp 5.89% 11.59% 18.30% 26.22% 37.99% 100%
Other Services 6.02% 11.46% 17.94% 25.56% 39.02% 100%
Observing the different direction in results between Table 3 and 4, we see the key observations from
this expenditure disaggregation. In Table 3 energy expenditure is highest among the low income
households as a proportion of their income, but in Table 4 we see that as a share of total household
expenditure it is the high earning income group that contribute the largest amount. For energy policy
that directly impacts household expenditure (either through improvements to energy efficiency in the
home or through increases in the cost to use energy), the impact and corresponding change in
expenditure may, based on this observation, lead to a difference in response between household
income groups (for example, Lecca et al 2010, find larger rebound effects in energy consumption are
triggered in low income households due to the larger share of income impacted when the implicit price
of energy is lowered). This observation does not apply solely to the energy sector, as other sectors
services’ and ‘retail, distribution and transport’ sectors show results in the opposite direction, with the
lowest earning groups devoting the least amount and share of their income (but the highest income
groups still contribute the largest share out of total expenditure).
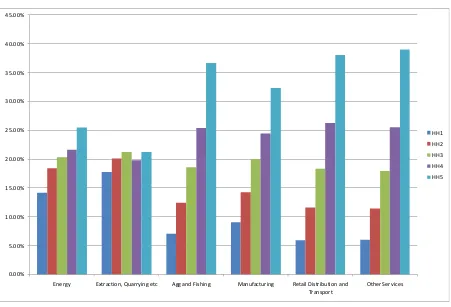
[image:8.595.75.526.190.496.2]To capture these results in more detail Figures 1 and 2 chart the data presented in Table 3 and 4.
Figure 1- Shares of household expenditure as a percentage of total income group expenditure (data taken from Table
3).
0.00% 5.00% 10.00% 15.00% 20.00% 25.00% 30.00% 35.00% 40.00% 45.00% 50.00%
Energy Extraction, Quarrying etc Agg and Fishing Manufacturing Retail Distribution and
Transport
Other Services
HH1
HH2
HH3
HH4
HH5
* Sector shares sum to total household income group expenditure.
** Lack of expenditure data on the agriculture and fishing sector means that this is no representative of actual household
expenditure on this sector.
What we can see from Figure 1 are the differences in expenditure when we consider how each
household quintile spends its own income across the six UK IO sectors. Taking the same data from
an alternative perspective, we can see in Figure 2 the shares of total sector expenditure across the
same six sectors, but this time considering household contributions from total sector expenditure as
Figure 2- Share of total expenditure in each sector by each household income group (data taken from Table 4).
0.00% 5.00% 10.00% 15.00% 20.00% 25.00% 30.00% 35.00% 40.00% 45.00%
Energy Extraction, Quarrying etc Agg and Fishing Manufacturing Retail Distribution and
Transport
Other Services
HH1
HH2
HH3
HH4
HH5
*Shares sum to household expenditure from total sector expenditure.
Disaggregation of the Household Sector within the Income- Expenditure Account for the UK
SAM 2004
Income- Expenditure (I-E) accounts give the additional data components necessary to build a social
accounting matrix (SAM) from an IO table. That is, they record total household income which is not
limited to the income from employment that is recorded in the IO table. All expenditures are also
included, and therefore not limited to the expenditure on goods and services in the IO table. For
information on I-E accounts see Chapter 5, Turner (2002), where the transition from IO to SAM and
the components of I-E accounts are discussed in detail. For this paper it is important to note that the
household section in the I-E account presents the additional components of income and expenditure
that are not present in the IO table. Additional components show all the income and expenditure
transactions that take place within a national or regional economy. This gives a full picture of the
relationships between each household income group and other groups within the economy
(government, corporations, savings and payments/income to/from abroad).
Data on sources of household income are inconsistent between the published reports such as the
EFS, the HBAI and ONS publications. For consistency with the expenditure disaggregation, the EFS
report is the primary source of data for disaggregating the household components in the I-E account
here. Additional data were used from a report from the ONS (see Economic Trends No.620) titled
the EFS and shows how taxes and benefits redistribute income between various groups of UK
households. The Economic Trend report shows how Government intervention through taxes and
benefits alters the income of households. Data in this report enabled disaggregation of payments to
households from the government and also payments to the government from each household group.
It is important to note that this disaggregation does not split out the row of imports in the IO table
which would be necessary for a complete representation of household expenditure across all goods
and services. For import disaggregation based on the same household income quintiles, see Lecca et
al 2010.
There are two points to note about this part of the work, firstly the aim of the household I-E
disaggregation is to give a fuller descriptive picture and to fulfil the database requirements for more
complex economic modelling. Limited published data has meant that assumptions were necessary in
mapping between data sources and the I-E accounts, which may require revision when or if further
data become available. Secondly, although the I-E account presents information on payments from
abroad (interest payments from foreign accounts or shares) and payments to abroad (payments for
overseas services which is not tourist expenditure), where data on foreign transfers is limited and to
allow internally consistent accounts these sections are used as balancing entries in the aggregated
and disaggregated I-E accounts.
Household Income in the IE Account
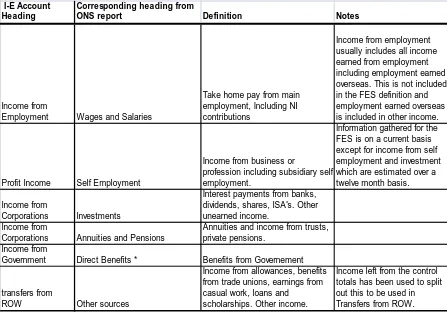
Sources of household income are broken down into six categories in the I-E account. Of these six
headings the corresponding mapping to the ONS report and EFS data are given, along with
Table 5- Sources of household income in the IE account with mapping to ONS/EFS report data, plus definitions.
I-E Account Heading
Corresponding heading from
ONS report Definition Notes
Income from
Employment Wages and Salaries
Take home pay from main employment, Including NI contributions
Income from employment usually includes all income earned from employment including employment earned overseas. This is not included in the FES definition and employment earned overseas is included in other income.
Profit Income Self Employment
Income from business or
profession including subsidiary self employment.
Information gathered for the FES is on a current basis except for income from self employment and investment which are estimated over a twelve month basis.
Income from
Corporations Investments
Interest payments from banks, dividends, shares, ISA's. Other unearned income.
Income from
Corporations Annuities and Pensions
Annuities and income from trusts, private pensions.
Income from
Government Direct Benefits * Benefits from Governement
transfers from
ROW Other sources
Income from allowances, benefits from trade unions, earnings from casual work, loans and
scholarships. Other income.
Income left from the control totals has been used to split out this to be used in Transfers from ROW.
Data from the ONS report and the EFS were used to calculate the proportion of household income
earned from each component given in Table 5. With the shares, the aggregate data from the UK 2004
household account in the IE was disaggregated. The absolute values of income can be presented as
percentage shares in Table 6 below.
Table 6- Percentage shares of household income from each household income group.
HH1 HH2 HH3 HH4 HH5
Income
Income from employment 22.32% 40.45% 55.99% 64.03% 67.21%
Profit income (OVA) 4.14% 4.37% 3.31% 6.58% 9.82%
Income from corporations 22.00% 25.28% 24.96% 21.32% 20.08%
Income from government 44.38% 25.00% 11.23% 4.93% 1.50%
Transfers from ROW 7.17% 4.90% 4.51% 3.13% 2.47%
100% 100% 100% 100% 100%
The direction of the results in Table 6 illustrates differences which exist between the income groups.
Namely, for the low income groups the percentage transferred from the Government in comparison to
the higher income groups.
Out of the aggregated components of household income we can see the shares that are attributable
[image:11.595.74.476.553.656.2]contribution from the higher earning income groups, and the largest government expenditure to fund
[image:12.595.73.520.142.232.2]income is on the lower household income groups.
Table 7- Percentage shares of income sources from aggregate household income sources.
Household Income HH1 HH2 HH3 HH4 HH5
Income
Income from employment 2.24% 7.42% 16.34% 26.30% 47.70% 100%
Profit income (OVA) 3.50% 6.76% 8.14% 22.81% 58.79% 100%
Income from corporations 5.94% 12.48% 19.62% 23.59% 38.37% 100%
Income from government 28.88% 29.76% 21.29% 13.16% 6.91% 100%
Transfers from ROW 12.02% 15.03% 22.04% 21.54% 29.36% 100%
Household Expenditure
As with the income components from the IE account, the expenditure components of the IE table
have also been disaggregated by income quintile.
There are four components as indentified by Turner (2002)(excluding payments to the external sector)
of household expenditure which have been calculated based on data available. These are given
below.
• IO expenditure (goods and services) - calculated directly from the IO expenditure
disaggregation above.
• Payments to the Government - calculated using tax information presented in the ONS report
(Economic Trends No.620) titled ‘The effects of taxes and benefits on household income,
2003-04’.
• Payments to corporations and capital- calculated using data from the EFS 2003-2004. Within
the detailed household expenditure by gross income decile group section 14 titled ‘Other
items recorded’ gives information on household savings and investments. Data from this
table was used to split out two sections due to limitations in the data.
• Payments to the external sector – balancing identity within each account.
The expenditure component ‘Payments to the external sector’ was used as a balancing identity within
each of the household accounts as no data was available for this component. Where other sections in
these accounts have been calculated based on limited data, the payments to external section is the
residual to balance the five household accounts.
Table 8 shows the percentage contribution each household makes to overall household expenditure
in the UK economy. IO expenditure corresponds to the consumption of goods and services in the UK
economy which was disaggregated in section 1 of this paper. The remaining components of the
expenditure account relate to direct and indirect tax payments to the Government, payments to
private corporations and any savings or investments. As with Table 7 above, the quantitative value of
each entry may be revised in the future with more transparent data sources. However, the direction of
as a whole and this would not be expected to change. This is not just on goods and services for
consumption, with this group having a much higher rate of saving, as well as contributing the most in
terms of tax contributions included in payments to the Government. According to the quantitative
results in this paper, there exist large differences between the higher income groups over payments to
capital (savings and investments).
Table 8- Percentage share of household expenditure as a share of total household expenditure.
Household Expenditure HH1 HH2 HH3 HH4 HH5
IO expenditure 7.03% 12.43% 18.55% 25.37% 36.63% 100.00%
Payments to corporations 1.74% 4.29% 11.33% 21.13% 61.51% 100.00%
Payments to government 3.02% 6.67% 14.21% 24.50% 51.60% 100.00%
Payments to capital 1.69% 4.16% 10.98% 23.56% 59.62% 100.00%
Payments to ROW 12.26% 21.13% 25.17% 10.57% 30.88% 100.00%
Table 9 presents the percentage share of household expenditure from each of the household income
groups total expenditure.
Table 9- Percentage shares of household expenditure from total household income group expenditure.
Household Expenditure HH1 HH2 HH3 HH4 HH5
IO expenditure 78.06% 75.41% 70.70% 68.73% 57.44%
Payments to corporations 1.94% 2.62% 4.34% 5.76% 9.70%
Payments to government 10.12% 12.23% 16.37% 20.05% 24.44%
Payments to capital 1.06% 1.42% 2.36% 3.60% 5.27%
Payments to ROW 8.82% 8.31% 6.22% 1.86% 3.14%
100% 100% 100% 100% 100%
The results show that as a proportion of household income group expenditure, the lowest income
group spend the largest share of their income (but from Table 3 this equates to the lower share of
total sector expenditure out of the household groups) on goods and services in the UK IO table. IO
expenditure includes payments for housing, which indicates that after payments for essential goods
and services (energy services and food and drink in the manufacturing sector earlier identified) and
payments for housing, the lower income groups have less income available to allocate to other
expenditure components6. Moreover, they contribute the lowest in terms of taxes to the Government.
The highest income group contribute the largest share, relative to the other income groups, to all the
components in the expenditure account but as a group they allocate the lowest share of their own
income to goods and services in the IO table. (Table 8 showed that overall the highest income group
represent the largest share of economy wide expenditure on produced goods and services in the UK).
Appendix B presents the disaggregated household components in the I-E account.
6
Confirmation of this would require further analysis of household behaviours to make a more accurate
assumption regarding low income group expenditure. The observation here is based on the disaggregated
Conclusions
Based on the disaggregated data applied and presented in this paper, it is possible to make
observations regarding household expenditure disaggregated by income in relation to UK production
sectors and also in terms of economic contributions (from the I-E account). The purpose of this paper
was twofold: firstly to make observations regarding household expenditure patterns at a
disaggregated level from published IO data; and secondly to disaggregate the household data to fulfil
the data requirements needed for more complex economic modelling such as IO analysis or CGE
modelling. Further modelling using the household dataset has already been performed in Lecca et al
2010, where an analysis of household energy efficiency improvements is presented.
As a tool for observation, the disaggregation showed that key to the formulation of energy policy
(where several goals have to be reached at the same time) is to identify the differences exist between
household groups. Low income households spend more of their income on energy services yet
contribute the lowest amount at the economy wide level. On the other hand, the highest earning
income group spend the smallest proportion of their income but contribute the most in absolute terms.
This raises interesting questions for the formulation of energy policy, and for addressing energy
concerns such as fuel poverty.
Where the observation relating to energy service expenditure and income may not be surprising, the
second purpose of this paper will allow economic models to analyse this relationship further.
Therefore, where the disaggregation exercise in this paper was extended to include the additional
components of data in an IE account for the creation of a SAM, the results will hopefully be used to
feed into other economic analyses that attempt to answer policy relevant questions relating to
References
1. Allan, G., McGregor, P., Swales, J.K. and Turner, K. (2006) The impact of alternative electricity generation technologies on the Scottish economy: an illustrative Input-Output analysis, Strathclyde Discussion Papers in Economics, No 06-02, available to download at:
http://www.strath.ac.uk/media/departments/economics/researchdiscussionpapers/2006/media _34009_en.pdf
2. Druckman, A. and Jackson, T. (2008) ‘Household energy consumption in the UK: a highly geographically and socio-economically disaggregated model’, Energy Policy, Vol. 36, pp1-19.
3. Jones, F. (2005) 'The effects of taxes and benefits on household income, 2003-04', Economic Trends, no.620, July, pp.15-60. Published by the Office of National Statistics.
4. Lecca, P., Swales, J.K. and Turner, K. (2010) Rebound effects from an increase in efficiency in the use of energy by UK households, forthcoming in Strathclyde Discussion Papers in Economics, will be available at
http://www.strath.ac.uk/economics/research/discussionpapers/
5. Office of National Statistics (ONS) Family Spending: A report on the 2003-2004 expenditure and food survey. Available for download at:
http://www.statistics.gov.uk/downloads/theme_social/Family_Spending_2003-04/FamilySpending2003-04.pdf
6. Office of National Statistics (ONS),
http://darp.lse.ac.uk/Resources/Data/UK/EconomicTrends/TaxBenefits2003-04.pdf
7. Turner K. (2002), ‘Modelling the Impact of Policy and Other Disturbances on Sustainability Policy Indicators in Jersey: an Economic-Environmental Regional Computable General Equilibrium Analysis’, Chapter 5, Ph.D. thesis, University of Strathclyde.
8. UK 2004 Input Output Table, description and download available from-
Appendix- A
6 Sectors From 123 Sectors (IOC) From 25 sectors to 6
1 Energy 4, 35, 85,86, 21,22,23,24
2 Extraction, Quarrying, Construction and Water Supply 5, 6,7,87,88 5,6, 13,14
3 Agriculture and Fishing 1,2,3 1,2,3,4
4 Manufacturing 8-34, 36-84 7,8,9,10,11,12
5 Retail, Distribution and Transport 89-99 15,16,
Appendix B
£million
Households 1 Households
Income 65,737 Expenditure 65,737
Income from employment 14,673 IO expenditure 51,312
Profit income (OVA) 2,722 Payments to corporations 1,278
Income from corporations 14,459 Payments to government 6,652
Income from government 29,173 Payments to capital 694
Transfers from ROW 4,711 Payments to ROW 5,801
Total Household Income (Balancing T 65,737 Total Expenditure 65,737
£million
Households 2 Households
Income 120,232 Expenditure 120,232
Income from employment 48,634 IO expenditure 90,669
Profit income (OVA) 5,253 Payments to corporations 3,148
Income from corporations 30,397 Payments to government 14,708
Income from government 30,058 Payments to capital 1,710
Transfers from ROW 5,889 Payments to ROW 9,997
Total Household Income (Balancing T 120,232 Total Expenditure 120,232
£million
Households 3 Households
Income 191,411 Expenditure 191,412
Income from employment 107,164 IO expenditure 135,333
Profit income (OVA) 6,326 Payments to corporations 8,316
Income from corporations 47,781 Payments to government 31,335
Income from government 21,503 Payments to capital 4,518
Transfers from ROW 8,637 Payments to ROW 11,910
Total Household Income (Balancing T 191,411 Total Expenditure 191,412
£million
Households 4 Households
Income 269,320 Expenditure 269,320
Income from employment 172,436 IO expenditure 185,098
Profit income (OVA) 17,723 Payments to corporations 15,515
Income from corporations 57,432 Payments to government 54,012
Income from government 13,289 Payments to capital 9,694
Transfers from ROW 8,440 Payments to ROW 5,000
Total Household Income (Balancing T 269,320 Total Expenditure 269,320
£million
Households 5 Households
Income 465,361 Expenditure 465,361
Income from employment 312,767 IO expenditure 267,314
Profit income (OVA) 45,685 Payments to corporations 45,155
Income from corporations 93,426 Payments to government 113,753
Income from government 6,981 Payments to capital 24,530
Transfers from ROW 11,503 Payments to ROW 14,610
Appendix C- Mapping the IO sectors to the COICOP sections in the EFS 2003-2004
IO Aggregated Sector
Section (s) Classifications
based on the COICOP from
the EFS 2003‐2004 Section and sub‐section Names
1 Energy 4.4 Electricity, Gas and Other fuels
4.4.1 Electricity
4.4.2 Gas
4.4.3 Other Fuels
2
Extraction, Quarrying,
Construciton and Water
Supply 4.3
Water supply and miscellaneous services relating to the dwelling
3
Agriculture, Forestry and
Fishing See note below
4 Manufacturing 1 Food and non‐alcoholic drinks
2 Alcoholic drinks and tobacco
3 Clothing and footwear
5 Household goods and services
9.1 Audio Visual and information processing equipment
9.2 Other major durables for recreation and culture
9.3 Other recreational items and equipment, gardens and pets
12.1 Personal care
5 Retail Distribution and Transpor7 Transport
11 Restaurants and hotels
8 Communication
6 Other Services 6 Health
9.4 Recreational and cultural services
10 education
12.4 Insurance
12.5 Other Services