Modelling and Managing Reliability Growth in Engineering Design Process
Lesley Walls
*1and John Quigley
*1 *1 Department of Management ScienceUniversity of Strathclyde Glasgow, G1 1QE, Scotland [email protected]
Abstract
Reliability is vital for safe and efficient operation of systems. Decisions about the configuration and selection of parts within a system, and the development activities to prove the chosen design, will influence the inherent reliability. Modelling provides a mechanism for explicating the relationship between the engineering activities and the statistical measures of reliability so that useful estimates of reliability can be obtained. Reliability modelling should be aligned to support the decisions taken during design and development. We examine why and how a reliability growth model can be structured, the type of data required and available to populate them, the selection of relevant summary measures, the process for updating estimates and feeding back into design to support planning decisions. The modelling process described is informed by our theoretical background in management science and our practical experience of working with UK industry.
1. Introduction
Reliability is a key operating objective for many organisations. Some industries have a long tradition of reliability analysis, such as those operating safety-critical plant which are highly regulated and for which analysis contributes evidence about the safe and effective operation. For organisations which seek to sell quality products, reliability is an important feature because it represents quality through time. For example, reliability is used widely in marketing campaigns for consumer durables and can be used to differentiate products from competitors through, for example, the provision of extended warranties.
Some markets have business models that provide financial incentives for designing reliability into products. This is consistent with the goal of minimising failures in operation and the associated costs, tangible and intangible, that any loss of service incurs. Such models have existed in some sectors, such as consumer products, for some time. While in others, such as the aerospace and defences industries, the adoption of performance based contracts is more recent and requires a shift in reliability culture from one where suppliers are passive and failure is implicitly condoned to a more proactive approach. Performance based contracts give manufacturers an incentive to design high availability systems to maximize income and to minimise any financial penalties if agreed service is not realised.
Designing reliability into systems does not necessarily mean designing perfect reliability. While “zero failures” may be a laudable goal, realistically it may not always be achievable. There is a need to trade-off the cost of finding potential failures, which are a source of unreliability, and the cost of responding to failures in operation. How such trade-offs are made will depend on the product and its market; see, for example, [1, 2].
In this paper we introduce a modelling framework to support estimation of reliability during product development, and the trade-offs between alternative strategies to grow reliability so that the operational requirements are achieved within budget. We begin by discussing the role of reliability modelling within the systems engineering process in Section 2 and outlining the key stages of the modelling process. In Section 3 we describe each key stage of modelling showing insights into the logic, the input data structures, the types of output provided and the way in which these can be used to support engineering management decisions. The approach developed and described is grounded in our practical work in the UK aerospace industry and has been applied in industrial cases through which it has been validated.
2. Reliability in Systems Engineering
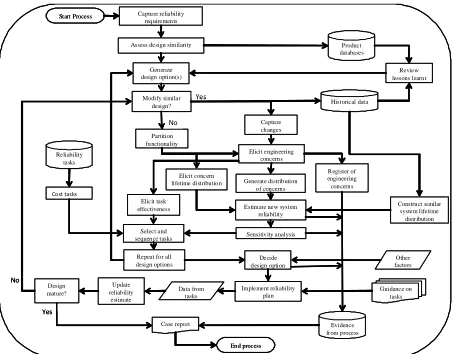
Systems engineering is described [3] as ”a robust approach to the design, creation, and operation of systems”. Reliability is a characteristic of the performance of an operational system, but inherent reliability is built into the product during its design.Fig. 1 Overview of reliability modelling process
can be controlled during the design process does not mean that estimating system reliability is predictable because there will exist uncertainties in the system interactions due to, for example, unexpected reactions between connected parts, as well as interactions between the product and its operating environment. These systemic effects may be difficult to identify, although depending upon the class of design, there may be opportunities to learn from heritage systems and to exploit engineering knowledge to better understand the implications of design decisions; whether they are changes to earlier product generations intended to remove design weaknesses or innovations that introduce new technology.
To assess reliability during design, we need to be able to estimate appropriate measures of reliability and communicate these in such a way that they can be used to inform engineering and management decisions. Integrating reliability into the development process is important because it allows identification of relevant data to feed into analysis and the opportunity for results of analysis to feedback to the design team.
Figure 1 shows the proposed modelling process which takes as inputs the product requirements, information about the relationships to the product family and relevant data in the form of, for example, operational experience and engineering judgement about what reliability problems have been experienced by heritage products and when they occurred. The outputs of the model will be information about reliability concerns for the new design, statistical estimates of reliability, information about predicted impact of reliability development options and other information that will contribute to design reviews and planning decisions.
[image:2.595.315.554.84.239.2]3. Reliability Growth Modelling
Many texts [5, 6] provide details about the standard reliability modelling methods including Fault and Event Trees, Lifetime Data Analysis, Reliability GrowthFig. 2 Key modelling steps
modelling. This list is not exhaustive. Influenced by the theory underpinning such modelling approaches and the practice of supporting reliability decisions using relevant data, we develop a stochastic model whose key steps are shown in Figure 2. That is, we use a mix of engineering judgements and statistical experience data as inputs to modelling. The positive loop implies that we believe a virtuous, iterative cycle exists between the two data sources. We focus our model on supporting the types of decisions to be made by engineers and management so that they may take actions, from which new data will be generated and fed-back into the cycle of modelling thus allowing reliability growth and level to be estimated to support assessment and planning.
In the following subsections, we shall discuss the reasoning of the analyst in approaching the development of the reliability model. Note that the practical stages in implementing the reliability model in the engineering context, as shown in Figure 1 and 2, will differ from this process of thinking through the rationale of the model from the perspective of the analyst.
3.1 Reliability indicators relevant to decisions
Reliability models should provide information that assists the engineer to assess how forecast performance matches user requirements, to understand the strengths and weaknesses of the design appreciating how this engineering understanding translates to a credible estimate, and to measure the potential and actual impact of downstream activities such as test and analysis.
Consider, for example, how we might translate requirements into reliability parameters. A requirement that the expected time to the first failure of a complex system is at least Y hours can translate to the calculation of the expectation of the distribution of the times to first failure of the population of items which is compared against Y hours. For further discussion of how product requirements can be specified and translated into meaningful statistics see [7]. The example given suggests point estimates only, but of course these can, and indeed should, be developed to include appropriate No
Yes
Elicit task effectiveness Select and sequence tasks Cost tasks
Guidance on tasks Data from
tasks
End process
Evidence fr om process Design
mature?
Yes No
Modify similar design?
Partition functionality
Historical data
Elicit engineering concerns Generate distribution
of concerns
Register of engineering concerns
Construct similar system lifetime
distribution Estimate new system
reliability Capture reliability
requirements Assess design similarity
Review lessons learnt Product databases Start Process
Generate design option(s)
Capture changes
Elicit concern lifetime distribution
Sensitivity analysis Reliability
tasks
Decide design option Repeat for all
design options
Implement reliability plan Update
reliability estimate
Other factors
Case report
No Yes
Elicit task effectiveness Select and sequence tasks Cost tasks
Guidance on tasks Data from
tasks
End process
Evidence fr om process Design
mature?
Yes No
Modify similar design?
Partition functionality
Historical data
Elicit engineering concerns Generate distribution
of concerns
Register of engineering concerns
Construct similar system lifetime
distribution Estimate new system
reliability Capture reliability
requirements Assess design similarity
Review lessons learnt Product databases Start Process
Generate design option(s)
Capture changes
Elicit concern lifetime distribution
Sensitivity analysis Reliability
tasks
Decide design option Repeat for all
design options
Implement reliability plan Update
reliability estimate
Other factors
Case report
Historical Data Analysis
Elicitation of Expert Judgement Modelling
Decision Support
+ Action
Data
An
al
y
si
s
An
al
y
si
s
Historical Data Analysis
Elicitation of Expert Judgement Modelling
Decision Support
+ Action
Data
An
al
y
si
s
An
al
y
si
interval estimates to capture our uncertainties and they should be amenable to updating as the design matures through development.
3.2 Relevant data available to populate model By
data, we mean an appropriate combination of hard numerical information about failure events to related products through to soft judgemental data representing the engineering state of knowledge about a design. Tension will invariably exist between the data available and the data required to populate a model. The scientific process indicates that the model should be specified in advance so that the data requirements can be established and relevant data collected by an effective and efficient process. Pragmatically, exploratory analysis will endeavour to make best use of the relevant operational and knowledge data that is accessible and affordable.
Consider typical sources and types of data available to support reliability analysis, in particular at the early design stage. The experience of the relevant engineers who are involved in the design, test, manufacture, operation and maintenance of the new system and any related products or parts will be fundamental. This knowledge will be invaluable in providing insights into possible weaknesses of the proposed design that may lead to failures in operating system and hence diminished reliability. An issue to beware is the potential biases inherent in judgements, the most obvious being the very different mind-set of the design and reliability engineers. The former will be focussed upon designing a system to deliver functionality, while the latter will be risk averse in thinking about ways in which the system will fail to deliver its functionality. There is a need to manage the elicitation of engineering knowledge to provide useful, relevant data [8].
Hard quantitative data can be regarded as more respectable than soft judgements, although whether this will always be true is open to debate. Many organisations routinely collect data about the performance of their products in service [9, 10]. The primary use may be management reports for the product in the market, but such data can be extremely valuable to the design of new systems, especially if they share common features or environments. Usually such data are transformed from its raw state, which could be conceptualised as sequences of events through time, for example, into failure rates.
It is common, particularly in industries operating safety-critical process plants, to share data across organisations and even nations, for common parts. Examples include, although are not limited to, OREDA for North Sea Offshore Oil and Gas Industry, MIK-HDBK-217 for electronic components, EiReDA for European nuclear power plants. Such databases typically contain failure rates, and confidence limits, for specific parts operating in given environments. If a match can be made between an element in the new design and a database entry, then the data can be used as an estimate of the part reliability and propagated through the system reliability model.
As a design progresses through development, new data will be forthcoming from test and analysis of the prototype system or parts. New data can include details of failure modes realised, test hours until failures were observed, as well as forensic analysis to investigate the root cause of the failure. As a consequence of development, engineering knowledge will change through interpretation of the results. When in service, experience data can be collected in the form of, for example, the population of systems at risk and the times at which intended, or unintended, events take place. The former will include inspections, maintenance and repair, while the latter may be failure events. Such data will not only provide estimates of the operational reliability, which can be used to update earlier estimates and to calibrate the modelling process, but also as information to be fed-forward to new system design analysis.
3.3 Concepts of stochastic reliability model We
assume that a new system design contains enumerable engineering concerns (N), which may be residual weaknesses not fully addressed by the re-design or uncertainties arising through innovation. We use the term system in its broadest sense and, for any application, the item of interest may correspond to, for example, an integrated system, a line replaceable unit, a sub-assembly or some other part that is considered an entity. A concern represents an engineering explanation of why a system may be in a faulty state. We use the term concern deliberately as it represents the engineering epistemic uncertainty about the new design. A concern maps to a potential root cause of failure if we were to use conventional reliability terminology as discussed in [12].
Fig. 3 Model logic linking subjective engineering concerns about the design to realized failures in operation
This line of reasoning can be extended to multiple concerns as shown below so that we may express the system estimate by the product function, assuming that concerns are statistically independent
.
More formally we can write this stochastic model generally as follows. A failure taxonomy is defined a priori and comprises C classes, which categorise the concern according to root cause. The number of concerns in class i is denoted by Ni and the distribution
function of the operational time, t, to realise a particular concern in class i is denoted by Fi(t). For class i, we
form a prior distribution to describe the experts’ belief in the number of concerns, Ni, likely to be inherent in
the design. The prior is denoted by πi(Ni=ni) and can be
elicited using a structured process [13].
The density function of the time to realise the kth concern within a particular class can be expressed as:
( )
(
( ))
( ) (
)
( )
( )
( )
i
k i
k-1 N -k
i
i i i
k k N N
i
N !
f t t E F t f t 1-F t
k-1 ! N -k !
k ≥ ⎡ ⎤ = = ⎢ ⎡⎣ ⎤⎦ ⎡⎣ ⎤⎦ ⎥ ⎢ ⎥ ⎣ ⎦
Assuming the realisation of concerns is independent, the distribution function of the time to first failure of the system is given by:
( )
{
}
( )
ii C
N
N i
i=1
F t 1 Pr all concerns detected after time t
1 E 1-F t
= −
= −
∏
⎡⎣ ⎤⎦The distribution of time until all concerns have been realised for the C classes is constructed by a similar argument giving:
( )
( )
iC
N i i=1
F t =
∏
E F t⎡⎣ ⎤⎦The realisation of concerns through failure can be conceptualised as a point process. Using the same assumptions as before, the expected number of concerns that have been realised by time t are:
( )
C( )
C i[ ]
( )
i N i i
i=1 i=1
E N t⎡⎣ ⎤⎦=
∑
E N t⎡⎣ ⎤⎦=∑
E N F t3.4 Estimating the reliability function The modelling
analysis can be represented graphically. Figure 4 shows the reliability functions for three failure classes. Class 1 has the poorest profile and class 3 the best. Combining reliability profiles of all relevant failure classes with engineering judgement for the number and type of concerns, gives the modelling outputs shown in Figure 5. Three reliability functions are shown. Current represents the estimate at the given point in development, while early refers to an initial estimate at some previous design review. By exploring possible future scenarios which might lead to the removal of faults, we can also make a forecast of the reliability function.
Fig. 4 Reliability function estimated from historical data from earlier product generation
Fig. 5 Estimated and predicted reliability function for new system design
0 0.5 1
0 25000 50000
Opertional time to failure
R el ia b il ity f un ctio n
Failure Class 1
Failure Class 2 Failure Class 3
0 0.5 1
0 25000 50000
Opertional time to failure
R el ia b il ity f un ctio n
Failure Class 1
Failure Class 2 Failure Class 3
Failure Class 1
Failure Class 2 Failure Class 3
Rel
iabi
lity
Operational Time (hrs) Early Design
Rel
iabi
lity
Operational Time (hrs) Early Design
Conc ern is
not a fa ult
Concern is
a fault
Fault
resul
ts in f
ailure
after
t hours
of op
eratio
n
Fault re
sults in failure
before t hours
of operation
S y st e m do es no t fa il with r e sp ec t to th is co nce rn befo re t h o u rs o f ope ra tio n S y st e m f ails by t h o u rs of op er ati o n p 1-p R(t) 1-R(t) 1-p p R(t) p (1-R(t))
Expert Judgement Expert Judgement
or Heritage Data
Concern Probability of not failing before time t (i.e. all events except failing before t)
1
2
( )
(
)
(
( )
)
(
( )
)
(
( )
)
n
i i 1 1 2 2 n n
i 1
1 F t p 1 F t p 1 F t p ... 1 F t p
= − = − × − × × −
∏
n( )
1 11 F t p−
( )
2 2
1−F t p
( )
n n
1 F t p−
( )
(
)
1 1 1
R t p 1 p
= + −
( )
(
)
2 2 2
R t p 1 p
= + −
( )
(
)
n n n
R t p 1 p
= + −
Concern Probability of not failing before time t (i.e. all events except failing before t) Concern Probability of not failing before time t
(i.e. all events except failing before t)
1
2
( )
(
)
(
( )
)
(
( )
)
(
( )
)
n
i i 1 1 2 2 n n
i 1
1 F t p 1 F t p 1 F t p ... 1 F t p
=
− = − × − × × −
∏
n(
( )
)
(
( )
)
(
( )
)
(
( )
)
i i 1 1 2 2 n n
i 1
1 F t p 1 F t p 1 F t p ... 1 F t p
= − = − × − × × −
∏
n( )
1 11 F t p−
( )
2 2
1−F t p
( )
n n
1 F t p−
( )
(
)
1 1 1
R t p 1 p
= + −
( )
(
)
2 2 2
R t p 1 p
= + −
( )
(
)
n n n
R t p 1 p
Fig. 6 Extended model logic to include effectiveness of activities in exposing faults
3.5 Supporting reliability planning During
development, different reliability activities, such as test and analysis, can be conducted to learn about the state of the system and understand what concerns may or may not be faults. However such activities will be of different durations, vary in cost and efficacy. Hence there is a need to be able to select a cost-effective portfolio of activities.
The proposed model can be extended to help us assess the value of information from such activities prior to their implementation and so inform such planning decisions. Figure 6 shows the extended model reasoning to support an assessment of the effectiveness of development activities in exposing faults.
This extended model can be formulated as a binary integer programming problem and used to select those activities that will minimise cost subject to the reliability requirements. This can be expressed formally as:
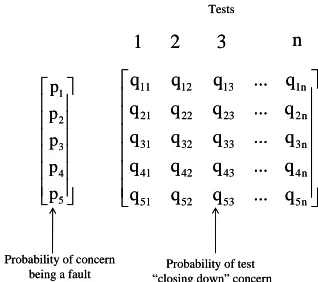
This analysis will require additional data about the about the resources required to conduct the activities (e.g. cost or time) and the engineering probability assessments of the likely efficacy of the activities. Such data may be conceptualised in the form shown in Figure 7 where we have a vector of probabilities with each element representing the engineering judgement about the likelihood of a given concern being a fault (pi) and a
matrix whose elements represent the probabilities (qij)
of each test activity (j) being able to expose a particular fault (i)
Fig. 7 Structure of elicited probabilities of concerns and probabilities of each test exposing a given fault conditional on existence of that fault
3.6 Updating estimates through development Two
possible ways of updating reliability estimates as information becomes available through development are, firstly, the re-elicitation of the probability assessments of concerns from engineers and, secondly, Bayesian updating. The former requires the elicitation process to be conducted again so that engineering experts can re-assess their probabilities of concerns in the light of the new evidence from the results of test and analysis. Taking these new assessments as input, the model can be re-run to generate updated estimates.
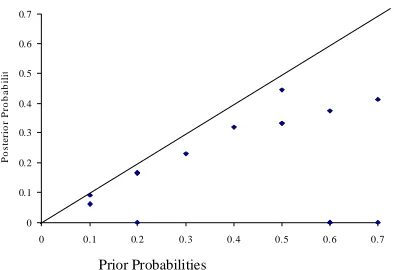
An alternative is to use Bayesian updating. Again a probability tree representation illustrates the principles of Bayesian updating as shown in Figure 8 where we note the prior probabilities (as a function of q) associated with the exposure, or otherwise, of faults on test, conditional upon whether that fault exists or not (which are denoted by p or 1-p respectively). Using Bayes Theorem we can find the chance that a fault exists giving that nothing is exposed on test as follows:
[image:5.595.48.283.77.212.2]The outcomes of test and analysis will be dichotomous because the fault will have been exposed or not and can be used to obtain the posterior probabilities. For example, Figure 9 shows a plot of the posterior against prior probabilities for multiple tests.
Fig. 8 Probability tree showing chance of test exposing fault conditional on existence of fault
( )
( )
k
j j
j 1
Target ~
j
j
min Total Cost C
subject to:
R t '; R t '
where:
C Cost of activity j
1, activity j is to be performed 0,activity j is not to be performed
δ
δ
δ
= =
≥
= ⎧ = ⎨ ⎩
∑
(
)
(
)
(
)
pq pq
P Fault exists nothing exposed
pq 1 p 1 p 1 q
= =
+ − − −
Conc ern is
not a fa ult
Conc ern is
a fault
Fault resul
ts in f ailure
after
t hours o f oper
ation
Activity exposes nothing
Item does not fail in operation due to concern
Act ivity
exp oses
noth ing
Activi ty e
xpos es fault
Item does not fail in operation due to concern
Fault results i
n failure befo re t hours
of operation
Conc ern is
not a fa ult
Conc ern is
a fault
Fault resul
ts in f ailure
after
t hours o f oper
ation
Activity exposes nothing
Item does not fail in operation due to concern
Act ivity
exp oses
noth ing
Activi ty e
xpos es fault
Item does not fail in operation due to concern
Fault results i
n failure befo re t hours
of operation
11 12 13 1n
21 22 23 2n
31 32 33 3n
41 42 43 4n
51 52 53 5n
q q q ... q
q q q ... q
q q q ... q
q q q ... q
q q q ... q
⎡ ⎤
⎢ ⎥
⎢ ⎥
⎢ ⎥
⎢ ⎥
⎢ ⎥
⎢ ⎥
⎣ ⎦
Tests
1 2 3 n
Probability of test “closing down” concern 1
2
3
4
5
p p p p p
⎡ ⎤ ⎢ ⎥ ⎢ ⎥ ⎢ ⎥ ⎢ ⎥ ⎢ ⎥ ⎢ ⎥ ⎣ ⎦
Probability of concern being a fault
11 12 13 1n
21 22 23 2n
31 32 33 3n
41 42 43 4n
51 52 53 5n
q q q ... q
q q q ... q
q q q ... q
q q q ... q
q q q ... q
⎡ ⎤
⎢ ⎥
⎢ ⎥
⎢ ⎥
⎢ ⎥
⎢ ⎥
⎢ ⎥
⎣ ⎦
Tests
1 2 3 n
Probability of test “closing down” concern 1
2
3
4
5
p p p p p
⎡ ⎤ ⎢ ⎥ ⎢ ⎥ ⎢ ⎥ ⎢ ⎥ ⎢ ⎥ ⎢ ⎥ ⎣ ⎦
Probability of concern being a fault
Nothing exposed on test
Fault exist
s
Fau
lt does
not
exists
Weakne
ss exposed on test
Nothin
g
expose
d on te
st
p
1-p
q 1-q
p q×
( )
p× −1 q
(1 p− × = −) 1 1 p Nothing exposed
on test
Fault exist
s
Fau
lt does
not
exists
Weakne
ss exposed on test
Nothin
g
expose
d on te
st
p
1-p
q 1-q
p q×
( )
p× −1 q
[image:5.595.321.512.618.729.2].
Fig. 9 Comparison of prior and posterior probability estimates from Bayesian updating
4. Summary and Conclusions
This article has discussed why it is important to ensure reliability is considered during product design and examined how we might use a stochastic model to support insights into reliability performance and so inform design and programme management decisions. The specific stochastic model for reliability growth explained has been structured based on our theoretical knowledge of reliability growth modelling and our practical experience of reliability analysis in the design of aerospace systems. Based on our evaluation of the application of the model in several cases [14], we believe the strengths of the approach proposed are: to explicate reliability statistics with engineering concerns; to use heritage operational data to minimise cognitive burden on engineering experts; and to reflect the real operating stresses. However, the modelling approach proposed also has limitations. These include: the model as implemented represents a first order approximation only; the elicitation of engineering concerns from engineers is non-trivial that is resource and cognitively intensive; and we focus only on reliability rather than availability. Further research will address these limitations.
References
[1] Kim, S.H., Cohen, M.S. and Netessine, S.
“Performance Contracting in After-Sales Service Supply Chains”, Management Science, (2007), Vol. 53, pp 1843 - 1858.
[2] Murthy, D.N.P. and Blischke, W.R. “Warranty Management and Product Manufacture”, Springer-Verlag, (2006).
[3] Shisko, R. amd Chamberlain R., “NASA Systems Engineering Handbook”, (1995).
[4] International Electrotechnical Vocabulary, IEC 60050-191.
[5] Meeker, W. and Escobar, L.A., “Statistical Methods for Reliability Data”, Wiley, (1998).
[6] Andrews, J.D. and Moss, T.R., “Reliability and Risk Assessment”, PE Publishing, (2002).
[7] Murthy, D.N.P, Rausand, M. and Osteras, T., “Product Reliability: Specification and Performance”, Springer, (2008).
[8] Bedford, T., Quigley, J. and Walls, L., “Expert Elicitation for Reliable System Design (with Discussion)”, Statistical Science, (2007), Vol 42, pp. 428-462.
[9] den Ouden, E., Yuan, L, Sonnemans, P.J.M. and Brombacher,. A.C., “Quality and Reliability Problems from a Consumer’s Perspective: an Increasing Problem Overlooked by Businesses”, Quality and Reliability Engineering International, (2006) Vol. 22, pp. 831-838.
[10] Fragola, J., “Reliability and Risk Database Development: an Historical Perspective”, Reliability Engineering and System Safety, (1996), Vol 51, No. 2, pp. 125-136.
[11] Birolini, A., “Reliability Engineering: Theory and Practice”, Springer, (2007).
[12] Rausand, M. and Oien, K, “The Basic Concepts of Failure Analysis”, Reliability Engineering and System Safety, (1996), Vol. 53, No. 1, pp. 73-83. [13] Walls, L. and Quigley, J., “Building Prior
Distributions to Support Bayesian Reliability Growth Modelling using Expert Judgement”, Reliability Engineering and System Safety, (2001), Vol. 74, No.2, pp. 117-128.
[14] Walls, L. Quigley, J. and Marshall, J., “Modeling to Support Reliability Enhancement during Product Development with Applications in the UK Aerospace Industry”, IEEE Transactions on Engineering Management, (2006), Vol. 53, No. 2, pp. 263-274.
0 0.1 0.2 0.3 0.4 0.5 0.6 0.7
0 0.1 0.2 0.3 0.4 0.5 0.6 0.7
P rior P robabilities
P
o
s
te
rio
r P
ro
b
a
b
ili
t
Prior Probabilities
0 0.1 0.2 0.3 0.4 0.5 0.6 0.7
0 0.1 0.2 0.3 0.4 0.5 0.6 0.7
P rior P robabilities
P
o
s
te
rio
r P
ro
b
a
b
ili
t