City, University of London Institutional Repository
Citation
: Jones, Sara (1993). Three-Dimensional Interactive Connection Diagrams for
Knowledge Engineering. (Unpublished Doctoral thesis, City, University of London)This is the submitted version of the paper.
This version of the publication may differ from the final published
version.
Permanent repository link:
http://openaccess.city.ac.uk/20156/Link to published version
:
Copyright and reuse:
City Research Online aims to make research
outputs of City, University of London available to a wider audience.
Copyright and Moral Rights remain with the author(s) and/or copyright
holders. URLs from City Research Online may be freely distributed and
linked to.
Three-Dimensional Interactive Connection
Diagrams
for
Knowledge Engineering
Sara Jones
Department of Computer Science City University
February 1993
Contents
Acknowledgements xvii
Declaration
Abstract
I Introduction
1 Introduction
1.1 Overview
.
. . . .
.
. . .
.
.
.
. . . .
.
. . .
.
1.2 Definitions ... . . .
. . .
.
.
1.3 Context . . .
...
·
.
.
.
.
1.4 Objectives . . .
· ....
1.5 Thesis Outline
· . . .
.
. . .
.
2 Graphical Support for Human-Computer Interaction
...
2.1 Introduction . . . .
.
.
. . .
2.2 Evolution of the Human-Computer Interface • • • • • • • . • • • • . . .
2.3 Arguments for the Use of Graphical Representations • • • . • • . . . .
2.3.1 Information Bandwidth • . • • . • . . . • • . . .
2.3.2 Support for Mental Representations •..
. . .
.
. .
.
.
. . . .
2.3.3Other Claims . . . .
.
. . . .
.
. . .
2.4 Graphical User Interfaces: Some Examples. • . • . . . . • . . • . . . •2.5
2.4.1 Virtual Reality . . . .
2.4.2 Pictures, Models and Metaphors • . • . . • . • • • • . . . .
2.4.3 Representing the Abstract • • • • • • • . • • • • . . . • . .
Conclusions
.
. . .
. .
.
. . . .
.
. . .
.
.
.
.
.
.
. .
.
xix
xxi
1
3
3
4
4
9
10
13
13
13
14
14
15
15
16
16
11
20
2.6 Summary . . . .
3 Graphical Support for Knowledge Engineering
3.1 Introduction . . . .
22
25
25
3.2 Knowledge Based System Human-Computer Interface Requirements . . . 25
3.2.1 The End User. . . .. 26
3.2.2 The Domain Expert . . . • . . . .. 26
3.2.3 The Knowledge Engineer . • • . . . . • . . . . • 26
3.3 Arguments for the Use of Graphical Representations . . 27
3.4 Tools Providing Graphical Support for Knowledge Engineering .
3.4.1
3.4.2
Knowledge Acquisition and Validation . . . .
Design and Development • . • . • • . . • . . . .
3.4.3 Debugging and Verification . . . .
3.5 Paradigms for Graphical Knowledge Representation
3.5.1 Graphical Vocabulary . . • . . .
3.5.2 Animation . . . .
3.5.3 Spatial Coding . . • . .
3.6 Conclusions
3.7 Summary .
II
Depthin
3-d leDs
4 Representation of Depth in 3-d ICDs
4.1 Introduction . . • . . . • • • . • • .
4.2 Cues Used in Human Depth Perception
4.2.1 Monocular Cues (No Movement) . • . . .
4.2.2 Monocular Cues (Movement) • • • • • • . . .
4.2.3 Binocular Cues . . . .
4.3 Techniques for the Display of 3-d Computer Generated Images •
4.3.1 Real and Virtual 3-d Images . . . .
4.3.2 2-d Images with lliusory Depth • • . • . . • • • .
4.4 Choice of Techniques for the Display of 3-d leDs . . . .
4.4.1 Requirements for Realism • • • • . • • . . .
4.4.2 Hardware Constraints . • • • • • • . . . • • . . . • . •
ii
·
....
28 28 29 31 32 32 33 35 37 37 39 41 41· . . .. 41
42
43
· . . .. 43
44
44
44
· . . .. 46
46
4.4.3 Depth Cues in JIN, JINGLE and ICDEDIT . . . .. H
4.5 Summary . . . .. 48
5 Perception of Depth in 3-d ICDs: A Pilot Study
49 5.1 Introduction . . . . . . . . . 495.1.1 Hypotheses . . .
...
· . . . . 505.1.2 Choice of Task .
.
.
. . .
.
. .
. .
.
.
.
. . .
.
· . . .. 515.1.3 Choice of Stimuli. . . .. 51
5.2 Method . . . . . . .. 51
5.2.1 Design . . . , . . . . 51
5.2.2 A p p a r a t u s . . . 52
5.2.3 5.2.4 Procedure • . . . Subjects . . .
· ... .
· . . .. 52· • • •• 54 5.3 R e s u l t s . . . 54
5.3.1 Response Time Analysis. • • . • . • . . . .. 54
5.3.2 Analysis of Error Rates . . . . • . . • . . . • • . . • . . . . . . .. 54
5.3.3 Analysis of Questionnaire Data. . . .. 55
5.3.4 Further Analysis of Response Times . . . .. 58
5.4 Conclusions . . . .. 58
5.5 Discussion . . . . • I- • • • 59 5.5.1 Support for Experimental Hypotheses
· . . .
.
.
.
. .
• . • •• 595.5.2 Implications for Further Experiments · . . . . . 60
5.6 Summary . . . .. . . .. 60
6 Perception of Depth in 3-d ICDs: Further Experiments
61
6.1 I n t r o d u c t i o n . . . 616.1.1 6.1.2 Hypotheses
.
.
.
.
.
. .
. .
.
. .
.
.
. . .
.
. . .
. .
.
.
.
Choice of Task . . . .
. . . .. 62. . . .. 63
6.1.3 Choice of Stimuli • . . . . • • . . . • . • . . . •. 63
6.2 Method . . . . . . .. 64
6.2.1 D e s i g n . . . 64
6.2.2 A p p a r a t u s . . . 64
6.2.3 P r o c e d u r e . . . 66
6.2.4 S u b j e c t s . . . 69
6.3 R e s u l t s . . . 69
6.3.1 Methods of Analysis . . . 69
6.3.2 Effect of Angle of Motion . . . 70
6.3.3 Effect of Period of Motion . . . .. 73
6.3.4 Effect of Stimulus Type . . . .. 77
6.3.5 General Comments . . . 78
6.3.6 Analysis of Difficult Pairs . . . • . . . .. 81
6.4 C o n c l u s i o n s . . . 84
6.5 D i s c u s s i o n . . . 85
6.5.1 Comments on the Experimental Design . . . 85
6.5.2 Implications for Future Implementations . . • . • • • . . • . . . •. 86
6.5.3 Implications for the Layout of 3-d ICDs . . . .. 86
6.5.4 Implications for Phase Two • • • . . • • • • • . • . • • . • . . . •. 87
6.6 Summary . . . . . . 88
III Utility and Usability
of
3-d leDS
89
7 Investigation of Utility and Usability 91 7.1 Introduction . . .. .
.
. . . .
.
.
. . .
. .
.
.
.
.
.
.
. . . • . •. 917.2 Estimation of Utility . . . • . • . . • . • . . . • . .. 92
7.2.1 Definitions of Utility. . . • . • . • . • • . . . •. 92
7.2.2 Approaches to the Estimation of Utility . • • . • . . • . . . • . •. 92
7.3 Evaluation of Usability. . • . . . . • . . . • • . . . . • . . . •. 93
7.3.1 Definitions of Usability. . . .. 93
7.3.2 Approaches to the Evaluation of Usability . . . • . . . •. 94
7.4 Case Study Design . • . . . • . . • . . . • . . . .. 97
7.4.1 Ecological Validity . . . . • • . • . . . • . • • • • . . . • . 100
7.4.2 Procedure . . . 101
7.4.3 Analysis of the Results. . . • . . . • . • • • • . • . • • . • . . • . . 104
7.5 Summary . . . 104
8 Utility of 3-d leDs for Knowledge Engineering
8.1 Introduction.. . . . . .
8.2 User Skills and Experience . .
8.2.1 Perceptual Capabilities . . . .
8.2.2 Visualisation Skills . . . . . . .
8.2.3 Experience with Graphical Representations for Knowledge
Engi-neering . . . .
113 113 113 114 114 115
8.2.4 Experience with Knowledge-Based Systems . . . 115
8.3 Task Factors . . . .
8.3.1 Knowledge Acquisition • . . • .
8.3.2 Knowledge Validation • • . . .
8.3.3
8.3.4
Design . . . .
Development ..
8.3.5 Debugging . • . •
8.3.6 Verification .
8.3.7 Maintenance
8.4 Environmental Factors.
· ... .
·
... .
·
... .
· ... .
· .
. . . .
.
. . . .
·
... .
·
... .
·
.
.
.
. .
. . .
116 118 119 120 121 121 122 122 1248.4.1 Organisational Environment . . . • . . . . • . . . 124
8.4.2' Physical Environment . . .
8.4.3 Computing Environment . • . .
8.5 System Characteristics . . . .
8.5.1 Knowledge Representation Style
. .
.
.
. . .
.
. .
.
. .
.
.
125125
126
128
8.5.2 System Size . . . 129
8.5.3 System Complexity. • . • . • • • • • • • • • • • • • • • • . • . . . . 130
8.6 Recommendations for Further Development .
· . . .
.
. .
.
.
. .
8.7
Summary . . . .
...
9 Usability of Depth-Related Features of ICDEDIT
9.1 Introduction . . . .
· . . .
.
. .
. .
.
.
.
. .
9.2 Effectiveness of Support for Perceiving Depth
.
. . .
.
.
.
. .
.
. . .
9.2.1 Hiding ••.. .
.
. . .
9.2.2 Perspective
9.2.3 Rocking Motion
9.2.4
Colour . . . .
9.2.5 Summary and Recommendations . . . .
9.3 Effectiveness of Support for Manipulating 3-d leDs ..
9.3.1 Strategies
9.3.2 Problems
9.3.3 Summary and Recommendations
136
137
137
138
138
9.4 Effectiveness of Support for Positioning Elements in 3-d leDs . . . 139
9.5
9.4.1
9.4.2
Strategies . . . . . . • .
Summary and Recommendations . . .
User Satisfaction . . . .
9.5.1 Summary and Recommendations . . .
139
140
140
141
9.6 Summary . . . 0 • 0 • 141
IV Conclusion
143
10 Further Investigation of the Utility of 3-d ICDs for Knowledge
Struc-ture Representation
145
10.1 Introduction 0 0 • • 0 0 0 • • 0 • • • 0 • • 0 • • 0 • • • • • • • • • • • • • • 0 145
10.2 Experimental Comparison of 3-d, 2-d and Textual Representations of Knowl-edge Structures . 0 • • 0 0 0 • 0 • 0 0 • 0 0 0 • • • • 0 • 0 • 0 • 0 0 146
10.2.1 Method
10.2.2 Results
10.3 Discussion . . 0
. .
. .
. . . .
. . .
. . .
.
. .
.
. . .
.
. .
. . .
.
. . . .
,.
.
.
.
. . .
.
.
. . . .
.
. . .
. .
. . .
. . .
.
147 155 15610.3.1 Problems with the Use of Controlled Experiments in Design 0 • 0 • 156
10.3.2 An Alternative, Approach to Assessing Utility 0 •
10.4
Summary . . . .
. . .
.
.
.
.
11 Formal Specification of 3-d ICD Languages for Knowledge Structure
159161
Representation
163
11.1 Introduction. 0 • 0 0 0 • 0 0 • •
11.2 Definition of Visual Languages
11.3 Specification of 3-d leD Languages Supported by ICDEDIT 0
11.3.1 Abstract Graphs . . 0 • • • • • • • • • • • • • 0 0 • 0 0
163
164
165
165
11.3.2 Graphical Primitives 0 0 0 0 0 0 0 • 0 0 0 0 • • 0 • 0 • • 0 0 0 0 • 0 0 166
11.3.3 Vocabularies
11.3.4 Diagrams 0 •
vi
167
11.3.5 Visual Languages
11.3.6 Primitive Operations
11.4 Specification of a Particular 3-d ICD Language .
11.4.1 Knowledge- Based System Profile
11.4.2 Representation Requirements . .
11.4.3 Representation Specification . . .
11.5 Discussion . .
11.6 Summary
12
Discussion
12.1 Overview
12.2 Evaluation . .
...
169 169 li3 114 174 115 179 181 183 183 18412.2.1 Investigation of Depth Cuing in 3-d ICDs 186
12.2.2 Estimation of the Utility of 3-d ICDs for Knowledge Engineering . 187
12.2.3 Evaluation of the Usability of Features of ICDEDIT • . . . • • 189
12.2.4 Formal Specification of 3-d ICD Languages . . . . 190
12.3 Further Development of Tools • . . . • • . . . 191
12.3.1 Presentation of 3-d ICDs . . .
12.3.2 Layout of 3-d ICDs . • . . . • .
...
,...
12.3.3 Further Functionality
. . .
.
. . .
. .
. .
.
. . .
12.4 Conclusions . .12.5 Summary . . .
Appendices
A Pilot Experiment: Materials and Results
A.I Stimuli . . . .
A.2 Protocol • . . •
A.3 Questionnaire
A.4 Results. . • .
B Further Experiments: Materials and Results
. . .
.
. . .
...
.
. .
.
.
.
B.I Stimuli . . . .
.
.
. . . .
. . .
. . .
B.2 Protocol . . . .
.
. . .
.
. . .
.
. .
.
. . .
B.3 Questionnaire
B.4 Results . . . .
B.4.1 Effect of Angle of Motion
B.4.2 Effect of Period of Motion . . . .
B.4.3 Effect of Stimulus Type
C ICDEDIT: A Brief Description
C.1 Introduction . . . . • . . .
C.2 The ICDEDIT 23/4-d Diagram Paradigm . . .
C.3 The ICDEDIT User Action Paradigm
D Case Studies: Materials
D.1 Stage 1 . . . .
D.1.1 Interview Prompt Sheet . • • . .
D.2 Stage 2 . . . .
0.3
D.2.1 Interview Prompt Sheet
· .
.
. . .
.
. .
.
.
. .
.
Stage 3 . . . . . . .
D.3.1 Interview Prompt Sheet
0.3.2 Generic Task Taxonomy
D.3.3 Graphical Representations • . . .
227 228 228 235 243 259 259 261 262 215 276 276 281 281 283 283 292
· . . . .
295E Further Experiments for Investigating the Utility of 3-d ICDs for
Knowl-edge Structure Representation 309
E.1 Effects of User Characteristics •
·
.... . .
·
. .
.
.
310 E.1.1 Visualisation Skills • . .·
....
. . .
·
.
. . .
310E.1.2 Experience with Graphical Representations
· . . .
.
310E.1.3 Experience with Knowledge-Based Systems
· . . . .
310E.2 Effects of Environmental Factors
.
. .
.
. .
.
.
. . .
. .
· . .
.
.
311 E.2.1 Knowledge Representation Formalism . . . • . • . . • . . 311E.3 Effects of System Characteristics . . . • . • . . . • • • • . . . 311
E.3.1 System Size . . . .
E.3.2 Number of Different Relations • . • . . . •
E.3.3 Number of Relationships per Entity
viii
311
312
F Introduction to the Z Notation
F.l Glossary of Symbols . . . .
...
,...
G Formal Specifications of 3-d ICD Representations
G.l Introduction.
·
...
.
...
G.2 Case Study 1
· ...
.
...
G.2.1 Knowledge-Based System Profile
G.2.2 Representation Requirements
·
G.2.3 Representation Specification ..G.3 Case Study 3
·
...
·
...
G.3.1 Knowledge-Based System Profile
·
...
G.3.2 Representation Requirements
· .
·
...
G.3.3 Representation Specification . .
·
...
G.4 Case Study 4
·
...
...
GA.1 Knowledge-Based System Profile
...
GA.2 Representation Requirements
·
...
G.4.3 Representation Specification . .
...
G.5 Case Study 5
·
. .
.
.
.
. .
. .
.
. . . .
· . . .
.
313
· . 315
317
· .
317 · . ·318318 318 319 325 325 325 326 331 331 331 332 335
G.5.1 Knowledge-Based System Profile
·
.
. .
.
. .
.
.
.
.
335 G.5.2 Representation Requirements·
G.5.3 Representation Specification .•
G.6 Case Study 6
·
.
. . . .
.
. .
. .
.
.
.
.
....
·
...
G.6.1 Knowledge-Based System Profile . • . . .G.6.2 Representation Requirements • • . • . . . • . .
G.6.3 Representation Specification •.
. .
.
. . .
.
. . .
.
.
.
. .
.
.
.
List of Figures
1.1 Example of Graphical Knowledge Representation • . . . . • . . . . . . . .
1.2 3-d ICD Drawn Using JIN . . . .
1.3 3-d ICD Drawn Using JINGLE . . . • . . • . . .
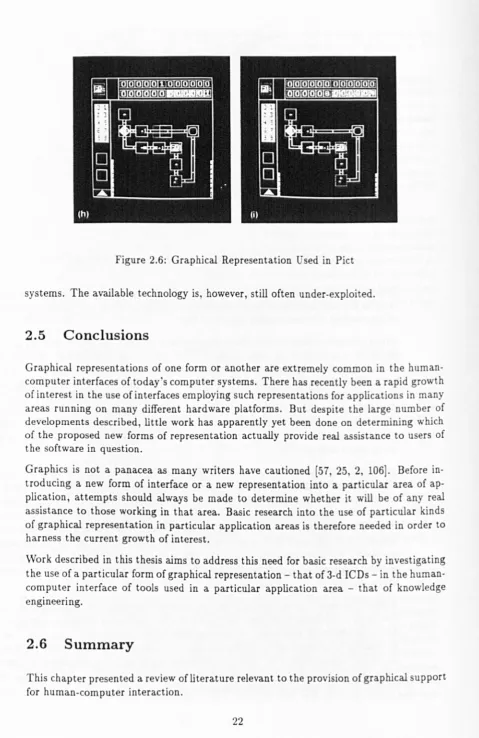
1.4 3-d ICD Drawn Using ICDEDIT . . . .
...
2.1 A Virtual Reality Interface . • . . .
...
5
6
6
7
17
2.2 Graphical Representation Used in a Tool for CAD • • • • . . . • 18
2.3 Graphical Representation Used in Steamer. . . • . • • . . . . • . • .• 19
2.4 Graphical Representation Used in Molecular Modelling. . . .. 19
2.5 3-Dimensional Representation of Numerical Data . . . . • . . . . . 21
2.6 Graphical Representation Used in Pict . • . . . . . 22
3.1 Concept Maps in GIS . . . • . . . . 30
3.2 LOOPS class browser . . . 32
3.3 KEE Class Hierarchy.. . • • . . . . • . . . • • . • . . • . • . . . . 33
3.4 Iconic Representations Used in KEE . . . . • . . . • • . . . • . . . . • •. 34
3.5 Iconic Representations Used in TMV . . . • • . . . • • . • . . . .• 34
3.6 2-Dimensional Representation Used in TRI . . . . . . . . 35
3.7 3-Dimensional Representation Suggested for Use in the Casnet System.. 36
4.1 Rocking Motion in JIN . . . .. 48
5.1 One of the Stimuli Used in the Pilot Study • . • • • . . • • • • . . . 53
5.2 Plot of Response Times in the Pilot Study. . . • . . . . . 55
5.3 Plot of Ease Scores in the Pilot Study • • . • • • . . . • . . • . . . 56
6.1 One of the Type
I
Stimuli (Layered) . • . . . . • . • • • • • . • . . . . . . 676.3 One of the Type III Stimuli (Random)
6.4 One of the Type IV Stimuli (Regular)
6.5 Graphs showing the effects of angle of motion on total numbers of errors 68
68
and on median ratings of ease and confidence for all subjects . . . 71 6.6 Graphs showing the effects of period of motion on mean logged response
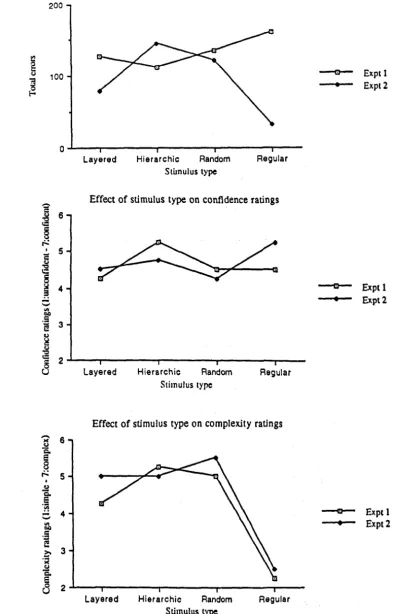
times, total numbers of errors and median ratings of ease for all subjects. 74 6.7 Graphs showing the effects of stimulus type on total numbers of errors and
median ratings of confidence and complexity for all subjects. . . .. 79 6.8 Graphs showing the relationship of ratings of perceived complexity to total
numbers of errors and ratings of confidence for all subjects. . . . 80 6.9 Examples of Masking . . . .
6.10 Examples of Perspective Cues from Links ..
83
83
7.1 Training Diagram . . . • . . . • • . . 105
7.2 Key Describing the Visual Language Used in Case Study 2 . 107
7.3 Dummy 3-d ICD Representation Used in Case Study 2 • 109
7.4 Actual 3-d ICD Representation Used in Case Study 2 .
10.1 Summary of Experiment Design . . . .
. . .
.
.
.
.
10.2 Examples of 3-d Stimuli
10.3 Examples of 2-d Stimuli
.
. .
. . .
.
.
.
.
.
. . .
.
. .
. .
. . .
. .
. . .
.
. . .
. . .
.
.
lOA Examples of Textual Stimuli . • . . .
10.5 Examples of Questions . . .
10.6 Predicted Results • . . . • . . .
10.7 Error Rate Tables . . . •
12.1 Chart of the Parse Space Produced by Lucy . . . .
. .
.
. .
.
.
.
. .
.
. . .
.
. . .
. .
12.2 Cone Tree Used in the Information Visualiser
.
. . . .
.
. .
.
. .
. . .
A.1 Pilot Experiment: Stimulus 1
A.2 Pilot Experiment: Stimulus 2
A.3 Pilot Experiment: Stimulus 3
A.4 Pilot Experiment: Stimulus 4
A.5 Pilot Experiment: Stimulus 5
B.1 Type I Stimuli: Layered (1)
B.2 Type I Stimuli: Layered (2)
B.3 Type I Stimuli: Layered (3)
B.4 Type I Stimuli: Layered (4)
B.5 Type II Stimuli: Hierarchic (1) B.6 Type II Stimuli: Hierarchic (2)
212
213
214
215
B.7 Type II Stimuli: Hierarchic (3) . . . 216
B.8 Type II Stimuli: Hierarchic (4) . . . 217
B.9 Type III Stimuli: Random (1) . . . 218
B.10 Type III Stimuli: Random (2) . . . • . . . 219
B.ll Type III Stimuli: Random (3) . . . 220
B.12 Type III Stimuli: Random (4) • . . • . • . . . • . . . 221
B.13 Type IV Stimuli: Regular (1) B.l4 Type IV Stimuli: Regular (2) B.l5 Type IV Stimuli: Regular (3) B.16 Type IV Stimuli: Regular (4)
·
. .
. . . .
. .
. . . .
.
. . .
·
.
. . .
.
. . .
.
. . .
. .
. .
.
·
. . .
.
. . . .
.
. .
.
.
. . .
.
.
.
· . . .
.
. . . .
.
.
. .
. . .
.
222 223 224 225 C.l A Small ICDEDIT Diagram . • . . . . • . . . 260C.2 ICDEDIT in Use . . . • . . . . • . . . • . . . • . . . 265
C.3 Node Selected. . . 267
C.4 Link Selected . . . , . . . 267
C.5 Selected Node Border Edit Menu Raised . . . 269
C.6 Selected Link Arrow Head Edit Menu Raised . . . 269
C.7 View Control Panel Raised . . . • . . . . 271
C.8 Colour Edit Panel Raised .. . . • . . . 271
C.9 Frontal View of a 3-d ICD . . • . • . . • . . . . • . • . . . 273
C.lO Side View of the Same 3-d ICD . • • . . . 273
D.l ICDEDIT Vocabulary . . . • . . . • . . . • . . . • . . . 282
D.2 Key Describing the Visual Language Used in Case Study 1 • . . . • 297
D.3 Actual 3-d ICD Representation Used in Case Study 1 . . . • 297
D.4 Key Describing the Visual Language Used in Case Study 2 . . . 299
D.5 Actual 3-d ICD Representation Used in Case Study 2 . . • . . . • 299
D.6 Key Describing the Visual Language Used in Case Study 3 . . . 301
D.7 Actual 3-d ICD Representation Used in Case Study 3 . . . 301
D.S Key Describing the Visual Language Used in Case Study 4 . . . . • . • . 303
D.9 Actual 3-d ICD Representation Used in Case Study 4 . . . .
·
..
.
.
303D.lO Key Describing the Visual Language Used in Case Study 5 . 305
D.ll Actual 3-d ICD Representation Used in Case Study 5 . . . . 305
D.l2 Key Describing the Visual Language Used in Case Study 6 . . .
·
.
.
. .
307 D.13 Actual 3-d ICD Representation Used in Case Study 6 . . . .· ....
307List of Tables
6.1 Summary of the Effects of Angle of Motion .
6.2 Summary of the Effects of Period of Motion .
6.3 Summary of the Effects of Stimulus Type . . . .
70
75
78
6.4 N umbers of Pairs Causing Particular Numbers of Errors . . . .. 82
7.1 Details of Case Studies 1 • 3 • . . . • • •
7.2 Details of Case Studies 4 • 6 . . . .
8.1 Effects of User Skills and Experience on Utility of 3-d ICDs for Knowledge 98
99
Engineering . . . • . . . 117
8.2 Utility of 3-d ICDs for Various Knowledge Engineering Tasks . . . 123
8.3 Effects of Environmental Factors on Utility of 3-d ICDs for Knowledge
Engineering . . . .. 127
8.4 Utility of 3-d ICDs in the Representation of Systems of Different Kinds . 131
B.1 Mean Logged Response Times by Angle of Motion: Experiment 1 . . . 230
B.2 Total Errors by Angle of Motion: Experiment 1 . . . • . . 231
B.3 Median Ease Ratings by Angle of Motion: Experiment 1 . . . 232
B.4 Median Confidence Ratings by Angle of Motion: Experiment 1 . • . . . . 233
B.5 Median Comfort Ratings by Angle of Motion: Experiment 1 . . . • . . . . 234
B.6 Mean Logged Response Times by Period of Motion: Experiment 2 . . . . 237
B.7 Total Errors by Period of Motion: Experiment 2 . . . • . . . 238
B.8 Median Ease Ratings by Period of Motion: Experiment 2 . . . . 239
B.9 Median Confidence Ratings by Period of Motion: Experiment 2 . . . 240
B.IO Median Comfort Ratings by Period of Motion: Experiment 2 . . • . . • . 241
B.ll Mean Logged Response Times by Stimulus Type: Experiment 1 . . . 246
B.12 Mean Logged Response Times by Stimulus Type: Experiment 2 • . . • . . 247
B.14 Total Errors by Stimulus Type: Experiment 2 . . . .
B.15 Median Ease Ratings by Stimulus Type: Experiment 1 .
B.16 Median Ease Ratings by Stimulus Type: Experiment 2 .
B.17 Median Confidence Ratings by Stimulus Type: Experiment 1
B.18 Median Confidence Ratings by Stimulus Type: Experiment 2
B.19 Median Comfort Ratings by Stimulus Type: Experiment 1 ..
B.20 Median Comfort Ratings by Stimulus Type: Experiment 2 .•
B.2! Median Complexity Ratings by Stimulus Type: Experiment 1 B.22 Median Complexity Ratings by Stimulus Type: Experiment 2
xvi
2-!9
250
251
252
253
254
255
256
Acknow ledgements
I hereby gratefully acknowledge the funding from the Science and Engineering Research Council and British Telecommunications which supported the bulk of this work.
Particular thanks are also due to a number of individuals: to David Bolton for his enthusiastic reading of an earlier 'draft of this thesis; to Jun Cui for his work in developing the software used in the studies reported; to David Dodson who supervised the ICDEDIT project and the writing of an earlier draft of this thesis; to James Hampton for his advice regarding the design of some of the experiments; to Chris Marshall and Nigel Mitchem who helped me with many technical difficulties; to Alistair Sutcliffe for his guidance at various stages; to David Till for discussions regarding the work using Z; to Darren Van Laar for numerous helpful suggestions; and to Luke Whitaker for assistance with much of the statistical analysis. I am also grateful to those who acted as subjects in the studies reported below.
xviii
I
Declaration
I grant powers of discretion to the University Librarian to allow this thesis to be copied in whole or in part without further reference to me. This permission covers only single copies made for study purposes, subject to normal conditions of acknowledgement.
Abstract
This thesis describes research into human factors aspects of the use of 3-dimensional node and link diagrams, called Interactive Connection Diagrams (leDs), in the human-computer interface of tools for knowledge engineering. This research was carried out in two main stages: the first concentrated on perceptual aspects of 3-d ICDs, and the second on more general aspects of their use in realistic situations. A final section looked briefly at the possibility of formally specifying 3-d ICD representations.
The main aim of the first stage was to investigate whether users were able to make effective judgements about the relative depths of components in 3-d ICDs. Controlled experiments were carried out to determine the extent to which such judgements were supported by the use of a particular approach to creating the illusion of depth. The results of these experiments showed that users were able to make reasonably effective judgements about the relative depths of components in 3-d ICDs. 3-d ICDs produced using the approach of interest were therefore argued to be suitable for use in the second stage of the study.
In the second stage, case studies were used to investigate the utility in more realistic knowledge engineering situations of tools supporting 3-d ICDs, and the usability of depth-related features of a prototype tool which permits 3-d leDs to be viewed and edited. On the basis of the findings of these studies it is claimed that tools supporting 3-d ICDs will, in some situations, be more useful than those which employ only more conventional 2-d versions. It was found that depth-related features of the prototype tool were usable but should be improved upon in future implementations.
The third and final section of work involved a preliminary investigation into the formal specification of the 3-d ICD representations of the kind used in the second set of studies. A scheme for specifying the range of 3-d leO languages currently supported by the prototype tool was developed, and each of the particular 3-d ICD languages used in the case studies were specified.
Implications of the results of this work are discussed and a number of suggestions regard-ing directions for future work are made. The overall conclusion is that 3-d ICDs have considerable potential as a medium in which to represent knowledge structures for use in knowledge engineering.
Part I
Introduction
Chapter
1
Introduction
1.1
Overview
This thesis describes research into human factors aspects of the use of 3-dimensional node and link diagrams in the human-computer interface of tools for knowledge engineering. Such diagrams are here referred to as 3-dimensional Interactive Connection Diagrams, or 3-d ICDs [39]. A number of empirical studies were conducted in order to investigate the use of 3-d ICDs produced by tools embodying a particular approach to creating the illusion of depth. This approach is described in outline in section 1.3.
The first of the studies investigated perceptual aspects of 3-d ICDs. Three controlled experiments were used to investigate the effectiveness of the approach to creating the illu-sion of depth used in the tools of interest. On the basis of the results of these experiments it was concluded that:
• users are able to make reasonably effective judgements about the relative depths of components in 3-d ICDs
and that 3-d ICDs produced using this approach constituted a reasonable medium for use in further investigations into meaningful depth-based spatial coding in graphical representations of knowledge structures for use in knowledge engineering.
The use of 3-d ICDs in more realistic knowledge engineering situations was investigated in a second set of six case studies. These studies investigated the utility in knowledge engineering of interface technologies based on the use of 3-d ICDs, and the usability of depth-related features of a particular prototype tool which permits 3-d ICDs to be viewed and edited. On the basis of the findings of these studies it is claimed that:
• interface technologies based on the use of 3-d ICDs will, in some knowledge engi-neering situations, be more useful than those which employ only more conventional 2-d versions;
• depth-related features of the prototype tool are usable but may be improved in future implementations.
Finally, some work was done on investigating the possibilities of formalising specifications of the 3-d representations used in the second set of studies. As a result of this work, it is claimed that:
• 3-d leo representations of knowledge structures for use in knowledge engineering can be formally specified using the Z notation.
1.2 Definitions
Three-dimensional Interactive Connection Diagrams may be defined as follows [38].
A connection diagram (eO) is a diagram or graphical representation in which nodes are used to denote important concepts or entities and links may be used to represent any connections between them.
An interactive connection diagram (leO) is a connection diagram which supports inter-action of some kind: for example, human-computer interinter-action.
A 3-dimensional interactive connection diagram (3-d leO) is an leo whose nodes have their positions defined in terms of 3 co-ordinates. Figuratively speaking, a 3-d leo may therefore look more like a graphical representation of a structure in space than a drawing on a page.
1.3 Context
Two-dimensional node and link or connection diagrams are widely used in the human-computer interface. Three-dimensional versions are much less common, though interest has recently been growing and a number of researchers have alluded to the potential benefits of using 3-d rCDs [128, 52, 116].
Benefits cited for the use of 3-dimensionallayouts rather than 2-d include:
• greater freedom of layout and expression [128]
• greater visibility of information for a given size of screen or window [116]
• the availability of an extra dimension for spatial coding in representations of multi-dimensional information [52]
Work described in this thesis investigates the use of 3-d rCDs in the domain of knowledge-based systems: specifically, in the process of knowledge engineering. Knowledge engi-neering is the process of designing, developing, implementing and maintaining knowledge-based systems. Two-dimensional node and link diagrams are already widely used in pro-viding graphical representations of abstract components of systems or knowledge struc-tures for use by knowledge engineers (see chapter 3). They are, however, often inade-quate for the representation of the large, complicated and inherently multi-dimensional knowledge structures which lie at the heart of modern knowledge-based systems. It was therefore felt that the benefits of using 3-d rCDs (rather than 2-d) might be considerable in this field.
The work described in this thesis was carried out at the same time as other work at City University aimed at developing prototype tools to allow users to view and edit 3-d reDs. All of the tools 3-develope3-d at City have used the same approach to creating
the illusion of depth. This approach was intended for use in workstations with 2-d graphics hardware and is described in detail elsewhere [39, 31]. Briefly, it involves a
Figure 1.1: Example of Graphical Knowledge Representation
simplification of the 3-d display problem in which nodes (and links) are displayed using purely 2-d methods and are drawn in back-to-front order to create the effect of occlusion. A crude simulation of rocking motion is also employed with the aim of enhancing the illusion of depth. This produces what has been called a '23
kd'
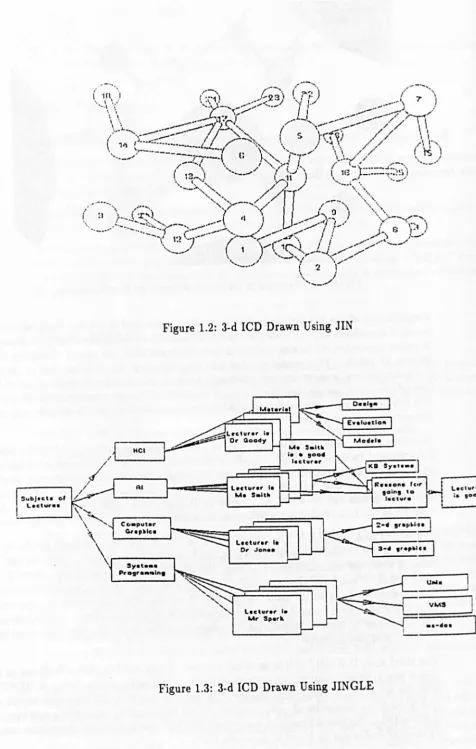
effect [36] in which three-dimensional arrangements of nodes and links can be rotated and transformed while individual nodes always face the front. The speed of display update achieved using this relatively simple approach was found to be acceptable though the process was not perceptually instantaneous.As stated above, each of the tools developed ran on a general purpose workstation with 2-d graphical hardware. JIN [31,39], the earliest tool, ran on a Whitechapel workstation with a monochrome monitor and displayed a view of a 3-d structure of spherical nodes and narrow cylindrical links specified in a pre-defined datafile. A precedent for the use of such diagrams can be found in a paper by Pauker et al. [105] (see figure 1.1). An
example of the kind of diagram which could be produced using JIN is shown in figure 1.2.
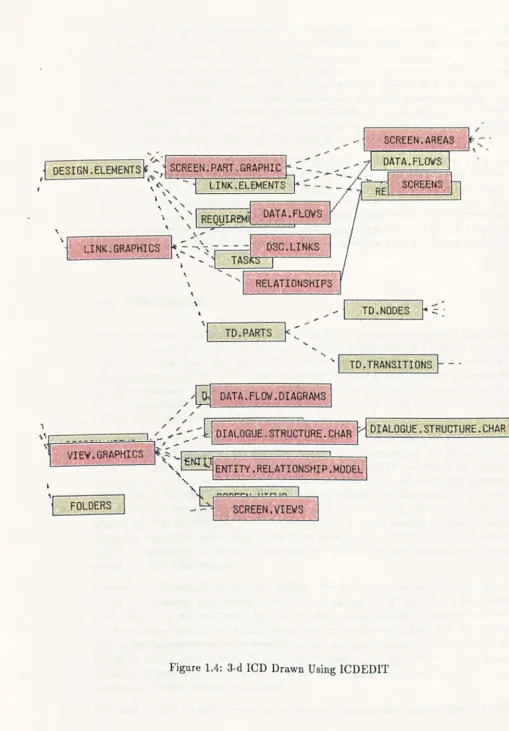
The second tool, JINGLE [31], ran on the same sort of workstation and again displayed a view of a 3-d node and link structure which had been previously defined. From the user's point of view, the main differences between JIN and JINGLE were as follows. Instead of using cylinders and spheres, diagrams in JINGLE were made up of single line links and flat rectangular nodes which could contain text. A number of the properties of nodes and links could be defined using menus, and components of JINGLE diagrams could be edited and positioned by direct manipulation. An example of the kind of diagram supported by JIN G LE is shown in figure 1.3.
[image:29.533.19.524.15.585.2]Sub)oc" of Lectur ••
Figure 1.2: 3-d ICD Drawn Using JIN
s".t ••• Pro.,. .... ln.
Lecturer I.
Dr Jon ••
llctur.,. Ie
Ur Sp.rt.
Figure 1.3: 3-d ICD Drawn Using JIN G LE
6
Leet",., .• ,ood
I
J
[image:30.559.39.516.18.768.2]As mentioned above, an empirical approach was adopted in carrying out most of the work described in this thesis. The nature of this work therefore refiects, to at least some extent, the nature of the tools available at the time it was conducted. At the time when the early work was carried out, only the first of the prototypes (JIN) had been completed and was available for use: JIN had only minimal interactive functionality and only perceptual aspects of the representations supported (which could be studied in the absence of such functionality) were considered at this stage. Later work used ICOEOIT, a more advanced prototype of a tool for manipulating 3-d ICOs, and could therefore investigate the use of representations of interest in more realistic situations.
Since most of the results reported were obtained by evaluating particular tools, care must be taken in extrapolating from these results to draw conclusions about the use of 3-d node and link diagrams in general. The relevance of some of the results may be limited to tools supporting the particular type of diagrams considered, or even to the particular tool and diagrams used in the investigation. Other results may, however, have important implications for a range of tools which might support the use of 3-d node and link diagrams in a wide range of situations. This issue will be further discussed in chapter 12.
1.4 Objectives
The overall aim of the work described in this thesis was to investigate human factors aspects of the use of 3-d ICDs in the human-computer interface of a tool for knowledge engineering. This work was carried out in two main phases, the first concentrating on perceptual aspects of 3-d ICDs, and the second on more general aspects of their use in realistic situations. A final section looked briefly at the possibility of formally specifying 3-d ICD representations. The following paragraphs describe particular objectives of work carried out in each of these phases in more detail.
The main aim of the first phase was to investigate whether users were able to make effective judgements about the relative depths of components in 3-d ICDs produced using the approach embodied in JIN, JINGLE and ICDEDIT. As described above, the approach to creating an illusion of depth used in these tools was somewhat unusual. It
was therefore felt that some investigation of the efficacy of this approach was needed before broader investigations into the utility of 3-d ICDs and the usability of depth-related features of ICDEDIT could be conducted. If users viewing diagrams produced using this approach were unable to see them as three-dimensional in the way intended, then an investigation of the utility and usability of 3-d ICDs qua 3-dimensional diagrams would not have been possible.
The aim of the second phase was twofold. The first objective was to investigate the utility in knowledge engineering of tools incorporating 3-d ICDs of the kind supported by ICDEDIT. It was envisaged that these findings could be used in determining whether further development of the existing prototype was justified and, if so, at which aspects of knowledge engineering activity potential future implementations of a tool incorporating 3-d ICDs would most usefully be directed. The second objective was to investigate the usability of features which permit 3-d ICDs to be manipulated in ICDEDIT to help in developing further versions of this tool.
specifica-tion of 3-d node and link diagrams of the kind produced by ICDEDIT. This work was done in order to be able to assess whether formal specifications of 3-d node and link representations would be useful in the development of future tools supporting the use of such diagrams.
1.5
Thesis Outline
The thesis begins by presenting introductory and background material about the broad context within which the work described was carried out. The work itself is then described and its results are reported. As explained above, the bulk of the work was carried out in two phases. The first (described mainly in chapters 4, 5 and 6) dealt with controlled experimental investigations of the perceptual properties of 3-d ICDs supported by JI~. The second (described in chapters 7, 8 and 9) adopted a case study approach to the investigation of the utility and usability of 3-d ICDs of the kind supported by ICDEDIT in the context of knowledge engineering. The thesis ends with three chapters which lay the foundations for further work on the use of 3-d ICDs in the human-computer interface of tools for knowledge engineering. The rest of this section provides a brief overview of the contents of individual chapters.
Chapter 2 sets the scene by considering the way in which human-computer interfaces have evolved, often to incorporate a greater emphasis on the use of graphical representations of one form or another. Various forms of graphical representation are considered and a summary of the arguments commonly made in favour of their use is presented. Chapter 3 contains a survey of the literature concerning the use of node and link diagrams in the representation of knowledge structures for knowledge-based systems. Interfaces for various types of user are considered, but the main emphasis is on those for knowledge engineers, that is, for the people who must design, develop and maintain such knowledge-based systems. This brief review is also intended to set the scene for the work reported in the following chapters.
Chapters 4, 5 and 6 describe experiments which investigated whether users were able to make effective judgements about relative depths of components in 3-d ICDs produced using the approach embodied in JIN, JINGLE and ICDEDIT. Chapter 4 describes cues ordinarily used in depth perception and the corresponding mechanisms commonly used to create an impression of depth in so-called 3-d computer-generated images. The cues used in JIN, JINGLE and ICDEDIT are then described in more detail. Chapter 5 describes a. pilot experiment carried out to investigate the effectiveness of these cues, and in particular of the use of rocking motion. Chapter 6 reports on two more detailed experiments on the effects of varying the angle and period of the rocking motion and the type of 3-d ICD.
Chapter 7 describes the methods used to conduct the investigation into the utility in knowledge engineering of 3-d ICDs and the usability of features of ICDEDIT. Six case studies were carried out with the aim of looking at real users working with 3-d represen-tations of real systems and performing tasks which were as realistic as possible within the constraints imposed by the prototypical nature of the tool. In each study, knowledge en-gineers were interviewed, and 3-d ICD representations of knowledge-based systems with which they had recently been working were developed for use in the subsequent phase of usability evaluation. Chapter 8 discusses issues relating to the utility of 3-d ICDs and chapter 9 reports on observations relating to the usability of depth-related features of ICDEDIT.
Chapter
2
Graphical Support for
Human-Computer Interaction
2.1
Introduction
This chapter aims to set the scene for the research described in the body of the thesis. A brief history of the development of graphical user interfaces is given. Arguments made in support of the use of such interfaces are presented and the applicability of these arguments to the case of interfaces based on the use of 3-dimensional representations is discussed. Some examples of the way graphical representations are currently used in various areas of application are given.
2.2 Evolution of the Human-Computer Interface
In the early days, when processing power was at a premium, commands issued by the user needed to be structured in such a way that their interpretation could be achieved using a minimum of computer resources. This meant typing commands to a dumb terminal in a language not too far removed from assembly code. As processing power became more readily available, it was, however, possible to shift the emphasis away from the needs of the computer and towards those of the human operator. By the late 1980's, the limiting factor on interactive (human-computer) system efficiency was often the cognitive capacity of the human rather than the performance of the computer [93].
At the same time as processors were becoming more powerful, rapid developments in
I/O
technology were also taking place. Terminals were no longer completely dumb, and display screens were larger and more able to handle detailed non-textual information due to higher resolution. This, coupled with the development of newI/O
devices such as trackerballs, joysticks and mice lead to the introduction of new techniques for interaction such as direct manipulation [125, 126].The next major development which seems set to take the market by storm is that of 'virtual reality' interfaces which use more advanced graphical representations as a basis on which to create the illusion of a 'virtual' or 'artificial' reality for the user of a computer system (see section 2.4.1). Negroponte predicts that our personal computers may in future support animated holographic images of agents or actors who wait on a stage ready to do our bidding [99]. Whatever the form of the human- computer interface in years to come, graphical representations of some form are, it seems, here to stay.
The following section presents an overview of the arguments which have been made in support of the use of graphical representations in the human-computer interface.
2.3
Arguments for the Use of Graphical Representations
A number of studies have been conducted to show that performance of problem-solving tasks can be significantly affected by the way in which the relevant information is pre-sented, independent of problem complexity [18, 158, 123]. In these studies, it is very often the case that more graphical forms of representation lead to superior task perfor-mance. Some studies have also attempted to demonstrate beneficial effects of presenting information in a 3-d form rather than relying on simple 2-d representations
[41
though the results of these studies have not been widely generalis able. This section will present some of the general points which are often raised in favour of the use of graphics in the human-computer interface and will briefly explore the possible extension of these arguments (often raised in connection with 2-d representations) to the context of 3-dimensional schemes.2.3.1 Information Bandwidth
One of the claims most commonly made in favour of graphical representations is that com-munication involving graphical information can take place over a much higher bandwidth than is possible using sequential text-based representations alone. This has several im-plications. It means that users should find it much easier to obtain some form of 'gestalt' or overview of the information from graphical representations than from text. Scanning for salient information should therefore also be easier. It also means that a given piece of information may often be expressed in a more compact form using some kind of graphical notation.
Communication based on the use of 3-dimensional representations can take place over an even higher bandwidth than that using 2-d representations. Robertson et al.
[1161
explain how more information can be displayed on a given screen using 3-d representations than is possible with 2-d. If spatial information is used as the basis for graphical coding of information of interest, then the availability of three dimensions rather than two will, of course, permit the coding of at least one further variable, thus again increasing the amount of information present in a single image. This might indeed mean that users are able to obtain a gestalt of larger chunks of information than would be possible with 2-d. Scanning for salient information may, however, be harder using a 3-dimensional representation than it would be with a 2-d version, partly because there may be more non-salient information to be filtered out in a 3-d display, and partly because some ofthe information (for example that shown 'further back' in the display) may sometimes be hidden from view.
2.3.2 Support for Mental Representations
Another set of related claims concerns the way in which graphical representations of information may map onto the user's own internal or mental representations of the same information. The strong claim here is that external graphical representations may map directly onto internal mental images with which people can reason directly using well-advanced visual recognition and pattern-matching capabilities. For example, Rumelhart
et al. [120] suggest that since relations among real world, physical objects are often
understood in visual or spatial terms, it should be easier to derive a mental model of an unknown system structure from a graphical representation than from a textual one. Larkin and Simon [85] also speculate on the possibility of such a mapping and suggest that these kinds of mental images, derived from external graphical representations should provide a computationally efficient means of problem-solving because of the ease with which information stored in such a form might be indexed.
The status of these claims is by no means clear. The debate as to the nature of mental imagery continues [3, 109, 55, 56] and it is certain that there are individual differences in the extent to which people tend to 'visualise' information. The type of information, or task which the user wishes to perform with it, are also likely to have an influence on whether users will tend to think in graphical terms or whether the 'natural idiom' will be graphical [136]. It does, however, seem likely that for some users and some kinds of information, a graphical representation might prove to be invaluable in providing exactly the kind of 'cognitively transparent representation' which is needed for effective comprehension and efficient solving of problems [20].
The extension of these arguments to the context of 3-dimensional representations is also by no means straightforward. Since real world, physical objects are seen by most people to be 3-dimensional, it might be thought that the relationships between them would be understood in terms of three dimensions. But just as it is not clear whether, or under what circumstances, people tend to visualise information, it is also not clear under what circumstances people might prefer to visualise information in terms of three dimensions rather than two. Whether or not such 3-wmensional representations would 'naturally' be used need not, however, be seen to be very important.
If
3-d representations are developed on a strong conceptual basis (for example by using two or three of the available dimensions to order the representation with respect to salient concepts), they are likely to be easily comprehensible and may themselves form a basis on which 3-dimensional mental representations can be developed. This in turn will assist the comprehension of further similar 3-d graphical representations.2.3.3 Other Claims
Whatever the status of this last set of claims, we can end on two more which may be stated with a greater degree of certainty. Firstly, there is a great deal of evidence to support the claim that graphical information is much more easily remembered than textual or verbal information. A greater proportion of pictorial information is retained, with recall being significantly better for pictures than for words, and the capacity for recognition of
pictures being almost limitless when measured under appropriate conditions [135]. This might be equally true of both 2-d and 3-d representations.
Lastly, but by no means least importantly, numerous studies have reported how com-puter users simply seem to enjoy interacting with their machines by using graphical representations much more than they do using text alone. Increasingly sophisticated 3-d representations are likely to be even more fun to work with than the old 2-d versions.
2.4
Graphical User Interfaces: Some Examples
This section presents some examples of particular ways in which graphical representations of various kinds have been used in various areas of application.
With the advent of the enabling technologies described above, the graphical bandwagon really began to roll. Software vendors were suddenly anxious to claim that their packages too supported Graphical User Interfaces or GUIs. This meant, in many cases, no more than that lines or boxes were drawn around chunks of text. Although this kind of facility can be of some use (for example in drawing attention to a particular piece of text by surrounding it with a brightly coloured or flashing box), it allows little more than would be possible with a purely text-based system. This kind of facility will therefore be discussed no further. Neither will the provision of windows, menus and graphical pointers by virtue of which many other software systems are said to possess GUIs. The emphasis will instead be on application areas in which the information of primary interest (that is, information about the application domain, rather than that about how the application itself works) has been displayed in a graphical form.
'Graphical' here can be taken to mean 'not purely textual', although many of the repre-sentations discussed will include some textual elements. (According to Fitter and Green
[57],
usable notations always contain both symbolic (textual) and perceptual (graphical) elements.) The order in which various areas of application are considered reflects the degree of realism or faithfulness of representation in the graphical images they use. The most realistic are presented first.2.4.1 Virtual Reality
Virtual reality systems achieve what is currently the closest we can get to a realistic representation of objects in the domain of interest. By wearing a head-mounted monitor (with stereoscopic display), earphones and a dataglove, users can gain a strong impression of interacting directly with the virtual world created in software (see figure 2.1). They can not only see the objects in that world, but hear and feel them too, as the headphones and dataglove provide for audio and tactile feedback.
This technology is relatively new and is as yet not in widespread use. It is therefore difficult to assess how useful it might eventually prove to be. Similar systems have been used at NASA in training astronauts to cope with unusual environments, and also in training people to work in dangerous environments such as failed nuclear reactors which cannot otherwise be easily simulated
[142].
Mercurio and Erikson
[94]
describe experiments with a virtual reality system in the field of scientific visualisation. The task here was to examine a 3-d graphical representation of theFigure 2.1: A Virtual Reality Interface
human brain with the aim simply of evaluating the possibilities for interaction provided by such a system. They report that their experience of virtual reality in this context was 'both disappointing and exciting': disappointing in the sense that the technology is not yet sufficiently developed, the hardware not yet sufficiently powerful and the mechanisms and metaphor for interaction not sufficiently well understood, but exciting in that there is apparently an enormous potential for displaying a wide variety of different types of data in such a way as to make it easy and useful to interact with.
Virtual reality systems allow users to draw heavily on their understanding of the real world in their interactions with data displayed. This should enhance their ability to appreciate, understand, reason about and remember information presented in such a way. They are also fun to use, as witness the increasing inclusion of elements of virtual reality in today's arcade games.
2.4.2 Pictures, Models and Metaphors
Applications in a number of areas use pictures or models of objects in the domain of interest and support a variety of metaphors which the user must learn in order to interact with them.
CAD packages initially used mainly 2-d projections so that designing an object using a computerised tool was very similar to drawing a plan or blueprint on paper, except
for relatively trivial differences concerning modifiability and ease of re-use. It is now
more common to use 3-d graphical representations (see, for example, figure 2.2) with more powerful systems allowing the users to manipulate the models, using a joystick or trackerball, or even a keyboard, in a way analogous to that in which a concrete scale model might be turned over in space. Still more powerful systems allow users to animate their models so that, for example, parts of an engine can be seen working together in much the same way as they would do in real life.
Figure 2.2: Graphical Representation Used in a Tool for CAD
objects or systems with which students or operators are being trained to work. Early
systems again used 2-d, often iconic representations. For example Steamer [137] used 2-d
schematic diagrams of a steam propulsion plant consisting of graphical representations
of pipes, gauges, valves and pumps which could be animated to illustrate the behaviour
of the plant under certain conditions of interest (see figure 2.3). The user could
con-trol operation of the simulated plant by clicking with a mouse on various objects in
the display. Systems such as ThingLab [11] and Lab VIEW [148] used similar schematic
and iconic representations of electrical circuits, mechanical constructions and laboratory
instruments which could be manipulated by the user via the mouse. More recent train
-ing systems often use much more realistic graphical representations. For example, the
periscope simulator built by Marconi for the Dutch Navy [129] represents realistic 3-d
images of ships and aircraft in surroundings which can be varied to simulate different
times of day and different sea conditions.
Another class of tools which rely heavily on the use of sophisticated graphical repre-sentations are those for scientific visualisation. Molecular modelling systems have for
some time used 3-d representations of molecular structures (see figure 2.4) in order to
investigate and experiment with new arrangements [114, 53].
There has also been a proliferation of medical imaging systems [143, 1, 61] which allow
the user to non-invasively view the interior of a human body thanks to the computerised display of 3-d data derived from various scanning techniques.
The kinds of system described in this section all use sophisticated graphical
representa-tions of real world objects of interest to the user. Representations used here are never
as realistic as those supported by virtual reality environments: however accurate the representation may be, the user is always aware to some extent of looking at a picture
on a screen rather than a real object. However, the use of detailed images still has the
advantages described above concerning high bandwidth communication of information in
a form readily understood due to its similarities with other forms of information about
the real world which we regularly process. The challenge in this case is to find a metaphor
Figure 2.3: Graphical Representation Used in Steamer
[image:43.533.15.526.15.731.2]or means of interaction with such images which will allow users to forget, as far as pos-sible, that they are dealing with a computer-based representation, and allow them, for example, to imagine that they are turning over a real 3-d model in their hands.
Sometimes, of course, it is not realism that is important. In the case of medical imaging, for example, we may not really want to know what a particular part of the body would look like if we were to cut it open, but are more interested in the concentrations of various substances in various areas which can easily be shown artificially in a computer-based representation. The case of molecular modelling systems is similar. Since molecules are not actually visible to the naked eye, even with the aid of the most powerful microscopes, a suitable means of representing their structures has had to be invented in order to allow us to understand, manipulate and reason about them. Computer-based tools for molecular modelling therefore often display more or less realistic representations of the kinds of 3-d models used by scientists earlier this century.
This section has provided a brief overview of the kinds of system in which slightly less realistic graphical representations of objects in the domain of interest can be extremely useful. It has introduced the idea that in some cases, realism or accuracy ofrepresentation is not the important issue. Such realism may be impracticable or even undesirable in systems such as those for molecular modelling. The systems described in the following section are used in domains in which the objects or entities of interest are abstract, and for which there can be no such thing as a realistic representation. They raise a further, slightly different set of issues.
2.4.3 Representing the Abstract
Systems such as databases and knowledge based systems deal with abstract entities like data or knowledge structures. Programs are made up of abstract constructs and software systems consist of abstract components. Tools for the design and development of these systems must therefore find a way of representing this abstract information which is helpful to the user in supporting the necessary design and development tasks, and may also enhance understanding by making the abstract concrete.
Scientists have long been familiar with the idea of representing abstract data in the con-crete form of graphs, pie charts, bar charts and histograms. These concon-crete representa-tions have proved useful in conveying an appropriate understanding of the data, allowing users to compare, contrast, reason and infer in useful ways. Traditional 2-d paper-based techniques for representation have now been taken up by computer-based tools and de-veloped into 3-d interactive versions (see figure 2.5) which can enhance understanding still further [119].