City, University of London Institutional Repository
Citation
:
Jarkasy, Samer (2005). Valuation bias in the stock market. (Unpublished Doctoral thesis, City University, London)This is the submitted version of the paper.
This version of the publication may differ from the final published
version.
Permanent repository link:
http://openaccess.city.ac.uk/18931/Link to published version
:
Copyright and reuse:
City Research Online aims to make research
outputs of City, University of London available to a wider audience.
Copyright and Moral Rights remain with the author(s) and/or copyright
holders. URLs from City Research Online may be freely distributed and
linked to.
Sir John Cass Business School,
City
of
London - Faculty
of
Finance
City University, London
VALUATION BIAS IN
THE STOCK MARKET
• Valuation Bias and Stock Age:
New Stocks versus Survivors
• Stock Market Levels in the UK:
Earnings Yield, Growth, and Return Expectations
• Investment Knowledge and Stock Price
Rationalisation:
Evidence from Property Investment Stocks
A thesis presented by
Samer Jarkasy
to The Faculty of Finance, Sir John Cass Business School, City University, London in partial fulfilment of the requirements for the degree of Doctor of Philosophy
Table of Contents
Lists of Tables and Figures ... .iv
Dedication ... '" ... vi
Acknowledgements ... vii
Thesis Release Form ... viii
SYJ11bols ... ix
Thesis Abstract. ... x
Brief Table
of
Contents
1 Chapter One: Introduction ... 12 Chapter Two: Literature Review ... 7
2.1 Introduction ... 8
2.2 Fundamental Valuation ... 9
2.3 Behavioural Bias ... 16
2.4 Stock Market Levels ... 20
2.5 Property Investment Stocks Discount: Related Literature ... 25
2.6 Conclusion ... 31
3 Chapter Three: Valuation Bias and Stock Age: New Stocks versus Survivors ... 34
3.1 Introduction ... 36
3.2 Data ... 40
3.3 Differences in Market Valuation. Valuation Gap Behaviour, and IPO Evidence ... .47
3.4 Valuation Model and Joint Testing ... 55
3.5 Differences in Individual Fundamentals versus Valuation Differences ... 69
3.6 Competing Hypothesis; Pricing the Long-Term Future ... 78
3.7 Concl usion ... 89
3.8 Appendix ... 93
4 Chapter Four: Stock Market Levels in the UK: Earnings Yield, Growth, and Return Expectations ... 111
4.1 Introduction ... 113
4.2 Data ... 118
4.3 Valuation Framework; Earnings Yield Model ... 119
4.4 Examining Earnings Yield Levels ... 129
4.5 Testing the Fundamental Valuation Hypotheses ... 139
4.6 Conclusion ... 160
4.7 Appendix ... 166
5 Chapter Five: Investment Knowledge and Stock Price Rationalisation: Evidence from Property Investment Stocks ... 168
5.1 Introduction ... 170
5.2 Definition of Property Investment Stocks; Why they are Different from REITs ... 175
5.3 Data ... 178
5.4 Property Investment Stocks Discount: Is it Knowledge-Based Rationality? ... 181
5.5 Conclusion ... 209
5.6 Appendix ... 213
6 Chapter Six: Conclusion ... 217
Detailed Table
of
Contents
1 Chapter One: Introduction ... 1
2 Chapter Two: Literature Review ... 7
2.1 Introduction. . ... 8
2.2 Fundamental Valuation ... 9
2.3 Behaviouml Bias ... 16
2.4 Stock Market Levels ... 20
2.5 Property Investment Stocks Discount: Related Literature ... 25
2.6 Conclusion.. . ... 31
3 Chapter Three: Valuation Bias and Stock Age: New Stocks versus Survlvors ... 34
3.1 Introduction ... 36
3.2 Data ... 40
3.3 Differences in Market Valuation, Valuation Gap Behaviour, and IPO Evidence ... 47
3.4 Valuation Model and Joint Testing ... 55
3.4.1 Valuation Framework and Model Structure ... 55
3.4.2 Model Estimation and Age Effect: Does the Model Explain Valuation Differences? ... 61
3.5 Differences in Individual Fundamentals versus Valuation Differences ... 69
3.5.1 Differences in Profitability and Efficiency ... 69
3.5.2 Diftcrences in Growth ... 71
3.5.3 Differences in Risk ... 73
3.5.4 Net Effect of Fundamental Differences ... 77
3.6 Competing Hypothesis; Pricing the Long-Term Future ... 78
3.6.1 Competing Hypothesis Introduction ... 78
3.6.2 Competing Hypothesis Testing ... 80
3.6.3 Market and Cash Flow Simulated Valuations ... 84
3.7 Conclusion ... 89
3.8 Appendix ... 93
3.8.1 Data Appendix ... 93
3.8.2 Empirical Analysis Appendix ... 106
4 Chapter Four: Stock Market Levels In the UK: Earnings Yield, Growth, and Return Expectations ... 111
4.1 Introduction ... 113
4.2 Data ... 118
4.3 Valuation Framework; Earnings Yield Model ... 119
4.3.1 An Earnings Yield Based Model ofthe Market-to-Book Equity Ratio ... 119
4.3.2 Estimating the Empirical Model. ... 125
4.3.3 The Sensitivity of Earnings Yield to Growth and Risk ... 127
4.4 Examining Earnings Yield Levels ... 129
4.4.1 Earnings Yield, Risk-Free Rate, Risk, and Growth ... 129
4.4.2 Plausible Scenarios for Earnings Yield ... 132
4.4.3 Earnings Yield Prcdictions ... 136
4.5 Testing the Fundamental Valuation Hypotheses ... 139
4.5.1 Can Changes in Profitability Explain Stock Price Fluctuations? ... 139
4.5.2 Expected Growth; The Main Culprit? ... 144
4.5.3 Can The Explanation Be in Risk Aversion Levels? ... 151
4.6 Conclusion ... 160
4.7 Appendix ... 166
4.7.1 Deriving Empirical Earnings yield ... 166
4.7.2 Expected Inflation - Measures' Comparison ... 167
5 Chapter Five: Investment Knowledge and Stock Price Rationalisation: Evidence from Property Investment Stocks ... 188
5.1 Introduction ... 170
5.2 Definition of Property Investment Stocks; Why they are Different from REITs ... 175
5.3 Data ... 178
5.4 Property Investment Stocks Discount: Is it Knowledge-Based Rationality? ... 181
5.4.1 Does Return Differential Justify The Discount? ... 182
5.4.2 Other Contributing Factors to the Discount.. ... 195
5.4.3 Can the Discount Be Explained Rationally in Cross-Sectional Analysis? ... 198
5.4.4 The Relative Stability of Property Stock Prices against Fundamental Value and the Overall Stock Market ... 202
5.5 Conclusion ... 209
5.6 Appendix ... 213
5.6.1 Quartile Statistics for Property Stocks Discount ... 213
5.6.2 List of Public Property Companies Traded in the UK ... 214
5.6.3 Total Return Simulation for Property Stocks ... 215
6 Chapter Six: Conclusion ... 217
Lists of Tables and Figures
Tables
Table 3-1. Stocks in the Dataset and the Corresponding Market-Cap ... 40
Table 3-2. Differences in Market Valuation, Survivor and New Stocks ... .48
Table 3-3. Differences in Market Valuation, Age Groups ... 48
Table 3-4. Weighted Average Market-to-Book Ratio for Age Groups ... .49
Table 3-5. MBE for Age and Size Groups (Market-Cap for Size) ... 54
Table 3-6. Value Relevance/Explanatory Model ... 61
Table 3-7. Value Relevance/Explanatory Model; Survivors versus New ... 67
Table 3-8. Profitability, Efficiency and Leverage; Survivor and New Stocks ... 70
Table 3-9. Profitability, Efficiency and Leverage; Age Groups ... 70
Table 3-10. Realised Growth; Survivor and New Stocks ... 72
Table 3-11. Realised Growth; Age Groups ... 72
Table 3-12. Difference in Beta and the Cost of Equity ... 74
Table 3-13. Stock Returns and Volatility ... 75
Table 3-14. Value Growth and Retained Earnings ... 83
Table 3-15. MBE Simulation ... 86
Table 3-16. Dataset Firms and Excluded Financial Stocks ... 93
Table 3-17. Raw Data Items ... 94
Table 3-18. Value, Cash Flow, Income and Return on Investment ... 106
Table 3-19. MBE for Age and Size Groups (Total Assets for Size) ... 108
Table 3-20. Re-Estimated Value Explanatory Model without Age ... 108
Table 3-21. Leverage, Survivor and New Stocks ... 109
Table 3-22. Leverage, Age Groups ... 110
Table 4-1. Perpetual Growth Substituting Detailed Growth Rates ... 123
Table 4-2. Empirical Verification for MBE/EYTheoretical Model ... 126
Table 4-3. Earnings Yield versus Risk-Free Rate ... 130
Table 4-4. Plausible Scenarios for Earnings Yield 1989-2002 ... 132
Table 4-5. Procedure for Predicting stock Market Levels Using EY Model ... 136
Table 4-6. Predicting Stock Price Fall After 1999 Peak ... 138
Table 4-7. TRS against ROE Regression ... 141
Table 4-8. The Impact of Growth on Market Valuation (EY. MBE) - Illustration ... 145
Table 4-9. Implied Growth in Stock Market Valuation ... 147
Table 4-10. Unbiased Return Expectations - Ex Ante Estimation ... 154
Table 4-11. Discount Rate Implied in Market Valuation ... 156
Table 4-12. Rate of Returns Correlation Matrix ... 157
Table 5-1. Datastream Raw Data Items 1990-2002 ... 179
Table 5-2. Property Stocks Detailed Hand-Collected Dataset 2001-2003 ... 180
Table 5-3. Property Stocks Discount v Return Differential 1990-2002 ... 188
Table 5-4. Triple-NA V Calculation ... 189
Table 5-5. Discount-to-NAV v Discount-to-Triple NAV 2001-2003 ... 190
Table 5-6. Property Stocks Discount and Return Differential, Corrected NA V 2001-2003 ... 192
Table 5-7. The Significance of Property Unrealised Capital Gains ... 196
Table 5-8. Property Sector Bids 1999-2002, Merrill Lynch Report 2002 ... 197
Table 5-9. Explaining Market Valuation and the Discount... ... 199
Table 5-10: Discount-to-Triple NA V on Operating Expenses Regression ... 201
Table 5-11. Property Stocks Discount-to-NA V; Quartile Statistics ... 213
Table 5-12. UK Real Estate Publicly Traded Companies at The End of 2002 ... 214
Table 5-13. Property Stock Return Simulation - Projection Assumptions ... 215
Table 5-14. Property Stock Return Simulation - Projected P&L & Equity ... 216
Table 5-15. Property Stock Return Simulation - Projected Balance Sheet. ... 216
Figures
Figure 1-1. The Process of Equity Pricing ... 4
Figure 3-1. Research Method Flow Chart ... 39
Figure 3-2. Median and Weighted Average MBE for Age Groups ... 50
Figure 3-3. Evolution ofMedianMBE Over Time ... 51
Figure 3-4. Evolution of Weighted Average MBE Over Time ... 52
Figure 3-5. Valuation Gap Behaviour and Stock Market Levels ... 53
Figure 3-6. Value Driver Tree - Finn Perspective ... 56
Figure 3-7. Value Driver Tree - Equity Perspective ... 56
Figure 3-8. Age Impact on Market Valuation ... 64
Figure 3-9. Model versus Historic MBE; Age Groups ... 65
Figure 3-10. Model versus Historic MBE; Survivor and New Stocks ... 66
Figure 3-11. Age and Death for Listed Public Limited Companies ... 76
Figure 3-12. Competing Hypothesis to Valuation Bias ... 79
Figure 3-13. Growth in Market Value and Book Equity, New Stocks ... 81
Figure 3-14. Growth in Market and Book Values, Survivor Stocks ... 81
Figure 3-15. Value Growth and Retains Earnings ... 83
Figure 3-16. MBE Simulation ... 86
Figure 4-1. Stock Market levels versus the Economy ... 114
Figure 4-2. Market-to-Book Ratio, UK Non-Financial Sector ... 115
Figure 4-3. The Matrix of Growth and Risk Pricing Impact on Stock Valuation ... 117
Figure 4-4. The Sensitivity of Earnings Yield to the Level of Expected Growth ... 127
Figure 4-5. The Sensitivity of Earnings Yield to the Level of Expected Return ... 128
Figure 4-6. The Sensitivity of Stock Efto Risk as Measured by Beta ... 128
Figure 4-7. Earnings Yield versus Risk-Free Rate ... 131
Figure 4-8. Corporate Profitability, ROE ... 140
Figure 4-9. Stock Market Levels versus Corporate Profitability ... 141
Figure 4-10. Implied Growth v Economic Growth ... 148
Figure 4-11. Growth Gap against Stock Market Levels ... 148
Figure 4-12. Expected Return on the Stock Market.. ... 155
Figure 4-13. Discount Rate Implied in Market Valuation - Comparison ... 158
Figure 4-14: Expected Inflation Estimation - Comparison ... 167
Figure 5-1. PremiumlDiscount-to-NAV ... 171
Figure 5-2. Comparative Total Return - Average 1986-2002 ... 182
Figure 5-3. Market-Adjusted CAR: FTSE RE v FTSE ALL 1986-2002 ... 183
Figure 5-4. Comparative Total Return - Time Series 1986-2002 ... 184
Figure 5-5. Total Return Simulation for Property Stocks ... 186
Figure 5-6: Discount-to-NA V versus Discount-to-Triple NA V 2001-2003 ... 190
Figure 5-7: The Discount-to-Triple NAV and Administrative Expenses 2001-2003 ... 193
Figure 5-8: The Discount-to-Triple NAV and Property Expenses 2001-2003 ... 194
Figure 5-9: The Relation between the Discount-to-NAV and Employee Costs 1990-2002 ... 194
Figure 5-10. The Stock Market and Property Stocks Levels v The Economy ... 204
Figure 5-11. Implied Growth in Market Valuation - Comparison ... 205
Figure 5-12. Earnings Yield Comparison ... 206
Figure 5-13. Return on Equity Comparison ... 207
Dedication
To Everyone In My Filmlly
Anc/ Specl"iJ11y Dec/iciltec/
To who Hils Entetec/ My Life
Anc/ Ownec/ My Heil/t,
Acknowledgements
I would like to express my deep gratitude to my supervisor
Dr Alistair Milne for guiding me with his valuable advice
throughout this work. I would also like to thank Professor
Giovanni Urga for his support. I would like to thank my examiners,
Professor Chris Brooks and Stephen Wright, and of course the
Chairman Professor Geoffrey Wood.
My special thanks and gratitude go to Sir John Cass
Business School, City University for offering me this precious
opportunity to conduct this research.
Last but not least; I can never forget to thank those who
never forgot me, who always supported me whenever I needed
support, those who I live with and/or, my best gift 'my Family and
Thesis Release Form
I hereby grant the librarian and any of the lawful employees of City
University, London, on application, this thesis to be copied in whole or in part
without further reference to the author. This pennission covers only single copies
made for study purposes, subject to the nonnal conditions of acknowledgement.
Symbols
Symbol Description Symbol Description
A All stocks (new and survivors together) LTD Long-term debt (loan capital> I year)
AEX Administrative expenses LTDBE Long-term debt to book equity
ATU Asset turnover LTDMVE Long-term debt to market value of equity
BE Book equity LTDTA Long-term debt to total assets
BVD Book value of debt M&A Merger and Acquisition
BVMI Book value of minority interests MBE Market-to-book of equity
CAPM Capital Asset Pricing Model MBF Market-to-book offirm
CCGT Contingent capital gains taxes MI Minority interests
CE Capital Employed MVE Market value of equity (market-cap)
CF Cash flow Nor NEW New stocks group
CFBE Cash flow-to-book equity ratio NAV Net asset value (shareholders funds)
CFP Cash flOW-Io-price ratio NI Net income (earned for ordinary shareholders)
CV Continuing value (terminal value) i,NNNAV Triple-NAV
D Debt capital NOPAT Net operating profit after taxes
DISC Discount-to-NAV (percentage) i,NPM Net profit margin
DlSC3N Discount-to-Triple NA V (percentage) Obs Observations
DPAM Annual depreciation & amortisation OEQ Ordinary equity capital and reserves (NA V)
DPS Dividends per share P Stock price
DR Discount rate PIE Price-earnings ratio
DTBS Deferred taxes (balance sheet account) PEX Property expenses
DTiS Deferred taxes for the year (P&L) PM Profit margin
E Equity capital R Stock returns
EBIT Earnings before interest and taxes RE Real Estate
EBITA Earnings before interest, taxes & REBE Retained earnings-ta-book equity amortisation
lEGS Earnings iREIT Real estate investment trust
IEp
Earnings-price ratio (inverse of PIE) iRENT Rental incomeIEps
Earnings per share iREP Retained earnings per share-to-share priceERP Equity risk premium REPS Retained earnings per share
EXOR Extraordinary items REVAL Property revaluation reserve
EY Earnings yield (same as EP) RF Risk-free rate
FCF free cash flow RM Expected return on the market
FRS financial Reporting Standard(s) iROE Return on equity
FVAD Debt fair value adjustment iROEC Return on capital employed (same as ROIC) FVD fair value of debt (MV estimate) ROIC Return on invested capital (same as ROCE)
G (or g) Growth rate RPI Retail price index
GDP Gross Domestic Product (nominal) RY Rent yield
GEBIT Growth in EBIT SorSUR Survivor stocks group
GEGS Growth in earnings T Tax rate
GEPS Growth in earnings per share TA Total assets
GTU Growth in turnover TABE Total assets to book equity (leverage)
HBETA Historic leveraged beta TAX Tax charge
IC Invested capital (capital employed) TD Total debt (Iong- and short-term)
INVP Investment properties market value TRS Total return to shareholders
IPD Investment Property Databank Index TUR Turnover (total trading income)
KD Cost of debt capital WA Weighted average
Abstract
1In our first study (Chapter 3) we investigate valuation bias in the UK. stock market by examining the valuation of new stocks relative to survivor stocks as new stocks have relatively higher valuations with the valuation gap increases in: bullish markets and vice versa. The value explanatory model and individual fundamental factor tests developed provide evidence of a negative significant relation between age and value. This does not seem to be backed by any known economic rationale given that new stocks showed lower profitability levels, no concrete evidence of materialised higher growth or lower risk which is inconsistent with their relatively higher valuations indicating that valuation bias could well be present.
The evidence in the first study does not imply that valuation of survivor stocks is rational or otherwise. Hence, in our second study (Chapter 4), we seek evidence on valuation bias at the stock market aggregate level where the occurrence of major divergences between stock prices on one side and economic growth and equity invested capital on the other, followed by subsequent price falls (corrections) is evident. The evidence obtained shows: (a) low earnings yields using theoretical and empirical models under plausible scenarios, (b) no changes in corporate profitability pattern that could explain stock price levels, (c) a cyclical gap between implied growth and economic growth, (d) that implied growth was almost always higher than both economic and earnings realised growth, and finally (e) the implied average equity risk premium compared with the evidence in the literature and the market unbiased expected return appears to underestimate risk revealing a paradox of high return expectations driving prices up implying lower equity risk premium. The evidence on balance, suggests that stock price levels in the UK. during 1989-2002 cannot be explained by fundamentals and the idea of temporary mispricing is not supported by strong evidence leaving the door open to argue the presence of overvaluation on average during 1989-2002.
One of the implications of valuation bias and stock age is that investors are relatively more limited in exaggerating the potential of survivor stocks because of the better investment knowledge available about them compared to new stocks. Thus, in our third study (Chapter 5), we seek evidence for the role of 'investment knowledge' in 'stock price rationalisation' from property investment stocks exploiting the special investment characteristics of their underlying assets and operations. We establish the presence of a significant and enduring market discount to the underlying value for property investment stocks. We test the hypothesis that property investment stocks discount is a reflection of investment knowledge-based rationality that limits valuation bias for these stocks. In testing the hypothesis, we establish knowledge-based rational explanations for property stocks market valuation or discount. The evidence from return differential, operating expenses, capital gains risk, leverage risk, and the stability of property stock prices, unlike the overall stocks market, relative to the economy and the underlying value leads towards not rejecting the null hypothesis.
II Each of the three main chapters 3, 4, and 5 has its own more comprehensive abstract at its
1 Chapter One: Introduction
Bias as a notion can be found in too many areas and walks of life. Bias in
equity valuation would be one type of investor behavioural biases that would fit
under behavioural finance.2 Valuation bias would exist if equity valuations were different for different groups of stocks in a way that is inconsistent with, or
unsubstantiated by, the differences between their underlying corporate and
economic fundamentals that determine value. Bias would also exist if overall
stock market levels were inconsistent with the underlying economic and corporate
fundamentals of value.
Therefore, for this thesis, valuation bias is defined as the case when valuation levels or differences are driven by investor expectations that are inconsistent with fundamental corporate and economic factors.
It is important to clarify that valuation bias in this thesis deals with (a) bias in
valuing a category of stocks relative to other stock categories, such as the market
valuation of new stocks relative to older stocks (Chapter 3), and (b) bias relative
to value fundamentals, such as on the overall stock market levels (Chapter 4).
The reader's attention is drawn to the specific meaning and interpretation of the
term valuation bias in this thesis. Of course, as with many terms, the use of the
term valuation bias is not perfect or free from abuse. However, the research
tackles investor behaviour with respect to valuation emphasising behavioural bias
explanations for valuation differences and value levels amongst stock age groups
and against fundamentals. Thus, the term would fit this context given the wide use
of the term bias in behavioural finance literature (behavioural biases) especially
that using mis-valuation or mis-pricing is problematic too as fair value levels are
unknown and they do not emphasise the behavioural aspects explicitly.
Valuation bias would be a systematic tendency for mis-valuation. The evidence of
this thesis, as shown later, would suggest that for the period understudy.
Mis-valuation is due to investor behaviour, hence, while the term bias conveys this
message, the degree and persistence of bias will always be debatable. The length
of the period for which unexplained value levels, fluctuations and differences 14
years is reasonably long for the modem economic era. The long-standing evidence
on IPOs systematic long-term underperformance that our evidence meets, as
shown in Chapter 3, backs the use for the term bias as far as persistency is
concerned. Also, some researchers such as Sougiannis and Yaehura (200 I) used
similar term 'Bias of Equity Values' in the context of stock valuation.3
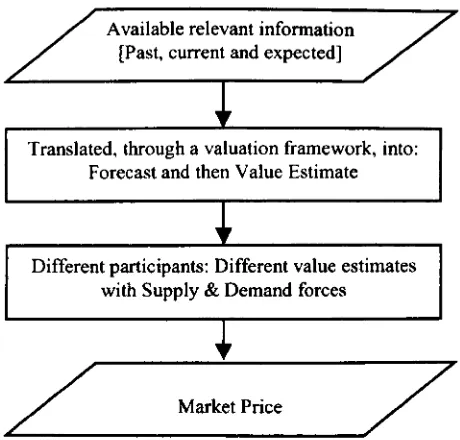
Figure 1-1 illustrates the process of market valuation/stock pricing based
on basic economic and investment logic. It shows equity valuation as an ex ante
estimate for the values of firms based on conditional expectations. The process is
built on translating available relevant information into forecast and then into value
estimate through a valuation model, and with supply and demand forces the
market price is shaped. The figure shows that errors and bias can occur because of
wrong investor expectations, flawed pricing model, flawed model interpretation,
and mainly because human behaviour is involved in the entire process.
Therefore, it is not difficult to agree that this market process, by its very nature
and structure, is susceptible to biased behaviour in pricing and trading different
stock categories, leave alone aggregate market mispricing.
3 Bias in life could be in one/several position(s), one/several case(s), some period(s) ... or
Available relevant information [Past, current and expected]
Translated, through a valuation framework, into: Forecast and then Value Estimate
Different participants: Different value estimates with Supply & Demand forces
/ Market Price /
~---' Figure 1-1. The Process of Equity Pricing
An important part of the motivation for this work is the severe fluctuation
In stock market levels that do not seem to accord with any robust economic explanation. We sympathise with Shiller (2001) that the stock market ups and
downs over the last century have made virtually no sense ex post, because we
initially believe that stock prices are often driven by complex investor
expectations rather than by the underlying corporate and economic fundamentals.
This thesis covers three main studies:
• Valuation Bias and Stock Age: New Stocks versus Survivors. Under which we
investigate the presence of valuation bias through examining whether
differences in fundamentals can explain the evident differences in market
valuation between new and older stocks as the former have relatively higher
valuations. Chapter 3.
• Stock Market Levels in the UK: Earnings Yield, Growth, and Return
Expectations. The first study does not address whether survivor stocks'
valuation or overall stock market levels are reasonable. Therefore, the second
study deals with valuation bias at stock market level by investigating whether
[image:15.510.133.363.64.284.2]by fundamentals such as reasonable expected profitability, expected growth
and/or risk levels or whether stock prices on average over time are correctly
valued against fundamentals with occasional mispricing. Otherwise, stock
market levels in the UK could be overvalued, on average, relative to
fundamentals. Chapter 4.
• Investment Knowledge and Stock Price Rationalisation: Evidence from
Property Investment Stocks. The third and final study in this thesis starts from
one of the implications of the first study that investors might have been more
able to exaggerate the potential of new stocks relative to survivor stocks as the
market knows relatively more about older stocks. Hence, in the context of
'valuation bias in the stock market' we study the role of 'investment
knowledge' in 'stock price rationalisation' exploiting the special investment
characteristic of property investment stocks because such knowledge about
them is available and reliable. In particular, we explore whether valuation bias
is less for property investment stocks relative to non-financial stocks (as per
Chapters 3 and 4) because of the greater investment knowledge about the
former. Chapter 5.
We believe it is appropriate to comment at this stage on the cornerstone of
our methodology. The premise on which the research method is built for this work
is derived from standard finance theory and practice and common sense of
investment and economics. That is, the value of a business is a function of its
prospective profitability, growth potential and risk. Hence, when we value
companies, small or large, we need to learn about their prospective profitability,
growth and risk. From profitability and growth, cash flows can be derived and
from understanding the risk of the business, whether operational, financial, or
other such as political risk of some operations in a foreign country, the required
rate of return can be estimated and hence the business can be valued. These
factors are what we really need to value a business. These are the proxies of real
value fundamentals bearing in mind that eventually these factors capture the
The remainder of this thesis is structured as follows: Chapter 2 presents
the literature review for the whole thesis under suitable headings, Chapter 3
covers valuation bias and stock age, Chapter 4 deals with stock market levels in
the UK, Chapter 5 covers investment knowledge and stock price rationalisation,
and Chapter 6 concludes the thesis and presents prospects for future research.
Each chapter of the main studies (Chapters 3, 4 and 5) is structured as follows: A
chapter abstract is presented at the outset, followed by a chapter introduction
covering motivation, objectives, hypotheses, and method. Data are then discussed
followed by the empirical analysis and results. Then a chapter conclusion
2 Chapter Two: Literature Review
2.1 Introduction
This chapter presents a reVIew of related literature divided into four
categories:
(a) Fundamental valuation, covering the economic fundamental explanations for
market valuations. Chapters 3, 4 and 5, the three empirical studies presented in
this thesis, examine whether fundamentals can explain observed stock market
values.
(b) Behavioural bias, reviewing behavioural explanations of stock market
valuation. It will be argued that the results presented in this thesis are consistent with the hypotheses of behavioural finance, in particular
behavioural bias, not withfundamental valuation. 4
(c) The literature on stock market levels, in particular excess volatility and
overvaluation. Chapter 4 examines, empirically, valuation bias relative to
fundamentals at stock market overall level in the UK.
(d) The literature related to property investment stocks. These are the subject of
the third empirical study presented in this thesis. Chapter 5 uses property
investment stocks to examine the role of investment knowledge in stock price
rationalisation. Some relevant articles on real estate investment trusts and
closed-end funds are reviewed in this section too.
4 Behavioural bias, the subject of this thesis, is not to be confused with survivorship bias. The
2.2 Fundamental Valuation
Equilibrium models such as the Capital Asset Pricing Model (CAPM), the
single risk factor model of Shapre (1964) and Lintner (1965), and the Arbitrage
Pricing Theory (APT), the multi-risk factor model of Ross (1976) are classical
efficient markets models to asset pricing.5 In the 1970s, the efficient markets theory related asset prices to economic fundamentals, using rational expectations
to link finance and the entire economy. The models of Merton (1973), Lucas
(1978), and Breeden (1979) of efficient markets concluded that stock prices are
the expected present value of future dividends relating the discount rate to the
utility of consumption. 6
Standard finance theory postulates that the value of a capital asset should be equal
to the present value of its expected future outcome stream (e.g., dividends, cash
flow, and earnings). Hence, fundamental approaches to stock valuation are used to
estimate the fair or intrinsic value of companies based on key fundamentals.
Popular standard fundamental approaches to equity valuation such as the
Enterprise DCF, the Equity DCF (or Dividends Discount Model), the Adjusted
Present Value (APV), and the Economic Value Added (EVA) use the key
fundamental variables of profitability, growth and risk to derive and value future outcomes.7 Profitability and growth determine cash flow (or earnings) and understanding business and financial risk is required to estimate the cost of capital
to value future cash flows (or estimate and value EVA stream). These four
approaches are all mathematically equivalent. The standard textbook of Copeland,
5 One could dwell too much on asset pricing theory. However, focus is kept on valuation bias, the subject of this thesis. For discussion and tests of CAPM and APT, see for example, Fama and MacBeth (1973), Dybvig and Ross (1985), Gultekin and Bulent Gultekin (1987), Wei (1988), and Fama. and French (1996), also Elton and Gruber (1995) is a standard textbook that covers these asset pricing theories
6 Merton (1973): An Intertemporal Capital Asset Pricing Model (ICAPM) that generalizes the original CAPM. According to the Lucas (1978) model, in a rational expectations general equilibrium rational asset prices may have a forecastable element that is related to the forecastability of consumption. According to the Breeden (1979) model, a stock's beta is determined by the correlation of the stock's return With per capita consumption.
Koller, and Murrin (2000) discusses these valuation approaches in great detail;
also Damodran (1996) and Brealey and Myers (2000) deal with the same.
CAPM and APT are classical models that provide the required rates of return for
fundamental valuation. In a theoretical ideal world, stock prices would represent
the present value of future outcomes discounted at a rate of return that can be
justified by an equilibrium model where average stock returns are the same as the
discount rates. There is sufficient confirmation in the literature for the importance
of profitability, growth and risk (discount rates) in equity valuation as shown later
in this section. Below is a review of articles relevant to fundamental valuation.
One type of research concentrated on fundamental-based analysis to
address explaining or predicting stock returns. For example, all of Rosenberg,
Reid and Lanstein (1985), DeBondt and Thaler (1987) and Chan, Hamao and
Lakonishok (1991), and Fama and French (1992) find a relation between
book-to-market equity and stock returns. Other research shows other variables are related
to subsequent stock returns, such as earnings yield [Jaff, Keirn and Westerfield
(1989)], cash flow yield [Chan, Hamao and Lakonishok (1991)] and historical
sales growth [Lakonishok, Shleifer, and Vishny (1994)]. Campbell and Shiller
(1988) find (a) long moving average of real earnings helps to forecast future real
dividends, (b) the ratio of earnings to current stock price is a powerful predictor of
the return on stock. Goetzmann and Jorion (1993) find no strong statistical
evidence indicating that dividend yields can be used to forecast stock returns.
Fama and French (1993) show that size and book-to-market equity ratio are
proxies for sensitivity to risk factors that capture strong common variation in
stock returns and help in explaining the cross-section of average returns [see also
Fama and French (1995) on the relation between average stock returns and size,
and average return and book-to-market equity]. Robertson and Wright: (2002)
show that Tobin's q strongly predicts stock returns. In their paper on 'the good
news and the bad news about long-run stock returns' (2002b), they show that the
predictive power of valuation criteria significantly reduces the uncertainty
associated with long-run stock market returns. In another paper by them (2003),
stock returns in which, following Miller and Modigliani (1961), they construct a
measure of the dividend yield that includes all cashjlows to shareholders. Dupuis
and Tessier (2003) show that, for the long-run variance decomposition, 76 percent
of the low-frequency dynamics in stock prices are explained by permanent shocks
to dividends and the remaining 24 percent are explained by permanent shocks to
real interest rates.8
Another type of fundamental-based research addresses direct stock
valuation, and here are some relevant examples. According to Miller and
Modigliani (1961), a share value represents the present value of (a) normalised
earnings from existing assets, plus (b) the present value of future growth
opportunities. Grossman and Shiller (1981) find that the present value of
dividends since 1881 had only a thin relation to actual stock prices in the US.
Feltham and Ohlson (1999) provide a general version of the accounting-based
valuation model that equates the market value of equity to book value plus the
risk-adjusted present value of expected abnormal earnings. The risk adjustments
consist of certainty-equivalent reductions of expected abnormal earnings.
Abnormal earnings are calculated after a capital charge measured on the period
opening book equity using the free rate. They show that the traditional
risk-adjusted expected cash flow model as a special case of their general model.
Schwartz and Moon (2000) apply real-options theory and capital-budgeting
techniques to valuing Internet companies. In their valuation approach, the
expected sales growth rate follows a mean-reverting process with a time-varying
drift. They argue that the value of an Internet stock may be rational if revenue
growth rates and their volatility are high enough. Ang and Liu (2001) specify
affine processes for selected accounting variables and derive a nonlinear relation
between market-to-book ratio on one side and interest rates, profitability, and
growth in book value on the other assuming the last three variables are stochastic.
Bakshi and Chen (2001) develop a stock valuation model using net
share, expected earnings bTfowth, and interest rate in which the expected earnings
growth rate follows a mean-reverting process. The pricing errors of their model
are highly persistent over time and correlated across stocks, suggesting the
existence of factors that are important in the market's valuation but missing from
the model. Cohen, Polk and Vuolteenaho (2002) conclude that future variation in
profits can explain 75 to 80 percent of the cross-sectional variation in
book-to-market ratios. Jung and Shiller (2002) show for US stocks that, cross sectionally,
the price-dividend ratio is a strong forecaster of the present value of future
dividend changes. Smithers and Wright (2004) make an interesting statement
reflecting on how the behaviour of the stock market does not seem to accord with
fundamental rational valuation, "Two fundamental, and perhaps disconcerting
questions, immediately occur when considering how to value stock markets. They
are "Why attempt to do it?" and "Can it be done?"
Some literature studies the relation between inflation, as an economic
fundamental, and stock prices. Wadhwani (1986) finds some evidence that
inflation impacts stock valuation negatively as it increases bankruptcy rates and
default premium. Sharpe (2002) finds that the negative relationship between
equity valuations and expected inflation is the result of a rise in expected inflation
coincides with both lower expected earnings growth and required real returns.9
Inflation impacts earnings, cost of borrowing, and cost of equity resulting in some
offsetting. Therefore, it is believed that inflation per se is unlikely to hold a major
part of the explanation for the severe ups and downs in stock market levels in the
recent history. That is because of its simultaneous impact across all valuation
factors, and because the 1990s onwards were associated with relatively low and
stable inflation levels. However, as a final point, high historic inflation memories
might have had a psychological impact on investors to expect high stock returns
despite the fall in inflation, which might have contributed to driving prices up
away from fundamentals.
Central to our first study in Chapter 3, it has been recognized that the
valuation of newly issued stocks can be difficult to explain using standard
valuation tools. Fama and French (2001) documented that, on average, more than
550 new companies were listed every year in the US stock market between 1980
and 2000 compared to less than 150 companies in the previous two decades. The
valuations of some of these new companies appear very high to accord with
reasonable assumptions about future profitability. 10
Ayrer, Upper, and Werner (2002) study behavioural differences of market
reaction to changes in fundamentals between new companies listed on Neuer
Market in Germany and old companies from DAX 100. They find that news
impact on stock prices of new and old stocks was asymmetric under different
market conditions. In up market, new stocks reacted more strongly to favourable
news than old stocks while no significant difference in reaction was found to
unfavourable news. In declining market, new stocks reacted more pronouncedly to
unfavourable news than old stocks while no significant difference in reaction was
found to favourable news. They argue that this was due to behavioural bias in
viewing both categories of stocks. Valuation asymmetry between new and
survivor stocks, along with the relation between valuation differences and market
condition, is the focus of our first study.
Investors are faced with major uncertainty about future profitability when
valuing newly listed companies. Pastor and Veronesi (2003), using annual US
data for the years 1963 through 2000, II argue that this uncertainty contributes to
the high valuations of these companies, and that learning about profitability in
calendar time resolves this uncertainty and tends to be associated by a decline in
the valuation ratios. So, valuations that appear excessively high initially are not
necessarily the result of investor irrationality. Their argument is broadly
consistent with Lewellen and Shanken (2002), who "emphasize that many tests of
market efficiency cannot distinguish between a market with learning and an
irrational market" .
The work of Pastor and Veronesi (2003) is the closest to our first study on
valuation bias and stock age. They develop a learning model for stock valuation
focusing on cash flow and modeling it using accounting information such as
earnings and book equity. However, they do not focus much on modelling risk
10 For example, more than I in 10 of all companies listed between 1962 and 2000 are traded at a
multiple of more than seven times their book value at the end of their year of listing, and almost 1 in 50 companies is traded at more than 20 times its book value.
and its impact on valuation as they deal with risk in fairly standard fashion; once
assuming a contact discount rate and then by using a stochastic discount rate.
Their model predicts MIS to decline with firm's age due to learning, the
predictions of their model are confirmed empirically. The idea of their model is
illustrated with the following simple mathematical exposition.
M
=
E{ exp[(g - r)T]}=
exp[(g + 0"2 12 - r)T] Bwhere B is the firm's book equity at time 0 and g is its constant growth rate of
book value growth from profitability. Thus, the book equity will be at time T:
B[exp(gT)], then they assume as competition eliminates abnormal earnings by T the market value at time T equals its grown book value, discounted to today's
value by the discount rate r. The expression to the right assumes that g is
unknown and normally distributed.
It is clear that MIS, in the above model, increases with the uncertainty about growth or profitability. They argue that the uncertainty declines over time due to
learning and as a result, younger firms have higher profitability or growth
volatility and hence higher M/B ratios holding average growth and discount rate
constant.
The model is formulated to use average profitability and its volatility in estimating
MIS, which led to model predictions that are confirmed by the empirical data.
This link between the high volatility of profitability and high valuation could be
circumstantial (spurious). Moreover, in their study, risk deferential between
younger and older stocks is not addressed, where first the discount rate was left as
constant and second modelled as a stochastic variable.
According to Pastor and Veronesi, there is an economic rationale for the higher
MIS of new stocks; that is rational learning. However, the long-standing evidence
on the long-tenn underperfonnance of IPOs would contradict their conclusion
[see on IPOs evidence, for example, Gompers and Lerner (2003) and Espenlaub,
Gregory and Tonks (2000)]. We show later that our evidence on new stocks and
age groups is consistent with the evidence of the IPOs systematic
underperformance.
Higher profitability volatility implies higher risk and should lead to lower
valuations. Despite their technically impressive work trying to rationalise the
address the possibility of bias driven by investor expectations about new stocks
that can be exaggerated due to the relatively limited knowledge about them.
Producing a model that can predict the patterns exhibited in the data is not
necessarily the answer. Some economic rationale or investment logic is still
needed to underlie the pattern of the declining M/B with age or it would be due to
behavioural bias.12
12 For further literature on learning see, for example, Jovanovich (1982), Timmerman (1993),
2.3 Behavioural Bias
The literature under Section 2.2 covers rational explanations of value by
fundamentals and rationalised processes such as learning or mean-reversion. The
1990s witnessed significant research in behavioural finance recognizing the
importance of psychology and sociology in finance. That followed the failure of
the efficient markets theory and its rational explanations, that dominated the
1970s, to justify stock market levels and its too many anomalies,13 including the
excessive volatility in the 1980s and 1990s and the 1987 crash where fundamental
values and explanations were rendered irrelevant. 14 Shiller (2002) emphasises that
the collaboration between finance and other social sciences that has become
known as behavioural finance has led to a profound deepening of our knowledge
of financial markets. Behavioural aspects are important to the explanation
especially that behavioural bias is involved in the valuation process in the stock
market as long as humans are involved. Below is a summary of relevant literature.
Psychologists Andreassen and Kraus (1988) showed that people tended to
behave as if they extrapolate past price changes. Smith, Suchanek and Williams
(1988) created experimental markets which generated bubbles that are consistent
with feedback trading.ls According to De Long, Shleifer, Summers and Waldman, (1990), combining feedback traders and smart money in one model, the smart
money tended to amplify, rather than diminish, the effect of feedback traders, by
buying in ahead of the feedback traders in anticipation of the price increases they
will cause. And in a related model, rational expected-utility-maximizing smart
money never choose to offset all of the effects of irrational investors because they
are rationally concerned about the risk generated by the irrational investors, and
do not want to assume the risk that completely offsetting these other investors
would entail. Marimon, Spear and Sunder (1993) showed experiments in which
13 Anomalies such as: Equity premium puzzle (realised equity premium is higher than can be
justified by standard efficient markets theories), and Size Effect (smaller firms producing higher returns), etc.
14 See Shiller (1982), (1989) and (1990) on market volatility.
repeating bubbles were generated if subjects were preconditioned by past
experience to fonn expectations of bubbles.
Lakonishok, Shleifer, and Vishny (1994) suggest that over-extrapolation
effect, a well known fonn of behavioural bias according to which investors tend to over-extrapolate past problems into the future, could be the reason behind the
low PIE effect, the finding that fonns an important support for investing in value
stocks being undervalued because of a behavioural bias.
Daniel, Hirshleifer, and Subrahmanyam (1998) propose a theory of
securities market under- and over-reaction based on two well-known
psychological biases. These are: (a) Investor overconfidence about the precision of private infonnation. They define an overconfident investor as one who
overestimates the precision of their private infonnation signal, but not of
infonnation signals publicly received by all. (b) Biased self-attribution, which
causes asymmetric shifts in investors' confidence as a function of their investment
outcomes.16 Their theory is based on investor overconfidence, and variations in
confidence arising from biased self-attribution. They made a reference in their
paper to evidence on security returns that has presented a sharp challenge to the
traditional view that securities are rationally priced reflecting all publicly
available infonnation. They state that, owing to biased self-attribution, those who
acquire wealth through successful investment may become more overconfident.
They have also shown that the psychological principle of biased self-attribution
can also promote feedback.
Scott, Stumpp, and Xu (1999) examine the consequences of behavioural
biases in the context of valuation theory. They provide empirical evidence
concerning the ability of an array of commonly used active strategies, such as
value and growth tilts, to exploit biases. They grouped behavioural biases into two
general categories: (a) overconfidence and (b) prospect theory. I? Overconfidence
16 Biased self-attribution, identified by psychologist Daryl Bem (1965), is a pattern of human behavior whereby individuals attribute events that confirm the validity of their actions to their own high ability, and attribute events that disconfirm their actions to bad luck or sabotage.
bias means, according to Daniel, Hirshleifer, and Subrahmanyam (1998), that
human beings develop, and stick, to stronger views than warranted by impartial
analysis of the data. It also suggests that investors adjust their expectations only slowly. Prospect theory posits, according to Kahneman and Tversky (1979) and
(1991), that utility depends on deviations from moving reference points rather
than on absolute levels of wealth or consumption. Prospect theory predicts that
investors will tend to gamble in losses (hold onto their positions) and be risk
averse in gains (move quickly to realise their gains). They find that biased
responses to news have larger impact on the stock prices of fast-growth
companies, and biased estimates of normalised earnings have a profound impact
on the stock prices of slow-growth companies but a relatively small impact on
those for fast-growth companies.
Goetzmann and Massa (1999) provides evidence that it is reasonable to
suppose that there are two distinct classes of investors: feedback traders who
follow trends and the smart money who move the other way.
Massa and Simonov (2002) investigate the way investors react to prior
gains and losses and familiarity bias. Familiarity bias means that investors tend to
invest in familiar stocks while ignoring the principles of portfolio theory. They
focus on the determinants of portfolio choice by testing and comparing different,
some are competing, behavioural theories, behavioural and rational explanations
to familiarity.18 (a) Behavioural theories: Loss aversion; that is prior losses
increase risk taking and vice versa for prior gains. House-money effect; prior
gains provide investors with a cushion that makes future losses less painful and
hence increase risk taking. Mental accounting or narrow framing; according to
which investors, in different categories of wealth, may react differently to gains
and losses depending on their categories. For more information, see for example
Odean (1998) and Shefrin and Statman (1985). (b) Behavioural and rational
hypotheses: Pure familiarity; the tendency to focus heavily on information that is
salient or is often mentioned rather than on information that is blended in the
background. Information-based familiarity; an alternative approach according to
which investors buy and hold stocks that they have enough information about.
They find that investors react to previous gains and losses according to
money effect. They find no evidence of mental accounting. With respect to stock
picking they provide evidence in favour of the information-based hypothesis.
Some research addresses over-reaction; another form of bias. For example,
DeBondt and Thaler (1985) find that subsequently to being classified as loser or
winner portfolios, loser portfolios outperform the market and winner portfolios
under-perform it, the empirical evidence that is consistent with overreaction
hypothesis. 19
It is worth noting that other research covered biased forecasts of earnings
or earnings growth being too optimistic (overestimates) which would affect the
market. See for example, DeBondt and Thaler (1990), Trueman (1990), Schipper
(1991), Francis and Philbrick (1993), Clayman and Schwartz (1994), Chan,
Karceski, and Lakonishok (2000), and Sougiannis and Yaehura (2001).
19 Lifetime Planning Concepts, P.C., financial advisors, (2003) as published on their website 18 December 2003 titled 'Behavioural Aspects of Investment Risk' discuss behavioural biases in the context of investment advice. They state that behavioural bias is as real as human nature. The more humans involved in the process, the more impact behavioural bias can have on investment decisions. The typical chain of investor, advisor and mutual fund or money manager make for a dangerous blend of emotions and bias. Here is a summary of the discussion.
a) Under-reaction: A Marriage of Over-confidence and Anchoring: They explain how investor expectations can to a large degree influence stock prices. Since investor expectations are formed by a set of information and a model to process the information, it is clear that errors can occur when either the model or the process of interpreting the model is flawed. As in most areas, the behavioural bias, acquired through life, affects investment decisions and frequently helps create mental mistakes. Investor bias tends to encourage them to over- or under-react to new information and as a result misprice the value of an investment. Under-reaction to new information generally comes from over-confidence or anchoring. At times investors place too much confidence in their existing information or knowledge and thus ignore new information. Examples of those include money managers who avoided the stock market in the US from 1994 through 1999 because they were confident the market was priced too high, i.e. the PIE ratio of 23 was overvalued. Anchoring is the process by which investors become tied to a previous view or opinion. Anchoring can apply to an individual stock, a market segment or the market as a whole. On individual stocks, investors tend to anchor to the expected earnings estimate or PIE level. When new information becomes available, those who under-react are often anchored to their previous viewpoint of the company. Applied to market segments or the total US market, anchoring keeps investors from seeing the change until it is obvious to everyone else. For example, in the 1980s, America was counted out; the perception of investors was that international investing was the place to make money. Even as America cleaned up its fiscal and monetary policies, the new information was ignored by those anchored to their opinions of America's labour, management, tax system, and debt structure.
2.4 Stock Market Levels
The eighties and the nineties witnessed excessive volatility in stock prices
which even went to the extreme of crashing in 1987 [see for example, Seyhun
(1990) and Siegel (1992) on the 1987 crash], and to the high levels of 1999
followed by the severe drop in stock prices up to 2002. Campbell and Shiller
(1988) find stock prices and returns are too volatile to accord with simple
present-value model. Shiller (1988) shows that there is substantial unexplained variation
in the log dividend-price ratio. Even for before the eighties, Shiller (1981) shows
that measures of stock price volatility are far too high to be attributed to
information about future real dividends. The stock market's pronounced volatility
triggered a large-scale search to explain stock market fluctuations and levels.2o
There are many competing explanations proposed in the literature for the
excessive volatility in stock prices. Some of those explanations reject the present
value model, some reject rational expectations, and some reject the assumption of
rational optimising agents.21
Consistent with efficient markets, is that stock price movements can be
rationalised by fluctuations in discount rates, which have not been correctly
modelled [Grossman and Shiller (1981), Mehra and Prescott (1985), Epstien and
Zin (1991)]. Cochrane (1994) and Fama and French (2001) argue that the high
equity prices were the result of a decline in the equity premium and in the rate at
which investors discount expected future real dividends. Consistent with rational
expectations, but not with the present value model, is the possibility of rational
bubbles in stock prices [West (1988), Flood (1990)], or that price movements may
be explained by market frictions [Weil (1989)]. In more recent articles on bubble
theory, Youssefmir, Huberman, and Hogg (1993) show that when speculative
trends dominate over fundamental beliefs, bubbles form, leading asset prices away
20 Bulkley and Harris (1997) test whether the documented excess volatility in stock prices in the
US Can be explained by excess volatility in earnings forecasts. They find no statistically significant correlation between analysts' forecast earnings growth over five years and realised growth and that earnings forecasts are over estimates. This supports their hypothesis of the failure of the market in forming rational expectations. They also fmd that the market earnings growth expectations and stock prices are positively correlated with analysts' forecasts, which means that analysts contributed to the excess volatility.
from their fundamental value making the system increasingly susceptible to any
exogenous shock, thus eventually leading to a crash, Brooks and Katsaris (2002)
state that periods where fundamental value was irrelevant, such as stock price
levels before 1929 and 1987 crashes, led researchers to look for factors beyond
fundamentals such as speculative bubbles that could explain the major deviations
from fundamentals?2
At the opposite extreme is the idea that irrational fads and fashions may
explain stock price fluctuations [Shiller (1989)].
In between these two extremes is the possibility that the market may price
stocks by the present value model but not insert into this model rational
expectations of future dividends. This in tum may be either because the true
dividend model is unknown and must be learnt over time [Bulkley and Tonks
(1989) and (1992), Barsky and DeLong (1993)] or because agents simply use
irrational and inappropriate mechanisms to forecast dividends, for example by
overreacting to current information [DeBondt and Thaler (1985)]. Others argue
that innovations in information technology have driven stock prices to historically
high levels in the 1990s [Hobijn and Jovanovic (2001)].
More recent research addressed overvaluation in stock prices explicitly.
Cole, Helwege, and Laster (1996) report that traditional market indicators have
pointed to an overvalued stock market in the 1990s in the US with record low
dividend yield and high market-to-book ratio. Though, the stock market has
performed well, which leads to question whether the behaviour of these indicators
has changed and they became invalid predictors of stock returns. They examined
the predictive power of these measures and find that equities tend to perform
poorly when dividend yields are low and market-to-book and price-earnings are
high and vice versa.
22 The literature on rational speculative bubbles to explain economically unjustified stock market
Campbell and Shiller (1998) believe that dividend-price and price-earnings
ratios have a special significance when compared with many other statistics that
might be used to forecast stock prices. They say "it seems reasonable to believe
that prices are not likely ever to drift too far from their normal relations to
indicators of fundamental value, such as dividends or earnings. Thus, one might
expect that when stock prices are very high relative to these indicators, as they are
in 1997, prices will fall in the future to bring the ratios back to more normal
historical levels." They show that since 1872 up to 1983 the dividend-price ratio
was fluctuating around its historical mean 4.73 percent and after 1983 the ratio
has been below its mean ever since. They find the denominator of the ratio (the
price) that brings the ratio back to its mean. They state that these ratios in 1997
are extraordinary bearish for the US stock market, and hence they find that US
equity market is extraordinarily overvalued. They predicted a substantial decline in stock prices and real stock returns close to zero over the next ten years (from
1997), which we have actually witnessed during 2000-2002.23
Heaton and Lucas (1999) analyse three broad categories of
fundamentals-based explanations for the stock price rise in late 1990s in the US. These are:
changes in corporate earnings growth, changes in consumer preferences, and
changes in stock-market participation patterns. Otherwise, a bubble is likely to be
the cause of the price rise. Using Gordon growth model, they find the value
obtained for expected growth is large in historical standards and unlikely to be the
sole explanation and it is unlikely that large shifts in the expected rate of return
have taken place to justify such stock price levels. They find that changes in the
fundamentals can account for perhaps half of the observed increase in
price-dividend ratio.24 They also conclude that changes in stock-market participation patterns over the last decade are unlikely to be a major part of the explanation.
Siegel (1999) suggests that higher value of equity might be stemming from
a fall in the required rate of return to equity from its historical average, because
new technologies in financial services have lowered transaction costs; and from
23 They relied on testing the level of each ratio against its historical average and they used some
regression analysis for their predication.