Principles in Patterns (PiP): Evaluation
WP7:37 Evaluation of systems pilot
Phase 2: User acceptance testing of Course and Class
Approval Online Pilot (C-CAP)
February 2012
Creator: George Macgregor, University of Strathclyde
Contents
Figures ... 3
Tables ... 4
1. Introduction ... 5
2. Methodology ... 7
2.1 Aims ... 7
2.2 Phase 1: C-CAP interface improvements for optimising data collection... 7
2.3 Participants ... 8
2.4 Procedure ... 9
Protocol analysis ... 9
Stimulated recall ... 10
Pre- and post-session questionnaire instruments ... 11
Procedure summary ... 11
2.5 Methodological restrictions and limitations ... 12
3. Results and discussion ... 13
3.1 Questionnaire instrument data ... 13
Pre-session questionnaire data ... 13
Post-session questionnaire data ... 14
3.2 Protocol analysis and stimulated recall data ... 17
4. Conclusion ... 28
5. References ... 30
6. Appendix A: Coding framework: Process and pedagogical issues (super-node) ... 33
7. Appendix B: Coding framework: System issues (super-node) ... 37
8. Appendix C: Node tree map ... 42
9. Appendix D: Evaluator log example ... 43
10. Appendix E: C-CAP system interface (evaluation system) ... 45
11. Appendix F: Pre-session questionnaire instrument in BOS ... 52
12. Appendix G: Post-session questionnaire instrument in BOS ... 57
Creator: George Macgregor, University of Strathclyde
Figures
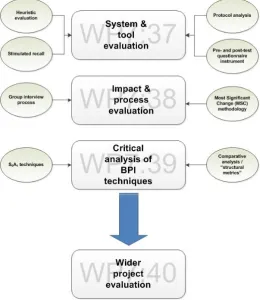
Figure 1: Overview of evaluative strands and evaluative sub-phases of PiP. ... 5
Figure 2: Screen capture data and transcribed audio as prepared for analysis in NVivo 9. ... 10
Figure 3: Comparative figure of SUS scores (by quartile), ARS and Bangor et al.'s [33] acceptability. ... 16
Figure 4: Predicted and actual ARS rating based on SUS score. ... 16
Figure 5: General word frequency query, including synonyms, diagrammed as a cloud. ... 18
Figure 6: Example of contextual help / guidance provided in section 4.1 (Activity and delivery) of C-CAP. ... 21
Figure 7: Inserting learning objectives in C-CAP. ... 24
Figure 8: Node tree map representing nodes from the coding framework. ... 42
Figure 9: Section 1.1 of C-CAP (Core Information). ... 45
Figure 10: Section 2 of the C-CAP system (Curriculum cohesion). ... 46
Figure 11: Section 3 of the C-CAP system (Education case). ... 47
Figure 12: Section 4 of the C-CAP system (Format, delivery and assessment). 1 of 2 screen shots. 48 Figure 13: Section 4 of the C-CAP system (continued). 2 of 2 screen shots. ... 49
Figure 14: Example of the expandable / collapsible help screens available within C-CAP. ... 49
Figure 15: Example of help / guidance detail available in expandable / collapsible help sections in C-CAP. ... 50
Figure 16: Section 5 of the C-CAP system (Syllabus and resources). ... 51
Figure 17: Pre-session questionnaire instrument, page 1. ... 52
Figure 18: Pre-session questionnaire instrument, page 2. Includes CSE instrument [30]. ... 53
Figure 19: Pre-session questionnaire instrument, page 2 continued. ... 54
Figure 20: Pre-session questionnaire instrument, page 4. ... 55
Figure 21: Pre-session questionnaire instrument, page 5. ... 56
Figure 22: Post-session questionnaire instrument, page 1. ... 57
Figure 23: Post-session questionnaire instrument (page 2), including SUS and ARS questions [32], [33]. ... 58
Creator: George Macgregor, University of Strathclyde
Tables
Table 1: Faculty and departmental affiliations of study participants. ... 9
Table 2: Computer Self Efficacy (CSE) results. ... 13
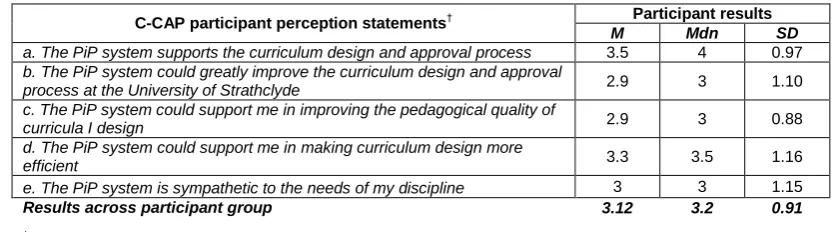
Table 3: Results for the participant perception statements on the current curriculum approval process. ... 14
Table 4: SUS scores per participant and group SUS results. ... 15
Table 5: Post-questionnaire instrument: C-CAP participant statements. ... 17
Table 6: General word frequency query, including synonyms. (Top ten only.) ... 17
Table 7: Coding framework for the super-node "Process and pedagogical issues" only. ... 33
Table 8: Coding framework for the super-node "System issues" only. ... 37
Creator: George Macgregor, University of Strathclyde
1. Introduction
The PiP Evaluation Plan [1] documents four distinct evaluative strands, the first of which entails an evaluation of the PiP system pilot (WP7:37 – Systems & tool evaluation) (Figure 1). Phase 1 of this evaluative strand focused on the heuristic evaluation of the PiP Course and Class Approval Online
Pilot system (C-CAP) and was completed in December 2011. A report documenting the principal
[image:5.595.167.428.189.490.2]findings is available from the PiP project website [2]. Phase 2 is the final phase of the system and tool evaluation (WP7:37) and forms the basis of this report.
Figure 1: Overview of evaluative strands and evaluative sub-phases of PiP.
Smith and Brown [3] and Lai [4] discuss the importance of technology facilitated approaches to design and approval for the purposes of improving pedagogy and, in Lai’s case, in increasing the portability and sharing of curricula within specific educational contexts. With the exception of PiP [5] and T-SPARC [6] - both funded under the JISC Institutional Approaches to Curriculum Design Programme [7] - very little is available in the literature to influence the development and evaluation of technology supported approaches to curriculum design and approval. Smith and Brown [3] and Lai [4] merely discuss the theoretical opportunities of technology supported curriculum design. PiP therefore represents a unique testbed with little academic research upon which to guide the evaluative approach adopted for such a project.
Creator: George Macgregor, University of Strathclyde
Creator: George Macgregor, University of Strathclyde
2. Methodology
2.1 Aims
The PiP Evaluation Plan details the wider objectives of the project evaluation [1]. The aim of this phase of the evaluation was to expose C-CAP to facets of HCI testing in order to validate aspects of phase 1 and evaluate C-CAP within in a real user context, including C-CAP’s ability to support academic participants in the design of curricula. The following broad research questions influenced the evaluative design:
1. The extent to which C-CAP functionality meets users’ expectations within specific curriculum design tasks
2. Assessing the performance of C-CAP in supporting the participants in curriculum design task and approval process and its potential for improving pedagogy
3. Eliciting data on current approval process and how C-CAP could contribute to improvements in the process (i.e. its fitness for purpose).
4. Measuring the overall usability of C-CAP (e.g. interface design and functionality instinctive, navigable, etc.) and capture data on users’ preferred system design/features
Details of the study participants are provided in section 2.3 and an overview of the procedure adopted in section 2.4.
Phase 1 of the evaluation formed an important basis for preparing the C-CAP system for phase 2. The following section (2.2) summarises the role of the heuristic evaluation in preparing for the user acceptance testing.
2.2 Phase 1: C-CAP interface improvements for optimising data collection
The use of heuristic evaluation in phase 1 was an integral part of ensuring C-CAP demonstrated a high degree of heuristic compliance prior to commencing phase 2. Heuristic compliance was considered imperative for two related reasons: minimising users’ extraneous cognitive load during user acceptance testing, and; optimising user acceptance testing data.
“Intrinsic cognitive load” pertains to the inherent difficulty of a task while “extraneous cognitive load” relates to the task presentation, which is normally controlled by the task designer [8]. If the intrinsic cognitive load of a task is high, and extraneous cognitive load is also high, then problem solving or task completion may fail to occur. Adjusting the presentation of the task to lower extraneous cognitive load can facilitate task completion or problem solving if such adjustments mean that the resulting total cognitive load falls within the mental resources of the user [9]. A prominent theme in recent HCI research therefore pertains to how best to minimise the extraneous cognitive load users often experience as a result of interface or system design. Poor system usability and design has been shown to increase users’ disorientation and cognitive load during system use [10–12]. As extraneous cognitive load increases so the cognitive resources available to the user to complete their primary task (e.g. locating information, interacting with a system to complete a work task, booking flights, etc.) decreases.
Creator: George Macgregor, University of Strathclyde
cognitive load (i.e. a system engaging academics in curriculum design) must therefore strive to minimise extraneous cognitive load if the system is support them in task completion. Given the frequent complexities and intellectual demands associated with the curriculum design process [16], any system has to ensure a high level of usability if it is to truly support and inspire academics in the curriculum design process. Failure to address the threat of extraneous cognitive load in this instance could potentially have resulted in poor task performance.
The above noted threat of extraneous cognitive load also has implications for the quality of data gathered during user acceptance testing. A system demonstrating high levels of extraneous cognitive load generally fails to engage the user with the primary task sufficiently [12]. The consequences for typical HCI testing is that user participants are therefore more likely to comment on trivial or superficial interface issues, or system errors that could easily be debugged prior to user exposure, rather than deeper system issues, or aspects of how the system supports them in the primary task (which, in this context, would be the curriculum design and approval process). A valid data collection environment is consequently not achieved and data can become skewed towards superficial system problems which are often not indicative of a system’s wider raison d'être.
Phase 1 (heuristic evaluation) was therefore used to optimise C-CAP and ergo the data collection environment, thus minimising the potential for extraneous cognitive load during user acceptance testing. Phase 1 detected 27 heuristic violations in the C-CAP system [2]. Of these violations, 67% (n = 18) were classified at a mean severity rating of ≤ 2.67, and of these 11% (n = 3) were classified at severity rating 1 (Cosmetic problem only). Only 33% (n = 9) were classified at a mean severity rating ≥ 3. Over 93% of all detected heuristic violations were resolved prior to commencing user acceptance testing, leading to numerous system and interface improvements. Unresolved violations were attributable to factors outside the control of the PiP team, e.g. University process issues or the limitations of InfoPath. Appendix E provides indicative screen dumps of the C-CAP system as deployed for this phase of the evaluation.
2.3 Participants
The evaluation participants were drawn from the academic departments of the University of Strathclyde. Early outreach and stakeholder activity meant that many participants were already familiar with PiP and its work; however, participants for this evaluative phase were recruited via faculty list emails (circulated on behalf of the evaluator by faculty managers) and an all-staff announcement via the Weekly Digest†. To be eligible participating academics were required to have experience of the curriculum design and approval process and to have been involved in the creation of new classes and/or courses in within last 2 years. In reality, almost all participants had been involved in either class or course design within the past 6 months. It was originally the intention of phase 2 to include faculty managers in the user acceptance testing; but since faculty managers only become involved with C-CAP to administer the approval process after curricula have been designed their involvement would amount to using a single interface screen. Faculty manager involvement was therefore considered unproductive at this stage and was deferred until WP7:38 when faculty piloting is scheduled to take place.
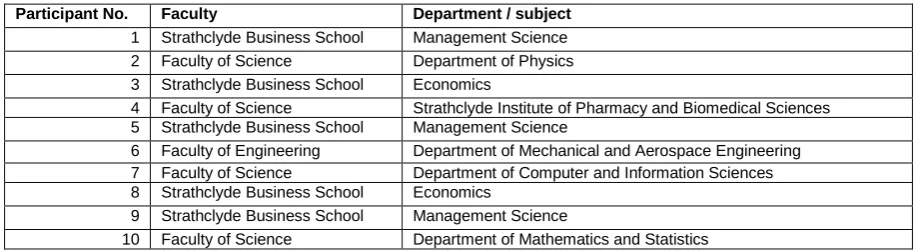
Ten academic participants agreed to participate in the study. Table 1 sets out participants’ faculty, departmental and discipline affiliations. Despite the small sample numbers, the group originated from a broad range of academic backgrounds, including physics, economics, mathematics and statistics
†
http://www.strath.ac.uk/weeklydigest/
Creator: George Macgregor, University of Strathclyde
[image:9.595.69.530.129.255.2]and biomedical sciences. Unfortunately no Humanities & Social Sciences (HaSS) faculty were recruited‡.
Table 1: Faculty and departmental affiliations of study participants.
Participant No. Faculty Department / subject
1 Strathclyde Business School Management Science 2 Faculty of Science Department of Physics 3 Strathclyde Business School Economics
4 Faculty of Science Strathclyde Institute of Pharmacy and Biomedical Sciences 5 Strathclyde Business School Management Science
6 Faculty of Engineering Department of Mechanical and Aerospace Engineering 7 Faculty of Science Department of Computer and Information Sciences 8 Strathclyde Business School Economics
9 Strathclyde Business School Management Science
10 Faculty of Science Department of Mathematics and Statistics
2.4 Procedure
The user acceptance testing sessions were designed to include four distinct sections: Pre-session questionnaire instrument, protocol analysis, stimulated recall, and a post-session questionnaire. Each session was circa 60 mins in duration, including ethical conditions (e.g. signing of consent form, explanation of research scope, etc). Data collection was conducted throughout January 2012 in a controlled IT lab setting.
The following sections detail the methods used and describes the overall procedure.
Protocol analysis
Protocol analysis (also known informally as the “think aloud protocol”) is a frequently deployed user testing methodology for software, interfaces, systems, etc. in which participants are asked to complete a series of tasks with the test/pilot system while simultaneously verbalising their thoughts. Verbalisations (or protocols) are sound recorded and transcribed for analysis. Additional data may also be gathered (e.g. screen captures, evaluator logs, etc). The methodology is considered to have a high level of face validity as the data captured tends to focus on the actual use of a system rather than on user judgements concerning its perceived usability or efficacy. Protocol analyses are based on direct participant observation and attempt to model users’ real world interaction with a system. As such, evaluators gain an insight into users’ cognitive processes as the methodology tends to expose a wide variety of user problems, assumptions or misconceptions, many of which would otherwise go undetected. Protocol analysis was originally formalised by Ericsson and Simon [17] and later van Someren et al. [18] and has since become a widely used technique in user testing studies in a wide variety of system contexts [19–27].
To best model a genuine curriculum design process and test the C-CAP system in supporting curriculum design and approval, participants were asked to bring a recently drafted curriculum design form with them to the session. Participants were then instructed to replicate their form using the C-CAP system while thinking aloud, recognising that the form structure in C-C-CAP was different and often more detailed than existing curriculum design forms. For example, C-CAP offers a more structured approach by using efficiency tools [28] to accelerate form completion (e.g. drop down lists, auto-calculation of teaching hours / assessment weightings, etc.) and imposes some basic principles of curriculum design theory (e.g. adherence to constructive alignment [29], greater consideration of learning activities, etc.). Participants were briefed on the process of thinking aloud, which was in line with established protocol analysis procedures [18], [24]. Screen capture software was used to record both participants’ C-CAP interface interaction (visual data) and to sound record their “think aloud”
‡
Creator: George Macgregor, University of Strathclyde
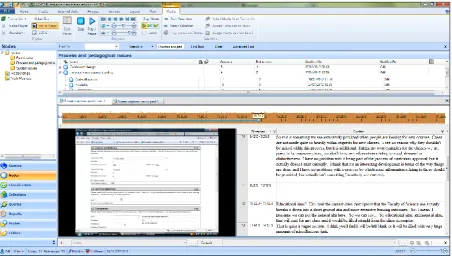
[image:10.595.74.527.139.395.2]protocols (audio data). Screen capture and associated audio data from the protocol analysis were uploaded into QSR NVivo 9 for content analysis, coding and further analysis (Figure 2). Data analysis was conducted according Holsti’s [17] methodologies for content analysis and van Someren et al.’s techniques for category creation [18]. NVivo 9 was also used for audio transcription.
Figure 2: Screen capture data and transcribed audio as prepared for analysis in NVivo 9.
Throughout the protocol analysis session evaluator logs were used to record “significant events” that occurred during participants’ interaction with the C-CAP system. “Significant events” can be defined as those moments where C-CAP was especially difficult for the participant to use or where C-CAP did not function as they expected (e.g. navigation was not located where the participant anticipated, C-CAP experienced a system error, participant experienced difficulty using the drop down menus for aligning assessment with learning objectives, etc.). The logs were created and maintained in MS Excel and included a time stamp and a brief description of the significant event (see example log in
Appendix D). The overall purpose of the log was to record any events which might otherwise go unnoticed through the protocol analysis or to mark significant events worthy of further exploration via stimulated recall.
Stimulated recall
The stimulated recall technique (or “retrospective think aloud”) is similar to protocol analysis but differs in that data are not collected until after the participant has completed their primary task [20], [24]. Often researchers use one or the other, normally owing to cost considerations; but research studies report on the benefits of both in identifying different HCI issues [28]. In stimulated recall a recorded screen capture of the participant’s system interactions is played back to the participant who is then asked to articulate their cognitive processes and actions at specific points of the recording. Stimulated recall is generally considered favourable because although the participant is asked to verbalise after they have completed the task, they are often able to provide more detailed verbalisations owing to reduced cognitive load.
Creator: George Macgregor, University of Strathclyde
interface [24]. Since participants in the user acceptance testing were engaging in the fictional but nonetheless cognitively onerous process of curriculum design with C-CAP, it was important that a brief stimulated recall phase be included in the testing session. Participants were only asked to engage in stimulated recall if significant events were logged during the “think aloud” curriculum design task. Stimulated recall would therefore focus the nature of those significant events and seek to tease out participants’ thinking at the relevant stage of the screen capture video.
Stimulated recall was conducted immediately after the collection of protocol analysis data in order to review participants’ system behaviour, thus teasing out potentially important data which may have been missed during protocol analysis. A total of six participants provided stimulated recall data. Stimulated recall data were sound recorded and uploaded to NVivo 9 for transcription and analysis alongside protocol analysis data.
Pre- and post-session questionnaire instruments
A pre-session questionnaire was administered prior to the commencement of the protocol analysis session in order to collect basic demographic information and capture participants’ IT efficacy. IT efficacy was measured using an adapted version of Murphy et al.’s [30] original Computer Self-Efficacy (CSE) scale, modified by Torkzadeh et al [31]. The instrument was also designed to elicit from participants their opinions and perceptions of the current curriculum approval process and its current issues.
The post-session questionnaire was administered after the completion of stimulated recall (if applicable). The post-session instrument was designed to capture data on users’ success with the system and gather definitive data on the aspects of the system that participants perceived most favourably and those they did not. This was based on a customised version of the standard System Usability Scale (SUS) post-test instrument, first proposed by Brooke [32] and subsequently developed, deployed and validated by other usability researchers (e.g.[33], [34], [35], [36]). Brooke’s instrument comprises a 10 item questionnaire using 5 point Likert scale response options. The post-session questionnaire also sought to capture perceptions of how C-CAP supported them in the curriculum design process and its potential for improving approval processes at the University of Strathclyde.
Both questionnaire instruments were administered using Bristol Online Surveys (BOS), an online survey tool [37]. Data from BOS was exported to a .csv file for analysis in MS Excel and in SPSS. The post-session instrument was also imported to NVivo 9 for analysis of open-ended question responses (i.e. Q.3).
Screen dumps of the questionnaire instruments as displayed in BOS are available in Appendices F
and G.
Procedure summary
To summarise, the following data collection methods were used in the following order:
1. Pre-session questionnaire
2. Protocol analysis using C-CAP (“think aloud” curriculum design task)
3. Stimulated recall (based on recording playback of “think aloud” curriculum design task using C-CAP).
4. Post-session questionnaire
Creator: George Macgregor, University of Strathclyde
2.5 Methodological restrictions and limitations
The methodological approach adopted for this phase of the evaluation was subject to a variety of restrictions which, in turn, constitute limitations to the present design. This phase of the evaluation was ideally suited to a repeated measure approach in which participants would be exposed to alternative versions of C-CAP, thus permitting statistical inferences to be made between treatments. Unfortunately the timetable for the PiP project precluded the use of an additional development phase between treatments. It is also worth noting that the participant recruitment restrictions would have rendered such an approach untenable even if the timetable for evaluation was favourable. The current approach is therefore a compromise, with a suite of data collection techniques administered instead in order to gather rich data about participant interactions with C-CAP.
Creator: George Macgregor, University of Strathclyde
3. Results and discussion
*3.1 Questionnaire instrument data
Owing to the detail of the qualitative data gathered during the user acceptance testing it is necessary to first summarise the findings from both the pre- and post-session questionnaire instruments.
Pre-session questionnaire data
Table 2: Computer Self Efficacy (CSE) results.
Computer Self Efficacy (CSE) scale - statements† Participant results
M Mdn SD
a. I feel confident calling up a data file to view on the monitor screen 4.9 5 0.32
b. I feel confident working on a personal computer or laptop 4.7 5 0.48
c. I feel confident getting software up and running 4.4 5 0.84
d. I feel confident using the user's guide when help is needed 4.9 5 0.32
e. I feel confident entering and saving data (numbers or words) into a file 4.9 5 0.32 f. I feel confident escaping / exiting from a program or software 4.9 5 0.32 g. I feel confident calling up a data file to view on the monitor screen 4.6 5 0.52 h. I feel confident understanding terms/words relating to computer hardware 4.6 5 0.52 i. I feel confident understanding terms/words relating to computer software 4.6 5 0.70
j. I feel confident handling a CD-R/DVD correctly 4.7 5 0.48
k. I feel confident learning to use a variety of software applications 4.8 5 0.42
l. I feel confident making selections from an on-screen menu 4.9 5 0.32
m. I feel confident copying an individual file 4.8 5 0.42
n. I feel confident adding and deleting information from a data file 4.9 5 0.32 o. I feel confident moving the cursor around the monitor screen 4.9 5 0.32 p. I feel confident using the computer to write a letter or essay 4.6 5 0.52
q. I feel confident seeking help for problems with my computer 4.8 5 0.42
r. I feel confident using the computer to organise information 4.6 5 0.70
s. I feel confident getting rid of files when they are no longer needed 4.9 5 0.32
t. I feel confident organising and managing files 4.4 5 0.84
u. I feel confident troubleshooting computer problems 4.8 5 0.42
v. I feel confident browsing the World Wide Web (WWW) 4.8 5 0.42
w. I feel confident surfing the World Wide Web (WWW) 4.7 5 0.48
x. I feel confident finding information on the World Wide Web (WWW) 4.9 5 0.32
Results across participant group 4.74 5 0.34
† CSE uses a 5-point Likert scale where 1 = I have very little confidence and 5 = I have a lot of confidence. Adapted version of Murphy et al.’s [30] original Computer Self-Efficacy (CSE) scale, modified by Torkzadeh et al [31].
Recall that the purpose of the pre-session questionnaire was to collect basic demographic information and was designed to capture data on participants’ IT efficacy and their perceptions of the current curriculum approval process. IT efficacy was measured using an adapted and modified version [31] of the CSE scale [30]. Internal consistency of the scales was tested using Cronbach’s alpha and demonstrated “excellent” reliability (= 0.952) [38]. Table 2 sets out the results of the CSE instrument used within the pre-session questionnaire. CSE results across the group revealed a high level of efficacy (M = 4.74; Mdn = 5). The ICT efficacy of participants was found to be very high across all CSE scale items, with little variation across the participant group (SD = 0.34). Such a high CSE score was anticipated given the academic composition of the participants.
Participants’ perceptions of the existing curriculum approval process is summarised in Table 3. With such ordinal data it is conventional to consider the median values, which were largely neutral in nature (Mub = 2.88; Mdnub = 3; SDub = 0.31). It should be noted that an unbalanced (ub) Likert scale
was used for this section owing to difficulties in positively wording those statements pertaining specific aspects of the curriculum approval process (i.e. I, j, k, l). Table 3 therefore separates positively and
*
Creator: George Macgregor, University of Strathclyde
reverse coded results. Balanced (b) results for the reverse coded results and balanced (b) results
across the entire participant group are also presented.
Scale reliability using Cronbach’s alpha was found to be high (= 0.862) and well above recognised reliability thresholds [38]. Balanced results across the participant group for all statements suggests a negative profile with general dissatisfaction with the current process (Mb = 2.68; Mdnb = 2.5; SDb =
0.55).
Examining the results for the positively coded statements separately reveals a negative profile for statements a – h with limited dispersion (M = 2.66; Mdn = 2.5; SD = 0.50). The profile of the reverse coded statements (i – l) almost mirrors the positively coded (M = 3.3; Mdn = 3.5; SD = 0.39). This can be verified by the balanced reverse coded results (Mb = 2.7; Mdnb = 2.5; SDb = 0.39). With the
exception of statement b - which only demonstrated moderate approval (M = 3.3; Mdn = 4; SD = 0.95) - it is interesting to note that no single mean response suggested outright satisfaction with the current curriculum approval process, with participants inclined to view the current process as onerous and stifling class/course design (k) (Mdnb = 4), or in needing improvements to render it more efficient (l)
[image:14.595.90.505.315.655.2](Mdnb = 4). This appears to be corroborated by statements c (Mdn = 2) and g (Mdn = 2).
Table 3: Results for the participant perception statements on the current curriculum approval process.
Current curriculum approval process: participant perception statements*
Participant results
M MDN SD
a. The curriculum approval process at the University of Strathclyde is an
efficient process 2.6 2.5 0.97
b. The curriculum approval process at the University of Strathclyde is simple
to understand 3.3 4 0.95
c. The curriculum approval process at the University of Strathclyde is a trivial
process 1.8 2 0.79
d. The curriculum approval process at the University of Strathclyde is a process that demonstrates a quick turnaround time (i.e. time from submission to final approval)
2.3 2.5 0.82
e. The curriculum approval process at the University of Strathclyde is an
effective process 3.1 3 0.74
f. The curriculum approval process at the University of Strathclyde is a
process that is easy to manage 3.1 3 0.88
g. The curriculum approval process at the University of Strathclyde is a process that is well placed to respond to the demands from industry and the employment market
2.4 2 0.84
h. The curriculum approval process at the University of Strathclyde is a
process that ensures quality teaching is delivered 2.7 2.5 1.06
Positively coded results 2.66 2.5 0.50
i. The curriculum approval process at the University of Strathclyde is a
process requiring too many decisions by other people 2.9 (3.1) 3 0.88
j. The curriculum approval process at the University of Strathclyde is a
convoluted process 3.1 (2.9) 3 0.74
k. The curriculum approval process at the University of Strathclyde is
onerous and stifles innovation in course/module design 3.4 (2.6) 4 (2) 1.07 l. The curriculum approval process at the University of Strathclyde is a
process requiring improvements to enhance efficiency 3.8 (2.2) 4 (2) 0.63
Reverse coded results 3.3 3.5 0.39
Reverse coded results (b = balanced)
†
2.7 2.5 0.39
Results across participant group (ub = unbalanced) 2.88 3 0.31
Results across participant group (b = balanced)
†
2.68 2.5 0.55
*Curriculum approval process perception statements use a 5-point Likert scale where 1 = Strongly disagree and 5 = Strongly agree. Note that statements I, j, k, and I were reverse coded.
†
Reverse coded results balanced: reverse score(x) = max(x) + 1 - x
Post-session questionnaire data
Creator: George Macgregor, University of Strathclyde
included an adjustment to item 8, supplanting the word “cumbersome” for “awkward”, as per the findings of Finstad [35] and research of Bangor et al. [33].
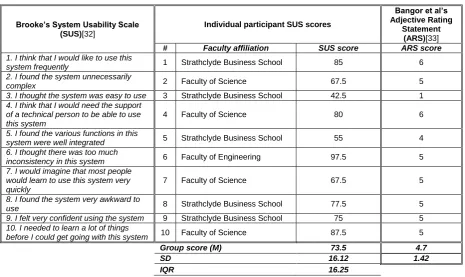
[image:15.595.66.532.242.519.2]The results from the SUS are presented in Table 4 as are the individual SUS scores for each participant. SUS scores are calculated as follows: odd numbered items in the SUS are scored as the item score minus 1 and even items are scored as 5 minus the item score. This balances all scores and permits zeroes at the bottom of the range. The sum of the scores is then multiplied by 2.5. The resulting SUS score has a range of 0 to 100. The higher the SUS score, the easier a user feels it is to operate a system (i.e. C-CAP). SUS scores for individual items are included in Table 4 but are not in themselves meaningful; SUS produces a single value representing a combined measure of the overall usability of the system being studied.
Table 4: SUS scores per participant and group SUS results.
Brooke’s System Usability Scale (SUS)[32]
Individual participant SUS scores
Bangor et al’s Adjective Rating
Statement (ARS)[33]
# Faculty affiliation SUS score ARS score
1. I think that I would like to use this
system frequently 1 Strathclyde Business School 85 6
2. I found the system unnecessarily
complex 2 Faculty of Science 67.5 5
3. I thought the system was easy to use 3 Strathclyde Business School 42.5 1
4. I think that I would need the support of a technical person to be able to use this system
4 Faculty of Science 80 6
5. I found the various functions in this
system were well integrated 5 Strathclyde Business School 55 4
6. I thought there was too much
inconsistency in this system 6 Faculty of Engineering 97.5 5
7. I would imagine that most people would learn to use this system very quickly
7 Faculty of Science 67.5 5
8. I found the system very awkward to
use 8 Strathclyde Business School 77.5 5
9. I felt very confident using the system 9 Strathclyde Business School 75 5
10. I needed to learn a lot of things
before I could get going with this system 10 Faculty of Science 87.5 5
Group score (M) 73.5 4.7
SD 16.12 1.42
IQR 16.25
Creator: George Macgregor, University of Strathclyde
Figure 3: Comparative figure of SUS scores (by quartile), ARS and Bangor et al.'s [33] acceptability.
The post-session questionnaire yielded a mean ARS rating of 4.7 (M = 4.7; SD = 1.42), placing C-CAP within the “Good” ARS user-friendless category. Again, the ARS score increases and demonstrates less dispersion when outlying data are removed (M = 5.1; SD = 0.6). The mean ARS rating is consistent with Bangor et al.’s [33] validation of ARS with SUS and maps perfectly to Bangor et al.’s [33] SUS score guide and acceptability ranges (see Figure 3). Regression analysis appears to support the overall assertion that SUS scores predict ARS ratings in this instance (R2= 0.61, F1,8 =
12.419, p < 0.01). It is nevertheless interesting to note that the SUS scores for participants #6 (SUS = 97.5; ARS = 5) and #10 (SUS = 87.5; ARS = 5) do not map comfortably to these acceptability ranges. This is borne out by the associated chart (Figure 4). For example, the SUS score for participant #6 was exceptionally high (SUS = 97.5) inferring an associated ARS score of 7 (“Best imaginable”; predicted ARS = 6.34); yet this participant represented a statistical anomaly by assigning an ARS score of 5 (“Good”). The lack of synergy between the SUS and ARS scores of participant #10 is less severe (SUS = 87.5; ARS = 5). Bangor et al.’s data is based on a far larger participant group (n = 212) which reveals levels of data variability not dissimilar to those presented in Table 4. It could be suggested that within a larger group the individual results of participants #6 and #10 would appear less anomalous. Such an anomaly in this case could therefore be attributable to the small participant numbers and the consequent lack of predictive power [39]. It should nevertheless be remembered that the overall SUS score for the participant group maps comfortably to Bangor et al.’s anticipated ARS rating and acceptability range. This places C-CAP within the 3rd quartile. It is possible that the perceived “goodness” of C-CAP is partly attributable to the high computer efficacy of the participant group, as demonstrated by a group CSE score of > 4.7.
Figure 4: Predicted and actual ARS rating based on SUS score.
Recall that the post-session questionnaire also sought to capture perceptions of how C-CAP supported them in the curriculum design process and its potential for improving approval processes at the University of Strathclyde. Table 5 sets out the results for this section of the questionnaire instrument. Although positive values can be observed for statement a (M = 3.5; Mdn = 4; SD = 0.97),
0 1 2 3 4 5 6 7
0 20 40 60 80 100 120
A
RS
SUS Score
[image:16.595.138.462.493.663.2]Creator: George Macgregor, University of Strathclyde
[image:17.595.87.507.182.298.2]the overall results for this section were neutral (M = 3.12; Mdn = 3.2; SD = 0.91). The relatively high standard deviation reveals a high level of variation between participant responses, three of which were > 1. Such variability in the perceived potential of C-CAP to support participants in curriculum design and improve the approval process was a general theme that emerged from the protocol analysis and stimulated recall data, and appears to reinforce a dichotomy that emerged between participants’ acceptance of the system and their understanding of the approval process.
Table 5: Post-questionnaire instrument: C-CAP participant statements.
C-CAP participant perception statements† Participant results
M Mdn SD
a. The PiP system supports the curriculum design and approval process 3.5 4 0.97 b. The PiP system could greatly improve the curriculum design and approval
process at the University of Strathclyde 2.9 3 1.10
c. The PiP system could support me in improving the pedagogical quality of
curricula I design 2.9 3 0.88
d. The PiP system could support me in making curriculum design more
efficient 3.3 3.5 1.16
e. The PiP system is sympathetic to the needs of my discipline 3 3 1.15
Results across participant group 3.12 3.2 0.91
†
C-CAP participant perception statements use a 5-point Likert scale where 1 = Strongly disagree and 5 = Strongly agree.
3.2 Protocol analysis and stimulated recall data
Analysis of the qualitative data captured by the “think aloud” protocols, stimulated recall and open-ended questionnaire item (Q.3 of the post-session questionnaire) generated a detailed hierarchical coding framework (see Appendices A and B). This framework directed further querying of the data. Two super-nodes emerged from the data: system issues, and; process and pedagogical issues. These super-nodes contained 32 and 18 sub-nodes respectively and reflected the nature of the user acceptance evaluation, which was deliberately designed to elicit data on the extent to which C-CAP could support participants in the curriculum design and approval process. It was also designed to expose system and usability issues which were not identified during the heuristic evaluation (Phase 1). Interestingly, the qualitative data exposes among participants a dichotomy between the system and the curriculum design and approval process. This dichotomy will be explored in more detail later in this report.
Table 6: General word frequency query, including synonyms. (Top ten only.)
Word Length Count Weighted Percentage (%) Similar Words
class 5 246 2.43 categories, category, class, classes, courses,
forms, sorts, years
think 5 159 1.26
believe, consider, considered, guess, guessed, guessing, imagine, intended, means, reason, reasonably, recall, remember, remembering, suppose, supposed, think, thinking, thought
assessment 10 112 1.18 assess, assessed, assessment, assessments,
evaluated, evaluation, value, values
learning 8 144 1.15
checking, determine, knowledge, knows, learn, learning, reading, readings, scholarships, seeing, study, teach, teaching
students 8 63 0.69 student, students
hours 5 59 0.59 hours, minutes
objectives 10 54 0.59 objective, objectives
should 6 51 0.56 should
number 6 82 0.52
[image:17.595.71.528.526.731.2]amount, amounts, comes, coming, counts, figure, figures, issue, issued, issues, listing, lists, number, numbers, numerical, routinely, total
activity 8 49 0.51 activities, activity, dynamic, dynamics,
Creator: George Macgregor, University of Strathclyde
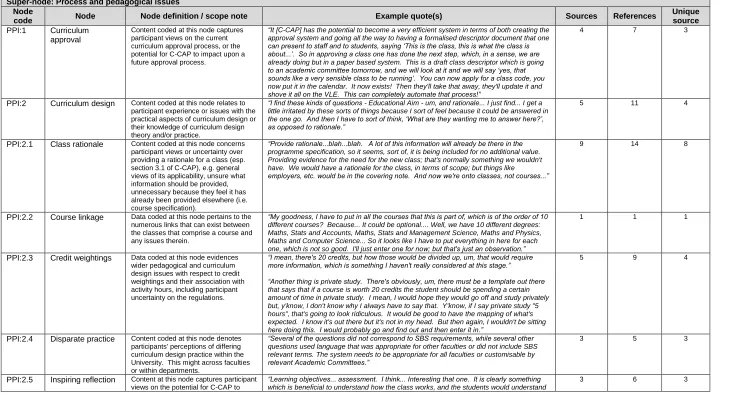
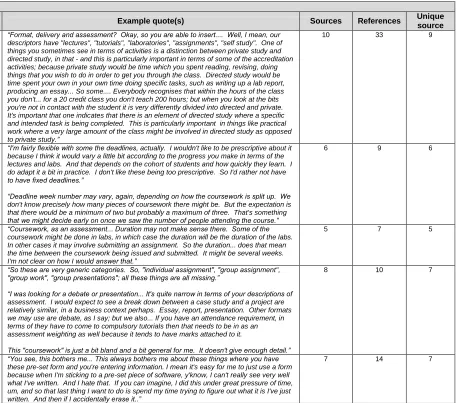
Appendices A and B present the coding frameworks for the super-nodes. These frameworks detail all sub-nodes, node codes (to indicate hierarchical level), node definitions and indicative supporting quote(s). Columns for data references are also provided using the following definitions:
Sources: Sources refers to the number of individual data sources (e.g. protocol analysis data, stimulated recall data, open-ended questionnaire responses) within which data has been coded at the associated node.
References: References is a count of the number of selections within the source(s) that have been coded at a particular node.
Unique sources: A unique source refers to the number of unique participants whose data has been associated with a particular node. Since most participants are associated with two or more data sources (e.g. protocol analysis data, stimulated recall data, open-ended questionnaire responses) and since multiple references to the same node may exist within any given source, a unique source count provides a means of determining how many participants have referred to particular node in their data.
For example, Class rationale (PPI:2.1 – Appendix A) has 9 sources, 14 references and 8 unique sources. This means that there exists 9 sources (likely a mixture of protocol analysis and stimulated recall data) within which 14 references to the node PPI:2.1 have been made. However, a unique source figure of 8 indicates that one participant has in fact referred to this node twice: once during protocol analysis and once during stimulated recall.
Figure 5: General word frequency query, including synonyms, diagrammed as a cloud.
A tree map diagramming the hierarchical nodes within the coding framework is provided in Appendix C. The result of a general word frequency query (with synonyms) is provided in Table 6 and is diagrammed as a cloud in Figure 5. These tend to reflect those aspects of the curriculum design process that participants found most difficult during the sessions (e.g. the design assessments and aligning them to stated learning objectives and/or outcomes, participant uncertainty over the credit-to-hours mappings used, etc.). Some of these issues will be revisited when the process and
pedagogical issues super-node is discussed later in this section.
Creator: George Macgregor, University of Strathclyde
Although comprising 32 sub-nodes, the system issues framework primarily captures those C-CAP system issues that evaded exposure via the heuristic evaluation. Many of the nodes therefore address specific C-CAP functionality or system issues (e.g. System navigation [SI:2.9] or Form
submission errors [SI:5.2]) or capture user requirement issues necessitating further investigation (e.g.
Dummy codes [SI:2.3]). The process and pedagogical issues super-node comprises fewer
sub-nodes, although some capture broader issues which are less conducive to enumeration. The nodes are too numerous and many are too trivial to discuss in detail here; for example, to facilitate the resolution of many interface or systems focused issues a table was derived from the protocol analysis data to assist in their prioritisation (see example in Appendix H). This table followed a format similar to the heuristic evaluation in phase 1 [2] and adopted a severity ratings system [28]. Suffice to state that the coding framework and its nodes will direct future C-CAP development work (to be completed prior to departmental / faculty piloting). We therefore restrict ourselves to further discussion of those nodes of substantive value.
Analysis of the data exposed participants’ overall perception of the C-CAP system (C-CAP
perceptions [SI:2]). C-CAP perceptions were generally positive, triangulating the positive SUS score
from the post-session questionnaire instrument. Some participants frequently made positive comments throughout their interaction with the C-CAP system, with participants #9, #6 and #10 providing indicative comments:
It's actually very easy to use, in terms of development. It's quite intuitive. Ahhhh, much better... […] Generally the system is quite intuitive to use, so it's easy, it's straightforward.
(Participant #9)
So... read the information at the start is the first thing to do! It seems you can edit, which is
quite useful. And there's help information as we go along. Good. (Participant #6)
Lectures. Okay, so, this is lectures in hours, of which there are 48. But I guess we're going to have 24 lectures at 2 hours. Oh, it even does the maths for me! Splendid! (Participant #10)
Some participants also commented in more detail on why their perceptions of C-CAP were generally positive. These more detailed comments often emerged from stimulated recall when the participant had an opportunity to reflect on their interactions with C-CAP. These comments were often more holistic insofar as they also considered the potential of C-CAP to improve the curriculum approval process. Said participant #4, for example:
It [C-CAP] has the potential to become a very efficient system in terms of both creating the approval system and going all the way to having a formalised descriptor document that one can present to staff and to students, saying "This is the class, this is what the class is about...". So in approving a class one has done the next step. Which, in a sense, we are already doing but in a paper based system. This is a draft class descriptor which is going to an academic committee tomorrow, and we will look at it and we will say "yes, that sounds like a very sensible class to be running". You can now apply for a class code, you now put it in the calendar. It now exists! Then they'll take that away, they'll update it and shove it all on the VLE. This can completely automate that process!
However, the data also exposed participant hostility to the use of any system to aid the curriculum design and approval process. Participant #3 was perhaps most vocal in their disdain for the C-CAP system; and it should be noted that such fierce critiques were confined to this participant. The following illustrative quote from participant #3 was motivated by a C-CAP form submission error:
Creator: George Macgregor, University of Strathclyde
because when I'm sticking to a pre-set piece of software, y'know, I can't really see very well what I've written. And I hate that. If you can imagine, I did this under great pressure of time, um, and so that last thing I want to do is spend my time trying to figure out what it is I've just written. And then if I accidentally erase it...
The aspect of C-CAP that perhaps inspired most comment from participants related to their experiences while using C-CAP to complete learning activity and assessment details. Sections 4.1 (Activity and delivery) and 4.3 (Assessment) require users to indicate the nature of the intended learning and assessment activities for the proposed class. Both sections were driven by drop down menus to promote efficiency in use and to minimise user error [28]. A notes box was also provided in section 4.3 to allow users to insert additional comments about their intended assessment activities. Although the values for these drop down menus mapped to the QAA’s indicative learning and teaching methods list [40], almost all participants commented on the appropriateness of these values for their particular discipline and suggested alternatives (coded at Option values [SI:1.3] and Learning activity options [SI:4.2]). For example:
So these are very generic categories. So, "individual assignment", "group assignment", "group work", "group presentations"; all these things are all missing. (Participant #5)
I was looking for a debate or presentation... It's quite narrow in terms of your descriptions of assessment. I would expect to see a break down between… A case study and a project are relatively similar, in a business context perhaps. Essay, report, presentation. Other formats we may use are debate, as I say; but we also... If you have an attendance requirement, in terms of they have to come to compulsory tutorials then that needs to be in as an assessment
weighting as well because it tends to have marks attached to it. (Participant #9)
In total 21 different learning activity types and 16 different assessment activity types† were proposed by participants during the sessions. Data querying suggests that those participants proposing alternative learning or assessment activities were from outside the Faculty of Science and – although their proposed learning and assessment activities could be captured by the list and notes field – there was a perception that the values failed to reflect the “non-standard” teaching delivery methods or assessment techniques used by these faculties. Think aloud protocols from the following Strathclyde Business School participant were typical in this respect:
We've got labs, we've got tutorials, we've group activities, activity sessions, there's... It is, in essence... Everyone does lectures. We don't really have placements. Practicals? We don't do practicals - that's an Engineering view of the world. Fieldwork? Some courses do in the Business School, but not that many. That's more for HASS faculty staff. So, this should be a
lot more extensive. (Participant #5)
In other instances data suggest that the issue was primarily terminological. For example, some participants would not make the conceptual link between specific learning activities, such as a lab, and its practical nature (“Practical” – list value):
Right, okay, for the activity, actually, we’ve got a lecture, and also we have, from, erm, tutorial, which incorporate a lab as well. But, actually, but I cannot find this [lab] option for me;
it doesn't provide other types of class session. (Participant #1)
Lecture, Tutorial, Seminar, Computer lab, Group work, Activity session, Group work, Group activities, Assignment, Individual reading, Interactive discussion, Class test, Site visit, Laboratory, Project work, Crit, Private study, Field work, Placement, Workshop, Presentation, Self-study
† Examination, Coursework, Class test, Lab books, Individual assignment, Group assignment, Group work, Group presentations, Debate, Presentation, Essay, Report,
Creator: George Macgregor, University of Strathclyde
I would call them "computer labs". It doesn't really fit anywhere under those topics there. I would like to have "computer lab" added to the list of activities. Can I add it in manually? In that case, I will call my computer lab a "practical". (Participant #6)
Others were also influenced in their suggestions by the way in which they perceived their teaching practice to differ from prevailing practice. In some instances this even called into question the legitimacy of the term “lecture” to describe a delivery method where an academic introduces ideas or delivers facts to a large group of students:
[image:21.595.151.448.247.581.2]Probably I would put in there "Interactive discussion"; because when I lecture it's more a seminar than a lecture. Students come back and the pre-set lecture format often disappears. I am often sure I impart the analytical material I need to but students will ask questions... There's leeway. I would maybe put in a "Seminar", or something like that too. (Participant #3)
Figure 6: Example of contextual help / guidance provided in section 4.1 (Activity and delivery) of C-CAP.
Creator: George Macgregor, University of Strathclyde
render sections of C-CAP unusable. Data derived from the list would also lack the specificity required for institutional reporting and wider curriculum management.
Aspects of section 4.3 (Assessment) that caused further confusion for many participants (n = 6) pertained to assessment deadline. The collection of such data is intended to encourage curriculum designers and course leaders to consider cohort assessment load during semesters. Many participants considered the collection of such information to be undesirable:
Again, the coursework would be issued across the entire duration of the semester, so there would be no specific deadline week. Y'know, it could be weeks three, five, seven, nine - so
specifying the deadline week number doesn't help. (Participant #2)
Or they considered it be unfeasible, because assessment activities and their deadlines are often only decided immediately prior to class delivery:
Deadline week numbers may vary, again, depending on how the coursework is split up. We don't know precisely how many pieces of coursework there might be. But the expectation is that there would be a minimum of two but probably a maximum of three. That's something that we might decide early on once we saw the number of people attending the course.
(Participant #7)
Others were more circumspect for reasons of teaching flexibility:
I'm fairly flexible with some the deadlines, actually. I wouldn't like to be prescriptive about it because I think it would vary a little bit according to the progress you make in terms of the lectures and labs. And that depends on the cohort of students and how quickly they learn. I do adapt it a bit in practice. I don't like these being too prescriptive. So I'd rather not have to
have fixed deadlines. (Participant #6)
Negative comments about these information requirements in C-CAP were a component of broader data themes pertaining to flexibility in teaching practice (coded at Flexibility [PPI:3.2]) and the perceived pointlessness of some curriculum design requirements in C-CAP (coded at Form
requirements [SI:2.4] and [SI:2.10] Unnecessary information). Many participants reported their
unease with drafting overly prescriptive curricula which might in future restrict their teaching practice and lead to further bureaucracy, whilst others felt it was disingenuous to provide prescription so far in advance of teaching delivery. The following protocol excerpts illustrate these varying participant viewpoints:
I want to just say there are four classes that take place this week, this week, that week. You know? It's almost as if there's too much information being asked in this. Some of this information should be given to the students by the department when they are delivering the
class, rather than going in... making up the approval form. (Participant #2)
Assessment description… Hmmmm… A general point here... The more detail we have to put in here in terms of the assessment, the more it becomes necessary to update this every year. Because, typically, you'd have maybe different assessments. That means modifying all these forms. So I'm not convinced a highly specified description of the assessment and when
it's due is a good idea. It means more work and having to update it more regularly.
(Participant #6)
Creator: George Macgregor, University of Strathclyde
coursework, which is defined by the type of assessment. I'm not sure at the stage people are planning classes they would know enough about the structure of the class to be able to say, "Oh we're going to have a deadline in week 6 or 7". That, to me, is not relevant. (Participant #4)
Finding a balance between the needs of the University (and ergo C-CAP) to improve pedagogy (e.g. promote more ‘high impact’ learning activities, greater alignment of assessment with stated learning objectives, etc.) and the information requirements of the centre (e.g. timetabling, estates management, library, procurement, etc.) on the one hand, and what academics are prepared to tolerate during curriculum design on the other, is clearly an area that requires further investigation by PiP. The curriculum descriptor structure and information requirements within C-CAP were derived from a number of extant forms used within the University and modelled the stated information requirements of key stakeholders (e.g. Educational Strategy Committee [42], Student Experience & Enhancement Services Directorate (SEES) [43], etc.). Restructuring of the forms in C-CAP and Phase 1 of the evaluation helped to rationalise the information demanded from users. Usability engineering techniques (such as heuristic evaluation) promote the use of efficiency tools to accelerate the speed with which users can complete tasks [28]; and it is possible that C-CAP requires further refinement in this respect in order to make the collection of such information less onerous for users. The role curriculum information can perform in improving the operational efficacy of the University was not fully recognised by several of the participants. Only those participants with administrative experience at higher academic levels (e.g. HoD) appreciated the significance of such information gathering by C-CAP. It is therefore possible that groups such as the Educational Strategy Committee need to better communicate the importance of such information for institutional monitoring, portfolio management and resource planning.
The process and pedagogical issues super-node contains 18 sub-nodes. The PiP project focuses on
the potential of C-CAP to improve curriculum approval processes; but it is also within the remit of the project to explore the role C-CAP can perform in delivering new paths through which the University's range of policies and best practice guidelines on curriculum design can be brought to the fore in the minds of designers. Curriculum design represents a key “teachable moment” that is rarely exploited [44]. Indeed, it is often one of the few opportunities to influence the quality of the curricula that will eventually be delivered. One aspect of curriculum design that dominates educational literature is the idea of constructive alignment [29], [45], [46]; optimising assessments to best measure student learning against the stated learning objectives. The version of C-CAP used for the user acceptance evaluation therefore required participants to engage in constructive alignment (i.e. explicitly stating which assessments will assess which learning objectives); however, few participants viewed this requirement favourably. Data coded at Aligning learning outcomes [PPI:2.6.1] indicated that the majority of academics either considered their learning objectives to be assessed by all stated assessments, or felt it was irrelevant to include such detail as it can be highly ephemeral. For example:
So what do we mean by learning objectives assessment? It's actually all of them! Yeah,
because I think it needs to reflect all objectives not just some. (Participant #1)
For most of our classes the examination and coursework are essentially going to assess all of these things. So do I have to click four times to put them all in? It would be nice to have them altogether, I think. Because the exam is essentially going to assess the whole course...
(Participant #10)
It's not possible to pre-determine which learning objectives would be assessed by coursework. Because this may change from year to year… We don't pre-determine that. It's unlikely it would be all the learning objectives but I couldn't say in advance which it would be.
Creator: George Macgregor, University of Strathclyde
The process of aligning assessments with learning objectives in C-CAP was driven by inserting a new objective and then selecting from a drop down menu the objective which was to be aligned (Figure 6). There were indications from the protocol data
and the screen capture videos that the hostility towards aligning learning objectives was occasionally motivated by the awkwardness and tediousness of the alignment process in C-CAP:
And again, the examination is designed to assess all the learning outcomes, so I don't think that it's a helpful... well,
from my point of view, it's a not a helpful thing. There should be a box that says "All". And
that way you don't have to enter all five. (Participant #2)
There is unnecessary repetition of clicking to add, e.g. learning outcomes to assessment…
(Participant #9)
It is possible that this aspect of C-CAP exerted higher levels of extraneous cognitive load on the participant, which in turn forced many to abandon the process of alignment altogether to seek interface options that would facilitate an “all objectives” solution. It is also possible that the artificial nature of the curriculum design task limited participants’ potential for creativity in this instance. Participants were replicating existing designs in C-CAP and although many had not explicitly aligned assessments with learning objectives in their original designs, many attended the testing session with the majority of their creative work essentially completed. These participants may therefore have felt disinclined to use C-CAP’s functionality in this respect. General participant antipathy towards rigorous adherence to standard curriculum design principles cannot be discounted either.
Neither did mandating constructive alignment appear to support C-CAP’s ability to promote greater reflection of assessment strategy [Inspiring reflection [PPI:2.5] AND Aligning learning outcomes
[PPI:2.6.1]). Querying of the data indicates that only one participant considered C-CAP to inspire reflection during constructive alignment. This participant had experience of HoD responsibilities and was appreciative of C-CAP’s ambitions in this respect; but even this participant recognised the difficulties in implementing such a system more widely:
Learning objectives... assessment. I think... Interesting that one. It is clearly something which is beneficial to understand how the class works, and the students would better understand the linkage between what the class is meant to achieve and the assessment, but it's not something we routinely list. It is an additional and new idea. It [C-CAP] would force people to think a bit harder about their assessments and their learning objectives. I can see it being met with some... Hmmmm... worry, shall we say! Or people will simply say "all learning
outcomes" and it will degenerate into an uninformative piece of information. (Participant #4)
The data presented in Table 5 suggested that participants were generally positive about the potential of C-CAP to support them in curriculum design (M = 3.5; Mdn = 4; SD = 0.97) but were generally indifferent about the potential of C-CAP to improve their pedagogy or the quality of the curricula they design. Whilst some (like participant #4 above) could appreciate the potential of C-CAP in improving aspects of curriculum design or its potential to improve the departmental efficiency, data querying
(Curriculum approval [PPI:1] AND C-CAP perceptions [SI:2]) appears to corroborate participants’
indifference, with only two participants commenting, one positively and one negatively. Participant #9 was positive about a relatively superficial aspect of the C-CAP system (i.e. form design) rather than the system itself:
I like this one, "Justify the need for the new course...", which is good. That first box makes you go through... makes you think clearly, erm, why the class is there in the first place [..]

![Figure 3: Comparative figure of SUS scores (by quartile), ARS and Bangor et al.'s [33] acceptability](https://thumb-us.123doks.com/thumbv2/123dok_us/1676764.121108/16.595.138.462.493.663/figure-comparative-figure-sus-scores-quartile-bangor-acceptability.webp)