RESEARCH ARTICLE
10.1002/2014GC005529
Understanding which parameters control shallow ascent of
silicic effusive magma
Mark E. Thomas1and Jurgen W. Neuberg1
1Institute of Geophysics and Tectonics, School of Earth and Environment, University of Leeds, Leeds, UK
Abstract
The estimation of the magma ascent rate is key to predicting volcanic activity and relies on the understanding of how strongly the ascent rate is controlled by different magmatic parameters. Linking potential changes of such parameters to monitoring data is an essential step to be able to use these data as a predictive tool. We present the results of a suite of conduit flow models Soufrie`re that assess the influence of individual model parameters such as the magmatic water content, temperature or bulk magma composi-tion on the magma flow in the conduit during an extrusive dome erupcomposi-tion. By systematically varying these parameters we assess their relative importance to changes in ascent rate. We show that variability in the rate of low frequency seismicity, assumed to correlate directly with the rate of magma movement, can be used as an indicator for changes in ascent rate and, therefore, eruptive activity. The results indicate that con-duit diameter and excess pressure in the magma chamber are amongst the dominant controlling variables, but the single most important parameter is the volatile content (assumed as only water). Modeling this parameter in the range of reported values causes changes in the calculated ascent velocities of up to 800%.1. Introduction
A volcanic conduit provides the pathway for transport of magma and magmatic fluids within a volcano and it is possible to detect this movement through geophysical monitoring such as seismicity and ground deformation [e.g.,Neuberg et al., 2006;Zobin et al., 2011;Lopez et al., 2013]. However, the extent to which changes in magma flow properties affect the data recorded on volcanoes is not well defined. Is it possible that a small change in magma temperature or water content could alter the flow within the conduit enough to be recorded by geophysical monitoring instruments or simple visual observa-tion? What effect does the size of gas bubbles within the magma have on the overall flow dynamics and how big do these changes need to be to alter the eruption style? These types of question are addressed within this study in an attempt to identify the crucial parameters that cause changes in observed vol-canic behavior.
Here we use conduit flow models to analyze the key input parameters that control magma flow properties, such as the magma water content, crystal content and conduit geometry, and use the numerical simulations to assess their relative importance to the overall magma flow dynamics. A list of all input parameters is pre-sented in Table 1 along with the range of values studied. We focus on evolved silicic magmatic systems because of the wealth of relevant information and previous numerical modeling attempts relating to Sou-frie`re Hills Volcano, Montserrat, a long lived andesitic dome forming eruption [Sparks et al., 2000] and excel-lent natural laboratory. While the initial models are based on extrusive eruptions the results of changing the model parameters have the potential to alter the eruption style and it is noted that the underlying princi-ples discussed here are applicable to other volcanic systems.
2. The Model
The conduit flow models are based on an updated approach ofCollier and Neuberg[2006] outlined in Thomas and Neuberg[2012]. Conduit flow is computed through the use of the finite element modeling package COMSOL MultiphisicsVR. The models are built as cylindrical conduits within an axial symmetric
domain space to minimize computing requirements. The mesh consists of approx. 60 000 elements with a maximum node spacing of 2.75 m and a layer of four boundary elements of 0.2 m thickness near the con-duit wall.
Key Points:
Simulation of parameters controlling magma ascent
Magmatic water content dominates ascent rate
Changes in seismicity rates may indicate changes in volcanic activity
Correspondence to:
M. E. Thomas, m.e.thomas@leeds.ac.uk
Citation:
Thomas, M. E., and J. W. Neuberg (2014), Understanding which parameters control shallow ascent of silicic effusive magma,Geochem. Geophys. Geosyst.,15, 4481–4506, doi:10.1002/2014GC005529.
Received 6 AUG 2014 Accepted 24 OCT 2014
Accepted article online 30 OCT 2014 Published online 28 NOV 2014
In order to assess the effect of altering the model parameters a standard or ‘‘reference’’ model is first defined. This reference model is based on data available in the literature that refers to Soufrie`re Hills Vol-cano, Montserrat, and is outlined in Figure 1 and Table 1. A detailed description of the parameters used in the reference model will follow in section 3.2, while we focus here on an outline of the modeling method. The dimensions of the modeled conduit shown in Figure 1 are inferred from geochemical and observational data from Soufrie`re Hills volcano [Barclay et al., 1998,Sparks et al., 2000], placing minimum depth con-straints of 5–6 km below the surface for the position of the magma chamber and width estimates of 30– 50 m for the conduit.
2.1. Governing Equations
Conduit flow is computed with a finite ele-ment approach, and modeled in an axial symmetric domain space through the com-pressible formulation of the Navier-Stokes equation:
q@u
@t1qu ru52rp1r
ghru1ðruÞTi22
3g½r uI
1F: (1)
and the continuity equation:
@q
@t1r ðquÞ50 (2)
whereqis density,uthe velocity vector,p the pressure,gthe dynamic viscosity andF
the volume force vector (gravity). There is no time dependency in the model and the termsq@u
@tand
@p
@tin equations (1) and (2) can be neglected.
2.2. Magma Composition
[image:2.630.185.583.116.297.2]The properties of the magma are modeled as the averaged properties of its constitu-ents: melt, crystals and gas. For the refer-ence model, the general composition of the melt is taken as rhyolitic, using the
Table 1.Parameters Used in the Reference Model and Range of Parameter Variations Which are Discussed in Section 3.4 Symbol/
Abbreviation Variable ‘‘Reference’’ Model Value
Range of Modeled Values The melt composition Rhyolitic (>71% SiO2) [Barclay et al., 1998] See Table 2
bni Bubble number density 1010m23[Cluzel et al., 2008] 10721011m23 DTBL Thickness of thermal boundary layer over
whichTdiffis lost
0.3 m [Collier and Neuberg, 2006] 0.3–0.5 m
C Bubble surface tension 0.06 Nm21
[Lyakhovsky et al., 1996] 0.05–0.25 Nm21
vc Magma chamber crystal volume fraction 40% [Barclay et al., 1998] 40–50% Ls Slip length of brittle failure of melt 0.01 0.01–1.0 m
Pe Excess chamber pressure above lithostatic 0 MPa 0–20 MPa Ptop Pressure at conduit exit 0.09 MPa 0.09–4.5 MPa
qc Average density of crystal assemblage 2700 kgm23[Burgisser et al., 2010] 2550–3200 kgm23 qm Density of pure melt 2380 kgm23[Burgisser et al., 2010]
T Magma temperature 1150 K [Devine et al., 2003] 1100–1150 K
Tdiff Amount of cooling at conduit wall 200 K [Collier and Neuberg, 2006] 100–200 K
ss Melt shear strength 1052107Pa W% Initial dissolved water content of magma 4.5 wt% [Barclay et al., 1998] 3–8 wt% w, d, r Variables that define the conduit shape
and size
See Figure 4 See section 3.4.4
[image:2.630.183.399.422.725.2]groundmass analysis of Montserrat dome rocks undertaken byBarclay et al. [1998]. However, several melt compositions, defined in Table 2 are ultimately considered to assess the effect of melt composition on the modeled eruption dynamics. Crystal content (vc) and density (qc) are assumed fixed as we assume a
con-stant temperature and that the conduit ascent times are orders of magnitudes faster than the time required for crystal growth by decompression, hence only the phenocrysts present in the magma chamber are accounted for and growth of microlites and microphenocrysts is not considered. The expression for the bulk density of the magma is given by
q5qmvm12vg1qgvg1vcqc12vg; (3)
wherevmis the initial fraction of melt (12vc),qmis the melt density andvgis the gas volume fraction (Table 1). For the gas phase, water is assumed as the only volatile species present and the gas density (qg) is calcu-lated from the ideal gas law
pV5nRT; (4)
whereVis the volume of gas,Rthe ideal gas constant andTthe temperature. The number of moles of water,n, is related to density by
n5M
m; (5)
where M is the molar mass of water andmis the mass of water present. Thus, combining (7) and (8) and considering a unit volume we get
qg5mp
RT (6)
In the reference model a single magma temperature is used with the exception of the temperature across a thermal boundary layer (TBL) defined adjacent to the conduit wall. A linear temperature drop is applied across the TBL, to simulate the cooling of the magma abutting the country rock in a well established con-duit [Collier and Neuberg, 2006]. The gas volume fraction (vg) is calculated by determining how much water remains dissolved within the melt at a particular pressure using the solubility of H2O in rhyolitic melts
pre-sented byLiu et al. [2005]. At high enough pressures, it is assumed that all the water is dissolved within the melt fraction andvgis initially zero, but as pressure decreases, water begins to exsolve out of the melt and forms bubbles. The absolute volume of exolved gas (V) can be calculated through rearranging the ideal gas law (4). This absolute volume of gas is then used to calculate the volume fraction of the bulk magma consti-tuted by the gas phase.
2.3. Magma Viscosity
[image:3.630.182.585.109.170.2]The bulk magma viscosity (g) is determined by first calculating the viscosity of the pure melt phase (gm). This is done using a model for the viscosity of magmatic liquids presented byGiordano et al. [2008], that predicts the viscosity of silicate melts as a function of temperature and melt composition. It is important to note that the composition used in the viscosity model is that of the pure melt phase (rhyolitic) not the over-all magma composition; the whole rock composition of recent Soufrie`re Hills Volcano magma is andesitic [Edmonds et al., 2010], but this includes the contribution of the crystals. The viscosity model is only used to calculate the actual viscosity of the liquid component (the melt), on which the crystals (the solid) have no bearing. When the effect of crystals within the meltisconsidered, the effective viscosity of the melt (liquid) and crystal (solid) mixture (gmc) increases, and can be represented by the Einstein-Roscoe equation
Table 2.Compositions of Melt Used in the Numerical Simulations
Compositiona SiO2 Al2O3 TiO2 FeO MgO MnO CaO Na2O K2O
a 71.41 13.58 0.28 2.78 1.64 0.13 4.86 3.73 1.6 b 76.97 11.21 0.29 1.89 0.26 0.12 1.29 4.07 2.37 c 77.10 9.83 0.18 1.17 0.22 0.10 1.52 4.14 1.72 d 78.66 11.20 0.39 1.93 0.30 0.10 1.48 3.57 2.38
a
gmc5gm 12 vc vcmax
22:5
; (7)
wherevmax
c is the volume fraction of crystals at which the maximum packing is achieved [Marsh, 1981]. A
commonly adopted value ofvmax
c 50.6 [Marsh, 1981] is used within this study. Although this value was
pro-posed for randomly packed spheres, and it has been shown byMarti et al. [2005] thatvmax c tends to
decrease as the particle (crystal) shape becomes less isotropic,Ishibashi[2009] demonstrated that this value seems to be a good approximation as the effect of particle shape onvmax
c is offset by effects of size
hetero-geneity and crystal alignment.
The presence of bubbles also affects the viscosity. If the bubbles within the magma remain undeformed they act to increaseg, but if they are deformed (elongated in the direction of flow), they act to decreaseg
[Llewellin and Manga, 2005]. Whether a bubble is in an undeformed or deformed state is represented by the capillary number
Ca5gmrE
C (8)
whereris the undeformed bubble radius,C, the bubble surface tension andE, a function of the strain rate within the magma flow defined below. If Ca>1 then the bubbles can be considered deformed. Previous studies have calculated Ca as a function of only shear strain rate [e.g.,Pal, 2003;Collier and Neuberg, 2006], of both shear strain rate and the rate of change of shear strain rate [e.g.,Llewellin and Manga, 2005], or of shear strain rate and elongational strain rate [Thomas and Neuberg, 2012]. Here we adopt the approach of the latter. Bubbles can either be deformed though shear or extension, henceEcan be defined as either the shear strain rate (@v/@r) or the elongational strain rate (@v/@z), with the rate that would have the greatest effect on bubble shape (largest value) being used to calculate Ca. To account for strain acceleration or deceleration the dynamic capillary number (Cd) is required [Llewellin and Manga, 2005]; this compares the time scale over which the bubbles can respond to changes in their strain environment with the time scale over which the strain environment changes. If this value is large, the flow is termed unsteady and the bub-bles are unable to deform independently in response to the flow; they act in an unrelaxed, viscous manner, decreasing the relative viscosity of the suspension [Llewellin and Manga, 2005]. For the models considered within this study conditions of unsteady flow are found only in a very small area near the exit of the conduit. Accounting for this within the models resulted in no noticeable change in the derived flow parameters, hence the computation of Cd is not considered within this study.
Depending on the value of Ca,gis calculated using the suggested ’minimum variation’ ofLlewellin and Manga[2005]
Ca5
<1 g5gmc12vg21
>1 g5gmc12vg5=3
8 <
: (9)
By assuming the homogeneous nucleation of a number of bubbles in a unit volume of melt as a single event, which is determined from the initial bubble number density (bni) [Hurwitz and Navon, 1994], the bub-ble radius [Lensky et al., 2002] is given by
r5 S0
3q
mðC02CmÞ
qg
" #1=3
; (10)
whereC0andCmare the initial and remaining amount of water dissolved in the melt respectively andS0is
the initial size of the melt shell from which each bubble grows.S0is related to the instantaneous bubble
number density (bn) through the expression
S03 5
3 4pbn
(11)
bn5
bni
vm vm2 12vg
(12)
2.4. Brittle Failure of Melt
It is now well established that magma, or more specifically the melt component of a magma can fail in a brittle manner [e.g.,Gotto, 1999;Neuberg et al., 2006;Tuffen and Dingwell, 2005;Tuffen et al., 2008].Thomas and Neu-berg[2012] have also demonstrated that the generation of fracture zones at the conduit margins as a result of magma breakage can affect the overall conduit flow dynamics. This is because movement is likely to become concentrated along these fractures and offer reduced resistance to flow, resulting in increased flow velocities in these regions. In order to account for these effects it is necessary to define conditions under which the melt may fracture. Shear failure of melt occurs when the shear stress (ge_Þexceeds the shear strength (ss), and has been represented as the brittle failure criterion [Tuffen et al., 2003;Neuberg et al., 2006;Okumura et al., 2010]
g_e ss
>1 (13)
wheree_ is the shear strain rate. This criterion holds true under the assumption that during unrelaxed defor-mation the accumulation of shear stress in the melt obeys the Maxwell model
rs5
g l
@rs
@t 5ge_ (14)
wherersis the shear stress andmthe shear modulus.
2.5. Boundary Conditions
Flow within the system is driven by a pressure gradient defined by boundary conditions at the top and bot-tom of the conduit. The top boundary is set to atmospheric pressure at the altitude of the conduit exit plus any overburden load from an emplaced lava dome. The bottom boundary is set to lithostatic pressure (assuming a homogeneous country rock density of 2600 kgm23
) plus any imposed overpressure (Pe). Both the top and bottom pressure conditions are held constant throughout the model run. Initial boundary con-ditions along the length of the conduit are defined as no slip. When brittle failure of melt is considered within a model run, in regions of the conduit wall where the brittle failure criterion was exceeded, the boundary conditions are changed to a tangential slip velocity (Du) defined by:
Du51
brs; (15)
wherersis the tangential shear stress to the conduit wall and the coefficientbis a function of the slip length (Ls) which is defined as:
b5g
Ls
; (16)
The model is then rerun to account for the effect of changing boundary conditions at the conduit walls. Where this results in an increase in the predicted failure depth an iterative approach is used and the model is rerun with the new depth for the change in boundary conditions until the depth at which brittle failure of the melt stabilizes. For the purposes of this study the failure depth is considered to have converged if the depth increase between iterative runs is less than 10% of the previous observed increase.
3. Assessing the Sensitivity of Ascent Rate to Changes in Model Parameters
3.1. Magma Ascent Rates
The ascent rate is a key parameter in understanding volcanic hazard as it has been directly linked to erup-tive behavior [Gonnermann and Manga, 2007;Humphreys et al., 2008]. By gaining a better understanding of which model parameters have the greatest effect on ascent rates we can achieve an insight into which are the most important parameters that may control explosivity and the likely severity of the volcanic hazard.
monitoring data. In addition, there are physically observed variations in ascent rate estimated from a variety of methods ranging from studying mineral reaction rims around phenocrysts within erupted magma [ Ruth-erford and Devine, 2003] to studying lava dome morphology [Sparks et al., 2000]. This places constraints on the magnitude of changes to the modeled ascent rate engendered by altering the model input parameters we can consider realistic. Slow ascent rates can be inferred through observations made of extruding magma lobes at displacement rates of 20–30 md21[Sparks et al., 2000], or approximately 2.5
31024ms21. Faster
ascent rates have been calculated from quantifying the break down of hornblende in ascending magma by Rutherford and Devine[2003], these calculated rates ranged between 1023ms21to greater than 2.0
31022
ms21. The value of 2.0
31022ms21obtained through this technique is however a minimum estimation of
the maximum ascent rate as above this value the magma is thought to ascend quicker than the time it takes for the breakdown to occur, leading to an inability to calculate faster rates. This value representing a minimum is reinforced by observations of the growth of the lava dome at Soufrie`re Hills. Measurements of the lava dome volume from radar and photogrammetry have estimated the maximum observed extrusion rates to be20 m3s21[Ryan et al., 2010;Wadge et al., 2010]. Achieving this extrusion rate from our
refer-ence model of a cylindrical conduit 30 m in diameter would require an ascent velocity of 331022ms21.
These estimates, derived from both surface observations and petrological studies suggest that changes in ascent velocity of two orders of magnitude are commonplace.
Matching the absolute values of these observed and calculated ascent rates is currently beyond the scope of the model and this is discussed further in section 5. However we can use the magnitude of the observed variations to provide upper and lower bounds to the extent to which the model input parameters are var-ied. Any changes that produce increases in ascent rate greater than two orders of magnitude over the refer-ence model are not considered realistic in this work. This may seem at first an arbitrary discrimination, but there is a good reason that the observed or calculated ascent rates presented in the literature [e.g., Ruther-ford and Devine, 2003;Castro and Gardner, 2008] are ‘‘slow’’ (<531022ms21). Accent rates faster than this, while likely to exist in nature, would almost certainly result in substantial fragmentation of the magma, mak-ing it very difficult to observe or calculate the actual magma ascent rate below the initial point of fragmen-tation. Fragmentation dynamics are not considered within the current model, hence no valid inferences or conclusions can be gained from studying the model runs that exhibit these fast ascent rates.
3.2. Defining the Reference Model
the conduit wall of 0.3 m thickness over which a liner 200 K cooling is applied. These values were chosen as it is assumed that the temperature difference between the magma and the surrounding country rock decreases with the longevity of the volcanic system, while the width of the TBL grows.
The crystal content of the reference model is based on petrological studies of the Soufrie`re Hills magma [e.g.,Barclay et al., 1998,Murphy et al., 2000] and a value of 40%, at the lower range of those suggested (40– 50%) is used as it is assumed that the crystal content would be at a minimum at the start of the eruption, increasing with time as the magma cooled. The crystal population mainly consists of plagioclase and pyrox-ene phenocrysts and the average crystal density of this population has been taken as 2700 kgm23[Burgisser et al., 2010]. Estimates of bubble number densities range from 107to 1017m23[Hurwitz and Navon, 1994; Lyakhovsky et al., 1996;Cluzel et al., 2008;Giachetti et al., 2010] while suggested values for the bubble sur-face tension range from 0.05 to 0.3 Nm21[Lyakhovsky et al., 1996;Llewellin et al., 2002;Cluzel et al., 2008; Ittai et al., 2011]. We can place some constraints on the bubble number density by considering the typical magma ascent rates discussed in section 3.1. At these ascent rates (<531022ms21) we can assume typical decompression rates of approximately 0.1–1 kPas21, and at these valuesCluzel et al. [2008] demonstrated the bubble number density reaches a maximum of 1011m23and a minimum of 107m23. Incidentally, this minimum estimated value for the bubble number density was based on an absence of magnetite crystals, which were seen to act as preferential bubble nucleation sites. Magnetite is present in the Soufrie`re Hills magma [Devine et al., 1998], so this low value is unlikely to represent normal conditions, hence a bubble number density of 1010m23is used for the reference model. The range of values for bubble surface tension is not as large (Table 1), but it is harder to narrow down. The values depend on how hydrated the melt is, with the larger values being calculated for a dry melt. Our reference model has an initial water content of 4.5 wt%, hence we use a bubble surface tension of 0.06 Nm21representing the fact that the melt is not sig-nificantly dehydrated.
Low frequency seismic swarms are not the everyday observed activity at Soufrie`re Hills. Since it is this type of seismic activity that is thought to lead to the development of conduit margin fractures zones and viscos-ity controlled slip at the conduit walls [Neuberg et al., 2006;Thomas and Neuberg, 2012] we do not include this in the reference model. Rather, the reference model is used to simulate conditions prior to brittle failure and the flow along the entire conduit length is modeled through no-slip boundary conditions. The refer-ence model can then be built on to test individual parameters, one at a time, in order to assess how these parameters may drive the system to reach brittle failure and produce a detectable geophysical signal indi-cating changes in ascent rate.
The remaining two parameters we need to define are the pressure conditions at the bottom and top of the conduit that drive flow. For the reference model we assume there is no overpressure within the magma chamber, and the bottom pressure is set to lithostatic value at a depth of 4 km, assuming an average crustal density of 2680 kgm23. Correspondingly, for a conduit length of 5 km (Figure 1), the pressure at the conduit outlet is set to atmospheric pressure at a height equal to 1 km above sea level, representing the summit elevation.
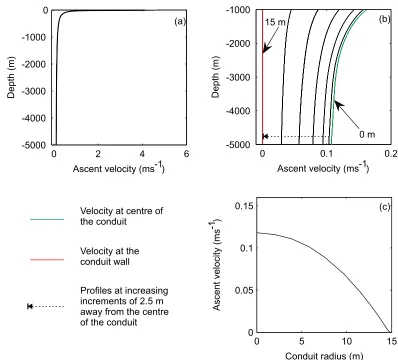
3.3. The Reference Model Results
The results of the reference model to which all other models are compared are shown in Figure 2. Figure 2b shows seven vertical velocity profiles for depths below 1000 m that are spaced at 2.5 m from conduit centre, defined at 0 m, to the full conduit radius at 15 m. It can be seen that the peak ascent velocity occurs, as expected, in the centre of the conduit, with no slip boundary conditions at the conduit wall. At each 2.5 m increase away from the conduit centre the ascent velocity decreases. Figure 2c shows the ascent rate for a horizontal cross section through the conduit at a depth of 2500 m (the middepth of the model space). Integrating along this profile results in an average ascent velocity at this depth of 0.078 ms21. This is the same order of magnitude of ascent velocities as discussed in section 3.1. Integrating over the entire length of the vertical profile of ascent velocity in the conduit centre yields an average ascent velocity of 0.16 ms21. It is these two average velocities that will be used for comparison throughout this study, and will be referred to as the ‘‘total average ascent rate’’ (V) and the ‘‘2500 m depth ascent rate’’ (V 2500). Averaged
for the conduit, or a steady decompression rate calculated from mineral reaction rims turned into a corre-sponding single, average value for ascent rate.
[image:8.630.181.579.94.454.2]We can place a good degree of confidence in the values of ascent velocity modeled below 1000 m as the gas volume fraction at this depth is calculated to be 35% (Figure 3). This corresponds to a similar value for the gas volume fraction proposed for the onset of permeable flow, suggested to control the start of significant permeable outgassing [Candela, 1991;Rintoul and Torquato, 1997]. Consequently, only above 1000 m depth does the gas volume fraction begin to increase markedly above what is likely if permeable outgassing was fully considered. As a result, the modeled magma properties below 1000 m are not significantly affected by slightly elevated volumes of exsolved gas, although the ascent velocity will be raised somewhat due to the requirement of mass conservation, meaning that the flow in this area will be faster than expected as it needs to keep up with the accelerated flow near the con-duit exit. It is also worth noting that the reference model has been parameterized to represent the onset of eruptive activity (section 3.2), resulting in the magma temperature being at the top of the modeled range, and the crystal content being at the lower end of the modeled range (Table 1). These two end members of model parameters contrive a relatively low magma viscosity, which results in a relatively fast ascent velocity. With this in mind and the fact that the modeled values will be elevated due the lack of permeable outgassing, the calculated average ascent velocities of 0.078 ms21at a depth of 2500 m below the conduit exit and 0.16 ms21for the entire conduit length appear rational results, showing the reference model to be a reliable point of comparison with which to judge the effect of changing the model parameters.
3.4. Varying the Model Parameters
To gain an understanding of the relative importance of an individual parameter we first vary each separately (sections 3.4.1–3.4.5). However, as some parameters are intrinsically correlated to others we also model certain combinations of parameter changes in section 3.4.6
3.4.1. Magma Composition
All the published studies of Soufrie`re Hills magmas share the fact that the melt phase is described as rhyolitic [e.g.,Devine et al., 1998;Sparks et al., 2000;Edmonds et al., 2010]. How-ever, this is a very broad classification and the precise com-position can vary considerably (Table 2). In addition, the estimated water content of these magmas varies independ-ently from4 wt.% [e.g.,Murphy et al., 2000] to theoretically greater than 10 wt.% when including the presence of a free gas phase [Burgisser et al., 2010]. Although Bur-gisser et al. [2010] ultimately identified these extremely high total water contents as unlikely, they are included here to assess all possibilities. Therefore it is important to find out how significant these variations are to the modeled conduit flow dynamics. Hence we rerun the reference model with the changed magma compositions b, c, and d listed in Table 2, and we also run separate models with altered initial water con-tents of 2, 3, 6, and 8 wt.%. For these model runs it is assumed the composition and number of crystals/bub-bles does not changes and this is considered separately in section 3.4.3. All results and comparisons of the various model runs can be found in section 4. Since the amount water dissolved in the melt is controlled by the solubility law ofLiu et al. [2005], at the higher water contents the full amount of available water will not be dissolved in the melt at the depths considered. The excess will remain exsolved, and is present in the model as a free gas phase.
3.4.2. Temperature
There are three variables used in the model that relate to temperature. The first is the actual temperature of the magma, and the other two correspond to the cooling of the magma adjacent to the country rock in the Thermal Boundary Layer (TBL). Several different scenarios are modeled and compared to the reference results withTset to 1100, 1110, 1125, and 1140 K. However, the decrease in temperature (Tdiff) and width of
the TBL (DTBL) have been constrained through previous work (Table 1) so only two model runs were
com-pleted in addition to the reference model for each of these variables, withTdiffandDTBLbeing set to 150
and 100 K and 0.4 and 0.5 m, respectively. By varyingTandTdiffindependently we incorporate potential
temperature changes in the confining edifice throughout the eruption history. Model runs where changes in these variables are linked are discussed in section 3.4.6.
3.4.3. Crystals and Bubbles
Although the crystals and bubbles are extremely small compared to size of the overall system they have a large effect on the overall flow properties since they are very efficient at modifying the viscosity of the com-bined fluid and particle suspension. Previous studies report differing crystal and/or bubble populations chang-ing the bulk viscosity of the magma by two to eight orders of magnitude [e.g.,Llewellin et al., 2002;Pal, 2003; Costa et al., 2009]. The crystal content discussed in section 3.2 has a fairly limited range, and accordingly mod-els are run with crystal contents of 42, 45, 48, and 50% volume fraction. With the changes in crystal volume fraction the crystal assemblage may also change accordingly. The average density of the crystal assemblage (qc) reported in Table 1 is based on the phenocryst population consisting of 15 vol% pyroxene and 85 vol%
plagioclase [Burgisser et al., 2010], hence to account for possible additions to, or changes in the relative pro-portions of the assemblage, the model is run using values forqcof 2550, 2800, 3000 and 3200 kgm
23
.
Like the crystal content, the discussion in section 3.2 has also narrowed the range of values for the bubble number density (bni) and bubble surface tension (C) that we consider. Models are therefore run with values forbniof 107, 108, 109and 1011m23and values forCof 0.05, 0.1, 0.2 and 0.25 Nm21.
3.4.4. Conduit Geometry and Conditions Driving the Flow
During each individual simulation the pressure boundary conditions that act as the driving force for conduit flow are kept constant. However during the course of a long-lived silicic dome-forming eruption (such as
0 0.2 0.4 0.6 0.8 1
-5000 -4000 -3000 -2000 -1000 0
Gas volume fraction (%)
[image:9.630.190.328.99.224.2]Depth (m)
Figure 3.Gas volume fraction (vg) for the reference
Soufrie`re Hills) it is entirely possible and indeed likely that the pressure within the magma chamber or at the conduit exit would alter due to factors such as fresh magma injection, or the increased overburden of a growing dome. To represent this fact we run several models with different boundary pressure conditions. To simulate increasing excess chamber pressure from fresh magma injection we run models withPeset to 5, 10, 15 and 20 MPa and to simulate the suffocating effect of a growing lava dome we run models with Ptopset to 2, 3, 4 and 4.5 MPa, where 4.5 MPa represents the overburden pressure of a 200 m high dome
where the density of the dome rock is assumed to be 2250 kgm23[Wadge et al., 2010].
Similarly to the probability of changing pressure conditions, it is likely that the conduit geometry might evolve over the course of a decadal eruption. Hence, for the purpose of this study possible conduit shapes were modeled, representing different conduit widths as well as the narrowing and widening of conduit sec-tions. These are described as cases (a), (b) and (c) in Figure 4. Case (a) is the simplest geometry change and represents a simple change of the conduit radius (r). The reference model radius is 15m so to examine the effect of this parameter the model was also run withrequal to 10, 20, and 25 m. Case (b) represents a nar-rowing of the conduit, but the diameter of the shallow conduit is somewhat constrained by physical obser-vations of spine width (section 2), consequently it was not reduced too far below the reference model radius of 15 m, and a single value for the reduced upper radius (w) of 10 m was used. To assess the impact of the depth of this change the reduction in the conduit radius is modeled at depths (d) of 1500 and 500 m below the conduit exit. Case (c) is similar to (b) but represents a widening of the conduit increasing the radius to 20 and 25 m and again, to assess the importance of the depth of this geometry change each increase in conduit radius was modeled atdof 1500 and 500 m below the conduit exit.
3.4.5. Brittle Failure of the Magma
[image:10.630.202.566.95.313.2]All of the models previously described in section 3 assume simple laminar flow with no-slip boundary condi-tions and do not consider the brittle failure of the melt [e.g.,Gotto, 1999;Tuffen et al., 2003;Neuberg et al., 2006].Thomas and Neuberg[2012] demonstrated the importance of considering the brittle failure of melt as it can have a significant influence on the modeled flow dynamics. Brittle failure of melt has the potential to generate fracture zones adjacent to the conduit walls which allow the magma column to slip during ascent. First we include the brittle failure of melt in the model using values of 107Pa for the melt strength and 0.1 m for the slip length [Tuffen et al., 2003] to test how it changes the ascent rate against the reference model. Next we asses the importance of the melt strength and slip length using values between to 106and 105Pa, and 0.01, 0.5 and 1.0 m, respectively. These values reflect the reduced range of magma strengths expected due to the presence of crystals and bubbles [e.g.,Romano et al., 1996;Okumura et al., 2010] and
the range of fracture sizes observed in nature along conduit margins which determine the variation in the slip length [Tuffen et al., 2003].
3.4.6. Changing Multiple Parameters
Rather than following a Monte Carlo approach and randomly vary all parameters within the defined ranges, which for solve time for each model and the number of vari-ables altered would be computationally inhibitive, we focus on intrinsically linked parameters.
The temperature of the country rock may change due to conduction over an eruption period, but this happens slower than a tem-perature change of the magma, hence if magma temperature (T) changes, the differ-ence between the two (Tdiff) changes
corre-spondingly. Also linked to magma temperature is crystallization; a higher degree of crystallization (i.e., larger values of crystal volume fraction (vc)) is achieved at lower temperatures. Therefore, we ran mod-els with reduced values of bothTandTdiff
compared to those in section 3.4.2, and in addition with increased values ofvcat lower temperatures.
The final pair of linked parameters that we consider is the melt strength (ss) and slip length (Ls). This relationship is based on the fact that if the melt is stronger, it requires a larger accumulation of shear stress to break it, and consequently, the rupture length will increase. Above the point of brittle failure this rupture becomes the length over which slip is considered in equation (15) and since the other terms in this equation are calcu-lated,Lsplays an important role in scaling the rate of slip at the conduit walls.
4. Model Results
4.1. Effects of Changing Magma Composition
[image:11.630.184.395.98.512.2]It is unsurprising that altering the magma composition has an effect on the modeled ascent velocity (Figure 5) for it is well known that the bulk composition of the melt is one of the main parameters which governs magma viscosity [e.g.,Bottinga and Weill, 1972;Shaw, 1972;Hui and Zhang, 2007;Giordano et al., 2008]. However, the four melt compositions modeled (Table 2) were all sourced from the analysis of Montserrat rocks, and all represented a rhyolitic melt, so significant changes due to the slightly different compositions were not expected. This is particularly true for the results presented in Figure 5a as the water content was taken to be a constant value of 4.5 wt.% for the purpose of testing these four compositions. However, the modeled total average ascent rate ranges from 0.03 to 0.16 ms21(Figure 5a). These may not seem like big absolute differences, but to put them in perspective, if we use these average ascent velocities to estimate the rise time of magma from the chamber to the surface within a 5000 m conduit it would range from
Figure 5.(a) Ascent velocities for models with different magma composi-tions and (b) initial water contents. The triangles represent values of the total average ascent rate (V) and the circles represent values of the 2500 m depth ascent rate (V2500). The filled symbols show the results of
approximately 2 days to 8.5 h. If we also con-sider the 2500 m depth ascent rate (Figure 5a) we see that the velocities span the value (2.031022ms21) highlighted byRutherford
and Devine[2003] that may indicate a transi-tion from effusive to more explosive behav-ior. Remembering that all the melts modeled are classed as rhyolitic, these results show that it may be of vital importance to under-stand what the detailed makeup of the melt is rather than assuming a broad composi-tional average.
The initial dissolved water content of the melt is considered as the most important of the individual compositional controls on vis-cosity [Vetere et al., 2008]. If we focus on this aspect of the melt composition it is easy to see why; changing this one parameter has a large effect (Figure 5b). In fact, altering only the initial dissolved water content causes larger changes in the ascent rate than chang-ing all other components of the melt compo-sition combined (Figure 5). The magnitude in the change of ascent rates caused by only altering the initial water content is approxi-mately 10-fold, with the total average ascent rate (V) ranging from 0.06 to 0.55 ms 21 com-pared to 0.16 ms21for the reference model (shown as in-filled symbols in Figure 5b). To use the previous supposition, this would result in estimated rise time differences from chamber to surface of approximately a day to 2.5 h. This is a clear demonstration of the importance of the initial water content in dic-tating the eruption dynamics.
It is noted that some of the modeled abso-lute ascent speeds presented appear very fast. The results are merely presented here with no further consideration, but discussion of the validity and meaning of the results fol-lows in sections 4.7 and 5.
4.2. Effects of Changing Temperatures
[image:12.630.193.389.103.682.2]Altering the three variables within the model that fall under the broad description of changing temperatures has a varying degree of effect. The result of changing these varia-bles on the modeled ascent velocities can be seen in Figure 6. Changing the magma tem-perature has a considerable consequence on the modeled ascent rates, withV ranging between 0.04 and 0.16 ms21(Figure 6a). However, changing the variables that relate to cooling of the magma at the conduit
Figure 6.(a) Ascent velocities for models with different magma tem-perature (T); (b) thickness of the thermal boundary layer (DTBL); and
(c) temperature drop across the thermal boundary layer (Tdiff). The
triangles represent values of the total average ascent rate (V) and the circles represent values of the 2500 m depth ascent rate (V2500).
margins (DTBLandTdiff) has a very minor
direct influence. The largest deviation from the reference model of the total ascent rate (0.16 ms21) caused by altering either of
these variables was only 5.031023
ms21(Figures 6b and 6c). Although the
magnitude of the effects may be different, all the changes are quite intuitive, lowering the magma temperature, higher degrees of cooling at the conduit margins and wider regions of cooling all result in lower ascent speeds.
4.3. Effects of Altering the Properties of the Crystal and Bubble Assemblages
[image:13.630.186.389.97.467.2]First, let us examine the effect of crystals (Figure 7). By increasing the crystal volume fraction from the reference model value of 40–50%,V decreases from 0.16 to 0.02 ms21while the 2500 m depth ascent rate (V2500) decreases from 0.078 to 0.01 ms21
(Figure 7a). Both of these results hint at the importance of the amount of crystals in the magma and suggest that a 10% rise in the amount of crystals has the ability to cause a significant increase in the amount of time it takes the magma to rise to the surface. The results from changing the average density of the crystal assemblage present an inter-esting case (Figure 7b). In contrast to the results from changing almost all of the other model variables the change in ascent velocity withqcis approximately linear. Fur-thermore, the difference betweenV and V2500remains almost constant, rather than
getting significantly smaller at slower ascent velocities. This suggests that com-pared to changing other variables, changingqcequally effects the upper and lower conduit. The overall change in the modeled ascent velocities is also relatively small, withV varying between 0.157 and 0.170 ms 21.
Changing the parameters in the model that relate to the bubbles does not have much effect on the ascent rate (Figure 8). Altering the bubble number density between 107and 1011decreasesV from 0.163 to 0.155
ms21, with the greatest proportion of this decrease only occurring at the largest bubble number densities (Figure 8a). A similar behavior is seen for V2500. Altering the bubble surface tension within the defined range
has more of an impact (Figure 8b), withV ranging between 0.149 and 0.160 ms 21, while V
2500ranges only
between 0.073 and 0.079 ms21. Although altering the bubble surface tension has more of an effect than altering the bubble number density, the change from the reference model results of 0.16 ms21
and 0.078 ms21forV and V
2500respectively are still small (Figure 8b). Similar to the results noted from
changingqc, the difference betweenV and V 2500remains fairly constant for changes in both the bubble
number density and bubble surface tension, suggesting that changes in the properties of bubbles affects the upper and lower conduit equally.
4.4. Effects of Changing the Conduit Geometry and Boundary Conditions
Changing the pressure gradient within the conduit (i.e., the driving force for the movement of magma) by altering either the top or bottom pressure had a marked effect on the modeled ascent dynamics. However,
Figure 7.(a) Ascent velocities for models with different crystal volume frac-tion (vc). (b) Crystal assemblage average density (qc). The triangles represent
values of the total average ascent rate (V) and the circles represent values of the 2500 m depth ascent rate V2500. The filled symbols show the results
for the range of parameters modeled the effect of altering the excess chamber pres-sure was greater than the effect for altering the confining pressure at the conduit exit (Figure 9). By increasing the excess cham-ber pressure from 0 to 20 MPa,V and V2500
increased from 0.16 to 0.29 ms21and 0.078
to 0.16 ms21respectively (Figure 9a).
Con-versely, by increasing the confining pres-sure at the conduit exit from atmospheric pressure to 4.5 MPa,V and V2500decreased
from 0.16 to 0.14 ms21and 0.078 to 0.074
ms21(Figure 9b), respectively.
How the geometry of the conduit could change over time is discussed further in section 4.7.1, but what is evident from the results of the conduit flow models is that the geometry of the conduit has a signifi-cant control on the modeled ascent dynamics. There were three different ways in which the conduit geometry was altered (Figure 4). However, the behavior of the flow was consistent in all three cases (Fig-ure 10). When narrowing a part of, or the entire conduit with respect to the refer-ence model the ascent velocity decreased, and when widening part or all of the con-duit the ascent velocity increased. In detail, the relationship is a bit more complex and will be discussed in section 4.7. It is suffi-cient to note here that the slowest value of
V of 0.061 ms21was caused by narrowing the upper part of the conduit to a radius of 10 m from a depth of 1500 m (Figure 10b) and the fastestV of 0.449 ms21was caused by widening the radius of the entire conduit to 25 m (Figure 10a).
4.5. Effects of Including Magma Fracture and Altering Magma Strength
The variation in ascent rates caused by including magma fracture in the models was surprisingly small, the total range of altered ascent rates caused by including this process and varying either the magma strength or slip length span only 7.6731026ms21and 1.1231025ms21for the V2500andV, respectively (Figure 11).
[image:14.630.190.396.100.484.2]In the reference model where slip was included usingssof 107Pa andLsof 0.1 m, failure was initially observed at a depth of 29 m. As described in section 2.4, if brittle failure was observed in a model, the boundary conditions were changed from that observed depth upward to include slip and the model was rerun with the new boundary conditions. This process was then repeated until the observed depth of brittle failure stabilized. The biggest increase in depth of brittle failure was seen when usingssof 105Pa; causing an increase in the observed depth of failure from 29 to 504 m. This model run also produced the greatest increase in ascent velocities resulting from the inclusion of the brittle failure of melt (Figure 11), and when compared to the results from changing the slip length to larger values (Figure 11) suggest that it is the length of the conduit over which slip can occur that has the greatest effect on ascent rates rather than the absolute distance of slip. We note that the effect on the average ascent rates are small because two differ-ent flow regimes counteract each other above and below the depth of brittle failure. Overall by considering slip at the conduit walls it becomes easier to move material through the conduit and the volumetric
Figure 8.(a) Ascent velocities for different bubble number densities (bni).
(b) Values of bubble surface tension (C). The triangles represent values of the total average ascent rate (V) and the circles represent values of the
2500 m depth ascent rate (V2500). The filled symbols show the results of the
throughput of magma increases. While no-slip boundary conditions maintain a near parabolic flow profile, causing an increase in the ascent velocity in the centre of the con-duit, the slip conditions above the brittle fail-ure depth lead to plug flow, with a reduced velocity in the centre of the conduit.
4.6. Effects of Changing Multiple Parameters
The effects of altering the magma strength and slip length simultaneously seem to have a minimal additional effect on the average ascent rates compared to alter each individ-ually. However, if one considers the flow conditions below and above the brittle fail-ure depth separately (see above) it becomes obvious how the different behavior of para-bolic and plug flow counteract each other as both flows are linked by the conservation of mass. We will discuss this complex behavior together with the influence of conduit geometry in more detail in section 5.3.
Altering the magma temperature in con-junction with changing the temperature decrease across the thermal boundary layer has little impact compared to altering just the temperature, with the largest difference caused by altering both parameters rather than just the magma temperature. This results in decreases of 1.231023ms21forV and 9.031024ms21for V
2500. Both of these
maximum differences represent an increase in the ascent velocities caused by decreas-ing the magnitude of the temperature drop (from 200 to 100 K) across the TBL and occur at the highest modeled magma tempera-tures (Figure 12). This is because the effect of decreasing the temperature drop across the thin layer (Figure 6c) is insignificant compared with the effect of a bulk temperature decrease (Figure 6a) and the resultant average ascent velocities are similar to those reported in section 4.2 for simply changing the magma temperature. In stark contrast, through con-ceptually linking a drop in magma temperature with enhanced crystallization, the effect of jointly alteringT, DTBL, and crystal content has a large effect on the modeled ascent rates (Figure 12 insets). The majority
of this change can be attributed to altering the magma temperature and crystal content, and by increasing the crystal fraction content to 50% at a temperature of 1100 K in conjunction with aDTBLdecrease of 100 K,
the modeled ascent rates drop by an order of magnitude from 0.04 to 0.005 ms21(Figure 12b) and 0.02 to
0.003 ms21(Figure 12a) forV and V
2500respectively. This suggests that any potential linkage between
magma temperature and magma crystal content is very important.
4.7. Comparing the Relative Importance of Chosen Model Parameters
Figures 13 summarizes the sensitivity of ascent rates to different parameters. The single parameter (within the modeled ranges) which has the strongest effect on the ascent velocities is the initial dissolved water content of the magma. This parameter affected bothV and V2500to a large degree. In contrast there are
[image:15.630.187.396.99.487.2]sev-eral model parameters which have little effect on the modeled ascent velocities. These include the thermal
Figure 9.(a) Ascent velocities for models with different excess chamber pressure (Pe) and (b) conduit exit pressure (Ptop). The triangles represent
values of the total average ascent rate (V) and the circles represent values of the 2500 m depth ascent rate V2500. The filled symbols show the results
boundary layer thickness and the tempera-ture drop across it, as well as the bubble number density and bubble surface ten-sion. Modifying the parameters involved in the brittle failure of the melt (magma shear strength and slip length) (section 4.5, Figure 11) has a negligible effect on ascent rates and these results have not been plotted on Figure 13. However, their impact on the flow dynamics is very interesting and will be discussed in section 5.3.
It is unsurprising that the group of model parameters that appear to have the great-est effect on the magma ascent velocity as seen in Figure 13 (water content, tempera-ture, crystal content, and chemical compo-sition) also have the greatest effect on the magma viscosity. Ultimately, modeling the ascent of magma is a fluid flow problem, and the properties that have the biggest effect on the fluid (magma) properties will have the biggest effect on the overall dynamics of the system. All other parame-ters have a much smaller direct effect on the fluid properties, and although if consid-ered in isolation may be important to spe-cific small scale magmatic processes, in respect to magma ascent they are less important. For example by altering the properties of the bubbles within the magma,bniandC, the effect is to change
the shape and number of bubbles in the magma, but their effect on the overall flow is minimal (Figure 13). It appears that it is the total volatile content (water in this case) which is available that is more important than how exactly it is stored in the magma.
4.7.1. Volatile Content and Pressure
The water, or in general the volatile content in a magma controls two mechanisms of altering ascent rate. (i) The ascent rate is increased as there is a larger amount of water dissolved within the melt; reducing the magma viscosity. (ii) The increased water content leads to more exsolved vola-tiles causing the density of the magma to decrease, increasing buoyancy. Both of these mechanisms will influence ascent rate with increasing volatile content.
[image:16.630.187.396.96.658.2]These two effects are manipulated in oppo-site ways by the total pressure in the mag-matic system, which through the solubility law, controls both the amount ofdissolved
Figure 10.Ascent velocities for different conduit geometries. (a) straight conduit with variations in radius (r), (b) a narrowing conduit with reduced upper radius (w) of 10 m, and (c) a widening conduit with increased upper radius (w) of 20 m (open symbols) and 25 m (light filled symbols). The trian-gles represent values of the total average ascent rate (V) and the circles
rep-resent values of the 2500 m depth ascent rate (V2500). The dark filled
volatiles affecting viscosity and the amount ofexsolvedgas available to drive buoyancy. The effect of increasing the excess pressure in the chamber (Pe) is presented in Figure 14 where plots ofV for models with initial water contents of 3, 4.5 and 8 wt.% are shown for differing values ofPe. Although the total increase inPeis the same for all three models (5–20 MPa), there is a much larger increase in the modeled velocity for the case of an initial water content value of 8 wt.%. Compared to changes in the driving pres-sure, the volatile content is seen to dominate the ascent rate. This reinforces the importance of the total vol-atile content in magma to conduit flow dynamics.
4.7.2. Bottom-Up or Top-Down Control
[image:17.630.188.580.105.299.2]All of the results discussed so far in section 4.7.1 relate to changes caused by variations in parameters that would likely originate in the chamber region or deep in the conduit, but can shallower processes also signif-icantly affect the conduit flow dynamics? The two parameters we examine here that represent potential
Figure 11.Plots of (a) the 2500 m depth ascent rate and (b) the total average ascent rate for models where brittle failure of the melt is considered,Lsis the slip length andssthe melt shear strength. The filled symbols show the results of the reference model defined in
sec-tion 3.2. The results of alteringLsto 0.01 m are not plotted as it did not noticeably alter the results of the reference model.
Figure 12.Plots of (a) the 2500 m depth ascent rate and (b) the total average ascent rate for models where the magma temperature (T) and amount of cooling at the conduit wall (Tdiff) are both altered. The black, gray and open symbols representTdiffvalues of 200 K, 150 K,
and 100 K, respectively. The inset shows the decrease in the ascent velocities caused by altering the crystal volume fraction (vc) to 0.5
[image:17.630.189.580.510.706.2]shallow controls arePtopand the alterations in the conduit geometry (as we only consider changes in the
top 500 m). As discussed in section 3.4.4 it is likely that either of these parameters might change over a long running eruption so it is important to see how changes could affect the flow dynamics.
With the exception of a few studies [e.g.,de’ Michieli Vitturi et al., 2008, 2010] the effect of an evolving conduit geometry on the basic dynamics of conduit flow remains largely unexplored. The results presented here show that it is in fact a very important controlling mechanism, and only small changes in geometry cause large change in the modeled ascent rates, with the magnitude of these changes second only to altering the initial dissolved water content (Figure 13). If we look at the role ofPtop, we find that the effect of altering it is not as
great as altering other parameters, but we note that there is a relatively greater effect onV (Figure 13b) than on V2500(Figure 13c). This suggests that this parameter has a greater control on the upper part of the
[image:18.630.202.567.98.548.2]conduit than the lower. While the changes are relatively small, this may make it a very important parameter
Figure 13.(a) The total average ascent rate (V) for each value of the parameters altered. The black bar represents the reference model
with parameters as listed in Table 1. (b) The same data as Figure 13a plotted relative to the reference model, which is represented by the horizontal black line. Parameter changes that caused increases in the ascent rates plot upward from the horizontal line, while parameter changes that caused decreases in ascent rates plot downward. (c) The 2500 m depth ascent rate (V2500) for each value of the parameters
as ultimately it is the behavior of the system in the upper parts of the conduit that dic-tates the eruption style. In summary, the results presented here suggest that shallow changes have the ability to significantly affect the system (particularly changes in the shallow conduit geometry). The notion of such a shallow control on eruption dynamics is not commonly thought of, and changes in the eruptive behavior of a vol-canic system are almost always linked to changes at depth. However, it appears possi-ble that some changes in volcanic activity may indeed be driven by top-down controls.
Finally we like to mention here the role of permeable outgassing and the presence of a free gas phase as an additional top-down control. A free gas phase (exsolved bubbles) has been shown to have an important con-trol on ascent rates, but the amount of free gas present within the system will be determined by degassing mechanisms. Significant gas loss is likely to occur only in the upper region of the conduit, where sufficient pathways for permeable outgassing may be present. Therefore, the ability of the system to store or loose gas is seen as an additional important factor in the potential top-down control of magma ascent dynamics.
5. Limits of the Model
When trying to model such a complex, interdependent system, it is impossible to try and model every pos-sible process, and given realistic time and computing power constraints there will always be some limita-tions in any model of a volcanic system. Here we have developed a model that looks at a wide range of processes and values of individual parameters that represent those processes, all controlling the ascent rate of magma within an established conduit system. How these parameters affect the flow dynamics and their relative importance has been discussed, however, there are some notable omissions that could affect any conclusions drawn, and they are discussed in detail below.
5.1. Independent Bubble Rise, Bubble Growth, and Permeable Outgassing
While it is noted in the introduction that the results presented have applicability to all volcanic systems, the degree of relevance to basaltic systems may be limited. In low-viscosity mafic systems bubbles are known to rise independently of the melt phase [Gonnermann and Manga, 2007]; a process not reflected in the cur-rent model. This process has been suggested as a potential contributor to the style of basaltic eruptions [e.g., Del Bello et al., 2012], hence to fully understand the behavior of low-viscosity mafic systems it needs to be considered in the future. An additional aspect of bubble behavior that is imperfect in the current model is bubble growth. All current bubble growth is considered as occurring under equilibrium conditions and the effect of viscous resistance to bubble growth [e.g.,Melnik et al., 2005;Gonnermann and Manga, 2007] is not taken into account. This means that overpressures are not developed within the bubbles and the possi-bility of fragmentation occurring in response to exceeding a critical overpressure is not reflected. If such a process were to occur it would drastically alter the flow dynamics within the model.
[image:19.630.190.392.100.288.2]The most obvious omission from the model is shallow gas loss from the system, a ubiquitous occurrence at any volcano, underpinning most volcanic activity [Oppenheimer et al., 2003]. It is therefore important to understand how the inclusion of this process may affect the results of the models previously discussed. Since independent bubble rise is not implemented in the current model the discussion here relates only to gas lost via permeable flow. Figure 15 compares the results of the reference model to the results from a model with ‘‘forced’’ permeable outgassing, where gas loss is replicated by instigating an empirical perme-ability depth profile. No permeable outgassing of the system is imposed below 2000 m, corresponding to a porosity of 20% in the reference model (Figure 3). This depth was chosen as a compromise between the
Figure 14.Total average ascent rate (V) verses excess chamber pressure
theory that a porosity threshold is required at which permeable gas flow commences, commonly cited as 30% [e.g.,Candela, 1991;Rintoul and Torquato, 1997], but up to as high as70% for crystal-poor silicic pum-ice [Rust and Cashman, 2011] and works by authors such asMueller et al. [2005];Taddeucci et al. [2006]; and Okumura et al. [2010] which indicate that significant permeability can develop via other mechanisms at low total porosity values (even<30%). Above this depth it is assumed that permeable gas flow is established and a variable amount of the exsolved volatile is lost from the system following a linear gradient ranging from 0% loss at a depth of 2000 m to 95% loss at the conduit top (0 m). This mimics the effect of increasing permeability with decreasing depth (more gas is lost at shallower levels due to the higher developed per-meability) and the value of 95% was chosen as it resulted in a good approximation of the upper value of preexplosive porosity of Montserrat rocks (50–60% vol.) [Giachetti et al., 2010].
The results show that the effect of permeable outgassing on the magma ascent dynamics is significant, and although the magma is only assumed to degas at shallow levels (depths of less than 2000 m) the ascent dynamics of the entire conduit are altered. The ascent velocity is seen to be markedly reduced along the entire length of the conduit (Figure 15a), and there is a clear decrease in the cross-sectional profile of ascent velocity at a depth of 2500 m (Figure 15b), which is significantly below the depth at which permeable out-gassing is implemented. This is mainly due to a feedback effect of increasing the viscosity at depths <2000 m due to the loss of the gas phase. This increases the overall flow resistance of the entire magma column since it is more difficult to extrude the more viscous magma, which acts as a plug. Consequently, if the driving forces behind magma flow remain constant the ascent velocity will decrease. It is because of this change in the entire ascent velocity profile that permeable outgassing is discussed as a potentially important top-down control on conduit ascent dynamics in the previous section. It is also worth noting that by reducing the gas volume fraction through permeable outgassing the ascent velocities are also reduced to a level that matches the magnitudes of the observed rates (102321022ms21) discussed in section 3.1. This indicates that permeable outgassing plays an important role in determining the absolute ascent rates.
These results raise the question of how much we can reliably conclude from the models previously dis-cussed where no permeable outgassing is considered. The results plotted in Figure 16 and presented in Table 3 show a comparison for a sweep of three different variables (excess chamber pressure, crystal vol-ume fraction and initial H2O content) for a degassed conduit versus a nondegassed conduit. Simulating the
permeable outgassing of the magma is observed to have a significant effect, and bothV and V2500are
reduced in the degassed models (Figure 16). However, the relative changes caused by altering the model parameters in bothV and V 2500are very similar for the degassed model and the model where permeable
[image:20.630.239.528.101.229.2]outgassing is not considered (Table 3). While the model presented for permeable outgassing is a simple one and there are more complex solutions in existence [e.g.,Gonnermann and Manga, 2007;Ida, 2007], the aim was not to accurately model gas flow, which no model currently does, but to the examine the broad effects of gas loss. The implemented model does this and the results suggests while gas loss may act to globally slow magma ascent, potentially causing changes to the secondary processes that occur within the conduit, the general overall effect of changing the model parameters on the ascent dynamics are the same whether permeable outgassing is considered or not. Consequently, although the results presented in sec-tion 4 overestimate the ascent rate, the processes that determine relative changes in magma ascent velocity
remain valid, and we can still use the mod-els to assess the relative importance of individual model parameters.
5.2. Cooling and Decompression Induced Crystallization
As described in section 2.2 the crystal con-tent is kept fixed within each individual model run as we assume a constant tem-perature and that the conduit ascent times are orders of magnitudes faster than the time required for crystal growth by decom-pression. This is an assumption made for ease of modeling, and reported crystal growth rates of 1028210212ms21for hydrous felsic systems in response to mul-tistep and single-step decompressions [Hammer, 2008] compared to the calcu-lated average ascent rates of 1023 (consid-ering degassing) to 1021ms21support this assumption. However, the results pre-sented in section 4.6 suggest that any link-age between decreases in temperature and increases in crystal content could be very significant. In additionSparks et al. [2000] indicated that crystallization of microlites within the magma due to decompression during ascent may also play an important role. Hence, crystal and microlite growth will be considered in future developments of our model to include processes with longer time scales.
5.3. The ‘‘Real’’ Effect of Brittle Failure
As presented in section 4.5 the depth at which the models presented in this study predict the fracture of magma is
[image:21.630.194.392.101.665.2]shallow;<500 m. At this depth the viscos-ity of the magma is very high and the slip velocity (equation (15)) is correspondingly low. However, the location of low-frequency earthquakes, thought to be the geophysical signals produced by the frac-ture of melt are observed at Montserrat to occur at much deeper levels [Neuberg et al., 2006]. This is a problem addressed byThomas and Neuberg[2012], who found that by altering the conduit geometry it is possible to cause fracture of the melt at deeper levels. This is because changes in the conduit geometry along its length cause divergence or convergence of the flow field within the conduit. This produces increases in the shear strain rate, and ulti-mately an increase in the shear stress
Figure 16.Ascent velocities for models with different values of (a) excess chamber pressure (Pe); (b) crystal volume fraction (vc); and (c) initial
dis-solved water content (W%). The triangles represent values of the total
aver-age (V) ascent rate and the circles represent values of the 2500 m depth
ascent rate (V2500). Open symbols represent nondegassed models and gray
(equation (14)) accumulated within the magma. Work by other authors [e.g.,Costa et al., 2007; Hautmann et al., 2009] suggest a significant change in geometry at a depth of approximately 1500 m below the dome. Assuming that this change in geometry is able to cause locally high enough stresses to fracture the magma, this means that now a larger con-duit section experiences a lower flow resistance as a result of slip conditions at the conduit walls above the brittle failure depth, accelerating the extrusion rate. If we apply the slip boundary condi-tions discussed in section 2.5 from a depth of 1500 m with a slip length of 0.1 m the total average ascent rate increases to 0.23 ms21.
Compared to the reference model total average ascent rate of 0.16 ms21this is a significant increase and
demonstrates the potential of the generation of fracture zones at the conduit walls to alter the overall con-duit flow dynamics.
Another consideration concerns possible reductions in the viscosity term used in the calculation of the slip velocity in equation (15). We assume the viscosity of the magma as the viscosity of the slip surface. The slip surface may be lubricated by escaping volatiles leading to a reduction in the apparent viscosity of the slip surface and a further reduction in the flow resistance. The overall acceleration of magma extrusion due to a reduction in the resistance to flow at the conduit walls could also explain the accelerating behavior of earth-quake swarms recorded at Montserrat [e.g.,Hammer and Neuberg, 2009]. However, it should be noted that the effect of brittle failure might be reduced by the potential healing of the fractures [e.g.,Yoshimura and Nakamura, 2010] not considered in this study, or by the lowering of the magma viscosity via shear heating at the conduit margins, reducing the shear stress accumulation (equation (14)). The relative importance of shear heating in mitigating brittle failure of the melt can be characterized by a Brinkman Number [e.g., Gon-nermann and Manga, 2007]. However, for this study shear heating is not included as we assume that brittle failure of the melt is ultimately achieved; being considered the source process of the of low frequency seis-micity observed at silicic volcanoes [e.g., Gotto, 1999;Tuffen et al., 2003;Neuberg et al., 2006;Thomas and Neuberg, 2012].
6. Implications for Volcanic Conduit Modeling and Volcano Monitoring
With never ending increases in computing power and the growing availability of user-friendly modeling software there is a mounting tendency for numerical models within the geosciences to grow ever more complex. Volcanology is not immune to this trend, but the results presented here show that it is sometimes the most basic model parameters, which appear to affect the whole system to the greatest degree. In partic-ular the water content of the magma has been shown here to be a very important factor, and this mostly likely extends to other volatile species not considered. Yet it is very difficult to say how, why, or when this parameter may change during an extended period of volcanic unrest or eruptive activity. For example, even in a theoretically simple case of small volume; mafic; monogenetic volcanism, where one may expect the single pulse of erupted magma to be reasonably homogeneous, melt volatile contents have been shown as highly variable [e.g.,Johnson et al., 2010]. In cases such as thisJohnson et al. [2010] have shown H2O
[image:22.630.180.436.126.298.2]concen-trations to alter by 1–2%, even in melt inclusions that were calculated to have been trapped at the same pressure and erupted at the same monogenetic vent. Variations of this magnitude have been shown here to have a significant effect on the ascent dynamics of magma, and hence the eruptive activity. If this level of variance is evident in a relatively simple geological scenario, the potential degree or variability in the more complex, long-lived silicic volcanic systems considered in this study is likely to be much greater.
Table 3.Sensitivity Analysis of Ascent Rate for Degassed and Nondegassed Models
Model parameter
Total Average Ascent Rate (V)
Min. Value (ms21) Max Value (ms21) % Change
Pe 0.157 0.291 85
Pe*
a
0.059 0.159 169
vc 0.020 0.157 685
vc*a 0.007 0.059 742
W% 0.061 0.553 806
W%*
a
0.021 0.223 961
Model parameter
2500 m depth ascent rate (V2500)
Min. Value (ms21
) Max Value (ms21
) % Change
Pe 0.078 0.156 100
Pe*
a
0.038 0.102 168
vc 0.010 0.078 680
vc*
a
0.005 0.038 660
W% 0.029 0.276 851
W%*
a
0.013 0.154 1084
a