promoting access to White Rose research papers
Universities of Leeds, Sheffield and York
http://eprints.whiterose.ac.uk/
This is an author produced version of a paper published in
Proceedings of the
Combustion Institute.
White Rose Research Online URL for this paper:
http://eprints.whiterose.ac.uk/77763/
Paper:
Bradley, D, Lawes, M, Liu, K and Mansour, MS (2013)
Measurements and
correlations of turbulent burning velocities over wide ranges of fuels and elevated
pressures.
Proceedings of the Combustion Institute, 34 (1). 1519 - 1526.
Measurements and Correlations of Turbulent Burning Velocities over Wide Ranges of Fuels and
Elevated Pressures
D. Bradley1, M. Lawes1, Kexin Liu2, M.S. Mansour3
1
School of Mechanical Engineering
University of Leeds, Leeds LS2 9JT, UK
2
Siemens Industrial Turbomachinery (SIT) Ltd, Lincoln, UK
3
Clean Combustion Research Center, King Abdullah University of Science and Technology, Thuwal,
Saudi Arabia
Corresponding author: D. Bradley
Fax --113 343 2150
e mail: d.bradley@leeds.ac.uk
Colloquium: Turbulent flames
Method of word count: Method 1
Total length of paper
6213 wordsWord count
Main text
Equations
References
Table
Table 1
Table 2
Table 3
Figures
Figure 1
Figure 2
Figure 3
Figure 4
Figure 5
Figure 6
Figure 7
Figure 8
Abstract
21?? (by Microsoft Word count)
258 (recommended algebraic expression)
437 (recommended algebraic expression)
365 (recommended algebraic expression)
91 double column
167 Single column
107 double column
3113 (reduced to reproduction size and algebraic expression)
183 single column
Abstract
The implosion technique has been used to extend measurements of turbulent burning velocities over
greater ranges of fuels and pressures. Measurements have been made up to 3.5 MPa and at strain rate
Markstein numbers as low as -23. The implosion technique, with spark ignition at two opposite wall
positions within a fan-stirred spherical bomb is capable of measuring turbulent burning velocities, at higher
pressures than is possible with central ignition. Pressure records and schlieren high speed photography
define the rate of burning and the smoothed area of the flame front. The first aim of the study was to
extend the previous measurements with ethanol and propane-air, with further measurements over wider
ranges of fuels and equivalence ratios with mixtures of hydrogen, methane, 10%hydrogen-90% methane,
toluene, and i-octane, with air. The second aim was to study further the low turbulence regime in which
turbulent burning co-exists with laminar flame instabilities.
Correlations are presented of turbulent burning velocity normalised by the effective rms turbulent velocity
acting on the flame front, ut uk, with the Karlovitz stretch factor,K, for different strain rate Markstein
numbers, a decrease in which increases ut uk. Experimental correlations are presented for the present
measurements, combined with previous ones. Different burning regimes are also identified, extending from
that of mixed turbulence/laminar instability at low values ofKto that at high values ofK, in which ut uk
is gradually reduced due to increasing localised flame extinctions.
Keywords: Premixed turbulent flames, turbulent burning velocity, high pressure, turbulent/laminar flame
1. Introduction.
Measurements of inwardly propagating explosion flame kernels enable burning velocities to be measured
close to the safe working pressure of the explosion bomb. This implosion technique, with ignition at
diametrically opposite spark electrodes has been employed to measure both laminar [1] and, in a
fan-stirred bomb, turbulent [2] burning velocities. In the latter, pressure measurements and schlieren high
speed flame photography define the smoothed area of the turbulent flame front and the mass rate of
burning during the implosions, to yield associated values of turbulent burning velocity, ut.
Over a wide range of conditions the ratio of
u
t, to the effective rms turbulent velocity,u
k
, that allows forthe development of the flame kernel, can be expressed in terms of the Karlovitz stretch factor,K, by [2, 3]:
k t
u
u
=U = αK
, forK> 0.05. (1)α and β are constants expressed by first order expressions in terms of the strain rate Markstein number,
,Masr.Kis given by [3]:
2 0.525 .
0
u u Rl
K , (2)
where u is the measured rms turbulent velocity and Rl the turbulent Reynolds number, ul, withlthe
integral turbulence length scale and the kinematic viscosity.
The study has two principal aims. The first is to measure
u
t with five additional and contrasting fuels atdifferent pressures and equivalence ratios,, to ascertain whether Eq. (1) is generally applicable. The range
ofMasrvalues is extended from -11 to 3 in [2] to -23 to 5. This parameter is important, in that it expresses
fuel effects arising from flame stretch sensitivities. The maximum laminar flame speed has been similarly
used as a correlating parameter in [4]. The second aim is to study the regime ofK< 0.1, in which there is
strong evidence of coupling between turbulence and laminar flame instabilities, giving increased values of
U[5, 6]. The fuels in [2] and [3] were ethanol and propane and in the present study, hydrogen, methane,
2. Experimental method
Key dimensions are represented for the propagating flame kernels on Fig. 1. Turbulent flame
surfaces are represented by smoothed spherical surfaces, with the mass of unburned gas within the
surface equal to the mass of burned gas outside it. The surface is defined in relation to the
schlieren front. The centre of the curvature of the smoothed flame front, flame radius,
r
, is usually
outside the inner wall of the spherical bomb. The complete analysis leading to the derivation of
t
u
, assumed to be the same for both kernels, is given in [2]. The mass burned,
mu
, is deduced
from the flame front geometry. This must be compatible with that deduced from the measured
pressure,
p
. Values of
k
, which controls the position of the centre of the flame cusp radius, see Fig. 1,for
each kernel were fine-tuned to achieve this. The area of each single flame surface was found and
this together with
dmu dt, yielded [2]:
4 3
2 2
1
cos
3 r dt dp u p p R u o o e ot
.
(3)
indicates the summation of both flame areas, po original pressure, pe at the end of the explosion, ooriginal density, and u unburned gas density at pressure, p. In [2] it is shown that
k
1
r
R
2
k
r
R
cos
2
2 .The spherical stainless steel bomb has an internal radius, R, of 190 mm. That of a sphere with the same
internal volume as the bomb, R0, is 192.78 mm. It has three pairs of orthogonal windows of 150 mm
diameter. Turbulence was generated by four identical, fans, located close to the wall, each driven by a
directly coupled electric motor with independent speed control. The fans were in a regular tetrahedron
configuration, to create a central region of uniform, isotropic turbulence, with u measured by laser
In its early stages the flame is only wrinkled by the smaller wavelengths of the turbulent spectrum, with an
effective rms at the flame front of uk [3], with uk u found from integration of the turbulent power
spectral density function between the limiting wave numbers [7]. Rapid compression of unburned gas
decreases the length scale below the initial value and conservation of angular momentum increases uk [8].
Allowances were made for these, as well as the small effect of the changes inland u, on values ofK[3].
Electric heaters at the wall provided up to 6 kW for preheating the vessel and mixture up to 358K,
measured by a thermocouple. Gaseous mixtures were made directly in the bomb using partial pressures,
whilst liquid fuels were metered and introduced using a syringe. Complete evaporation was checked from
partial pressures. Pressures were measured with a Kistler pressure transducer. Ignitions occurred
simultaneously at two diametrically opposite spark plugs, with spark gaps 11 mm from the inside wall,
with energies of about 23 mJ. Flame front propagations were observed by schlieren photography, using a
high speed, Phantom digital camera, synchronised with the pressure measurements.
The camera had 256 Megabytes integral image memory and framing rates of 6,300 and 9,000 frames/s
with pixels of 480 480 and 384 384 and respective resolutions of 0.3986 and 0.4065 mm/pixel.
Further details are in [2, 9].
3. Experimental results
Experimental conditions are summarised in Table 1. Figure 2 shows variations of ut with p for
stoichiometric mixtures of three fuels, for po = 1.0 MPa, with u =1 and 2 m/s. The top scale gives the
unburned gas temperature for isentropic compression from the GasEq Code [10]. These compressions
result in linear increases in ut with pressure, with the highest values for the hydrogen/methane mixture.
Values of ut are means derived from five explosions, with one typical spread of values indicated by
vertical lines.
Variations of ut with uk during implosions are given in Figs. 3 and 4. Figure 3 is for CH4-air, with initial
mixtures, po= 1.0 MPa, with = 0.4, 0.6 and 0.8, also at different u. Different symbols show the scatter
in ut, while the lines represent the best fit.
Values of ut increase linearly with uk in Figs. 3 and 4, up to 3.5 MPa. For the lean H2mixtures in Fig. 4,
values of ut at a given uk tend to increase with , as Masr decreases. Space limitations preclude the
presentation of all the experimental data, but these are available from the corresponding author.
4. Discussion of results
4.1 Fully turbulent regime, K > 0.1
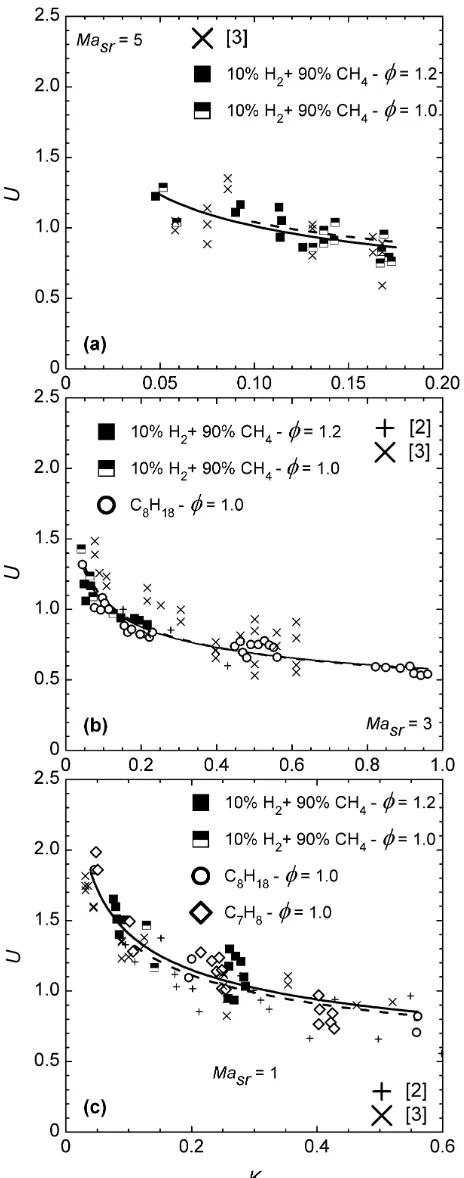
Experimental points, from the data in Figs. 2 to 4 and additional data, are plotted on Figs. 5 (a) to (c) for
positive values of Masr. Plots for negativeMasrare given on Figs. 6 (a) to (f). Sources for u andMasrare
referenced in Table 2. For toluene and the hydrogen-methane mixtures these were obtained directly from
centrally ignited laminar flame measurements up to 1.0 MPa and 358K. Error bands on values of Masr are
usually about ± 1. Extrapolations were necessary to obtain values at the higher temperatures and pressures
of the implosions. As in previous studies, mass burning velocities, ut, are those associated with the
smoothed flame surface, where the mean reaction progress variable is close to 0.59.
Full line curves on Figs. 5 and 6 are best fits to the data points, in terms of “R2” values. From these, expressions were derived for each value ofMasr, for the optimal correlation of all the experimental points.
Based on all the present measurements and those in [2] and [3], these expressions are:
For positive values of Masr, = 0.023(30-Masr)and =0.0103(Masr-30) and (4)
for negative values of Masr, =0.085(7-Masr) and =-0.0075(Masr+30). (5)
The broken curves on Figs. 5 and 6 express Eqs. (1), (4), and (5). Despite some scatter, bearing in mind the
uncertainty in values ofMasr, the data are represented satisfactorily by these three expressions.
At low values of u the flame remains laminar-like and susceptible to laminar flame instabilities [5, 6, 15].
ForK< 1 values ofUare plotted againstKlogarithmically for three values ofMasrin Fig. 7. Values ofU
peak, over quite narrow ranges ofK. At very low values ofKthe parameter,U,becomes less informative,
as u 0,U ∞, andUmight better be replaced by the unstable laminar burning velocity normalised
by u [1]. Peak values ofUare analysed in terms of the interplay of the smallest wavelengths of a reacting
turbulent eddy on the Gibson length scale, lG, and that of the Darrieus-Landau, themo-diffusive laminar
instability,ls,, at the inner cut-off [1].
Let lsbe normalised by the flame thickness, = u, to give
Λ
s, which depends upon Masr,. For thethree mixtures in Fig. 7 values from planar fluorescence measurements in [16], are listed in Table 3. It is
readily shown that:
1
u
u
R
ll
l
s s . (6)In [16, 17]lGis given by:
2
3 u u l
l G . (7)
From Eqs. (6) and (7)
4 18
lG
u
u
R
l
l
s s , and from Eq. (2), (8)2
128
K
l
l
s G
s . (9)The wavelength ratio ls lG indicates the relative contributions of laminar flame instabilities and
hydrodynamic turbulence to flame wrinkling. A small ratio indicates little wrinkling within the smallest
unstable wavelength by the reacting turbulent eddies. A large ratio indicates extensive wrinkling, to the
extent that turbulence finally dominates. The maximum value of Uof about 7 occurs when the combined
is initiated are indicated by Ki on Table 3. Corresponding values of ls lG from Eq. (9), of approximate
order unity, are shown in the next column. The following column shows values of K, namelyKm, at which
Uis a maximum, with corresponding values of ls lG , of about 15.
As K increases further,Udeclines, as the wrinkling from the growing turbulence wavelengths associated
with increase in u, dominates the flame wrinkling, with eradication of the influence of the original
instability wavelength. Table 3 shows values ofK, namelyKt,, from Fig. 7, at which the enhancement ofU
terminates. The associated values of ls lG range from about 23 to 31, with Kt close to 0.1, for the two
highly unstable mixtures. This value is close to the limits for the termination of instability effects observed
in [19, 20] and plotted[21]. Similarly, in the present work these effects terminated at ut u> 3, as
previously observed experimentally in [22].
5. Conclusions
The correlation of turbulent burning velocities has been extended to cover 7 fuels at different equivalence
ratios,Masr down to -23, and pressures up to 3.5 MPa. In Fig. 8 the full line curves represent the general
correlations, Eqs. (1), (4) and (5), within their bounds of experimental validity. The broken curves are
extensions beyond those bounds, up to the dotted curve. This curve identifies approximate points at which
there is a probability of 0.8 of an initial flame kernel continuing to propagate, which is indicative of the
onset of flame quenching at a value of K identified by K0.8. This limit curve is obtained from the
correlation for K0.8in [23], but extends no lower thanMasr= -3.0. The upper dotted curve, at lower values
ofK, shows the inner limit for Eqs. (1), (4) and (5), created by Ktwhen the coupling between turbulence
and laminar instability appears to have ceased at the different values of Masr. In zone A, at values of K
lower than these, the flames are subject to this coupling and U reaches values as high as 7, when flame
wrinkling due to both flame instabilities and turbulence is a maximum.
Zone B extends between K values of Kt and K0.8. In the range 0.4 < K < 2, at a given Masr, very
approximately ut is proportional to
u
k
. The value of ut is primarily dependent on the amplitude of theflame wrinkling. The arrowed vertical line at constant Kindicates an increased rate of burning in laminar
flamelets, independent of that due to flame wrinkling, as Masris decreased in the predominantly positively
stretched flames. This results in an increase in the localised laminar burning velocity in the flamelets. An
additional factor is that a decrease in Masr appears to be associated with an increase in the extinction
Zone C is that in which K > K0.8. Here, as flame quenching develops, flame fronts begin to loose their
coherence and measurements ofutbecome progressively more difficult.
Acknowledgement
The authors are grateful to the University of Helwan for support of M.S.M.
References.
1. A.S. Al-Shahrany, D. Bradley, M. Lawes, R. Woolley, Proc. Combust. Inst. 30 (2005) 225–232.
2. D. Bradley, M., Lawes, M.S Mansour, Proc. Combust. Inst. 33 (2011) 1269–1275.
3. D. Bradley, M. Lawes, M.S. Mansour, Combust. Flame,158 (2011) 123-138.
4. P.P. Venkateswaran, A. Marshall, Dong HyukShin, D. Noble, J. Seitzman, T. Lieuwen, Combust Flame
158 (2011) 1602-1614.
5 H. Kobayashi, T. Tamura, K. Maruta, T. Niioka, F.A. Williams, Proc. Combust. Inst. 26 (1996) 389-396.
6. Derek Bradley, Malcolm Lawes, Morkous S. Mansour, Flow Turbulence Combustion, 87 (2011)
191-204.
7. D. Bradley, M., Lawes, M.S Mansour, Proc. Combust. Inst. 32 (2009) 1587-1593.
8. R.J. Tabaczynski, F.H. Trinker, B.A.S. Shannon, Combust Flame 39 (1980) 111-121.
9. D. Bradley, M.Z. Haq, R.A. Hicks, T. Kitagawa, M. Lawes, C.G.W. Sheppard, R. Woolley, Combust.
Flame 133 (2003) 415-430.
10. C. Morley, Gaseq Chemical Equilibrium Program, c.morley@ukgateway.net.
11. D. Bradley, M. Lawes, Kexin Liu, S. Verhelst, R. Woolley, Combust. Flame 149 (2007) 162-172.
13. M.P. Ormsby, Turbulent Flame Development in a High-Pressure Combustion Vessel, Ph.D. Thesis,
University of Leeds, 2005.
14. D. Bradley, R. A. Hicks, M. Lawes, C.G.W. Sheppard, R. Woolley, Combust. Flame 115 (1998)
126-144.
15. F. Creta, M. Matalon, J. Fluid Mech. 680, (2011) 225–264.
16. D. Bradley, C.G.W. Sheppard, R. Woolley, D.A. Greenhalgh, R.D. Lockett, Combust. Flame, 122
(2000) 195-209.
17. D. Bradley, Twenty-Fourth Symposium (International) on Combustion, pp. 247-262, The Combustion
Institute, 1992.
18. D. Bradley, Combust. Theory and Modelling, 6 (2002) 361-382.
19. H. Kobayashi, T. Tamura, K. Maruta, T. Niioka, F. Willams, Proc. Combust. Inst. 26 (1996) 389-396.
20. H. Kobayashi, Y. Kawa bata, K. Maruta, Proc. Combust. Inst. 27 (1998) 941-948.
21. D. Bradley, P.H. Gaskell, X. J. Gu, A.Sedaghat, Combust. Flame 143 (2005) 227-245.
22. A.S. Al-Shahrany, D. Bradley, M. Lawes, Kexin Liu, R. Woolley, Combust. Sci Tech. 178 (2006)
1771-1802.
Table 1. Ranges of experimental parameters in present study, pressure in MPa and u in m/s.
H2 CH4 C7H8 C8H18 10%H2-90%CH4
0.3,0.4,0.5,0.6,0.8 0.9 1.0,1.2 1.0,1.4 0.8, 1.0,1.2po 0.5,0.7,1.0 0.1,0.5,0.75,1.0,1.25 0.5,0.75,1.0 0.5,1.0 0.5,0.75,1.0
[image:12.595.116.356.244.537.2]u 1,2,3,4 0.2,0.25,0.5,0.75,1,1.5,2 1,2,3,4 1,2,3 1,2
Table 2. Values of u (m/s) andMasr for mixtures in present study.
Table 3. Initiation and termination of instability.
p H2[11]
1.0 2.0 3.0
u
Ma
sr uMa
sr uMa
sr0.3 0.08 -5.59 0.06 -5.77 0.05 -5.87
0.4 0.21 -5.94 0.15 -6.12 0.13 -6.22
0.5 0.39 -7.19 0.29 -7.37 0.24 -7.47
0.6 0.80 -13.4 0.64 -18.9 0.56 -22.2
0.8 1.42 -13.8 1.23 -20.0 1.13 -23.6
CH4[12]
0.9 0.17 -3.57 0.14 -5.69 0.13 -6.93
C7H8[present work]
1.0 0.19 0.47 0.19 -4.32 0.19 -7.13
1.2 0.13 -5.51 0.12 -10.5 0.11 -13.4 i-C8H18[13, 14]
1.0 0.25 3.13 0.23 2.22 0.22 1.68
1.4 0.11 2.35 0.1 2.04 0.1 2.06 10%H2– 90% CH4[present work]
0.8 0.23 4.06 0.17 -0.71 0.14 -5.48
1.0 0.23 4.61 0.18 0.75 0.16 -3.12
1.2 0.13 1.32 0.1 1.07 0.08 0.92
Masr
Λ
s[16]Initiation Maximum value Termination
Ki ls lG Km ls lG Kt ls lG
3 2270 0.004 4.6 0.0073 15.5 0.009 23.5
-19 50 0.011 0.77 0.048 14.7 0.07 31.4
[image:12.595.131.500.623.726.2]Figure 1. Configuration of twin kernels with key dimensions.
[image:13.595.164.437.410.657.2]Figure 3. Variations of utwith uk for CH4-air,
= 0.9, po = 0.5 and 1.25 MPa, for different u. SolidFigure 4. Variations of utwith uk for different lean H2-air mixtures, =0.4, 0.6 and 0.8, po= 1.0 MPa
Figure 5. Correlations of present measurements for positive Masr,K> 0.05. Full line curves are best fit curves. Broken curves express Eqs. (1), (4), and (5) forK ≥ 0.1. Cross and multiplication symbols are from
Figure 6. Correlations of present measurements for negative Masr,K> 0.05. Full line curves are best fit curves. Broken curves express Eqs. (1), (4), and (5), forK ≥ 0.1. Cross and multiplication symbols are
Figure 7. Correlation forK<0.1, showing increasedUdue to turbulent/unstable laminar flame interactions.
Figure 8. Regimes of turbulent combustion, showing extension of zone of unstable flamelets at increasing
[image:18.595.182.424.432.633.2]Figure Captions
Figure 1. Configuration of twin kernels with key dimensions.
Figure 2. Variations of utwith p (lower scale) and T (upper scale) for stoichiometric mixtures of three fuels at po= 1.0 MPa, with u = 1 and 2 m/s.
Figure 3. Variations of utwith uk for CH4-air,
= 0.9, po = 0.5 and 1.25 MPa, for different u. Solidand broken lines are best fit curves. Values of velocity are for u. Each large symbol represents a particular pressure in MPa, indicated by an adjacent number.
Figure 4. Variations of utwith uk for different lean H2-air mixtures, =0.4, 0.6 and 0.8, po= 1.0 MPa
and different u. Solid and broken lines are best fit curves. Values of velocity are for u. Each large symbol represents a particular pressure in MPa, indicated by an adjacent number.
Figure 5. Correlations of present measurements for positive Masr, K> 0.05. Full line curves are best fit curves. Broken curves express Eqs. (1), (4), and (5) forK ≥ 0.1. Cross and multiplication symbols are from
data in [2] and [3].
Figure 6. Correlations of present measurements for negative Masr, K> 0.05. Full line curves are best fit curves. Broken curves express Eqs. (1), (4), and (5), for K ≥ 0.1. Cross and multiplication symbols are
from data in [2] and [3].
Figure 7. Correlation for K < 0.1, showing increased U due to turbulent/unstable laminar flame interactions.
Figure 8. Regimes of turbulent combustion, showing extension of zone of unstable flamelets at increasing